. 2015 Apr;64(4):1120-30.
doi: 10.2337/db14-1238. Epub 2014 Oct 14.

Characterization of distinct subpopulations of hepatic macrophages in HFD/obese mice

Affiliations

Characterization of distinct subpopulations of hepatic macrophages in HFD/obese mice

Hidetaka Morinaga et al. Diabetes. 2015 Apr.

Abstract

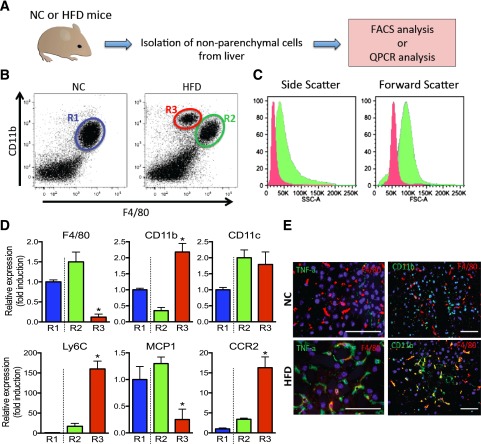
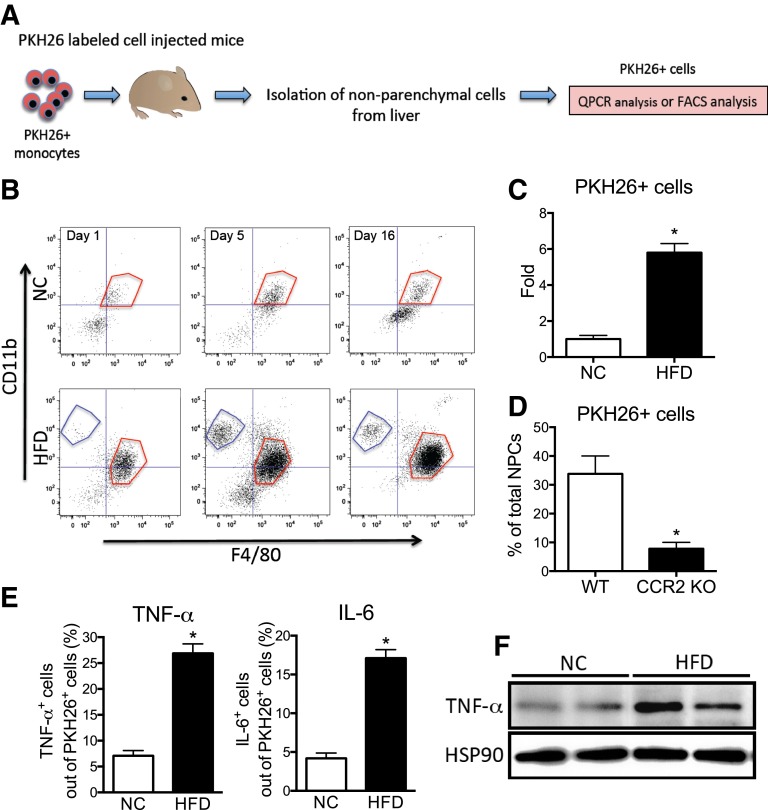
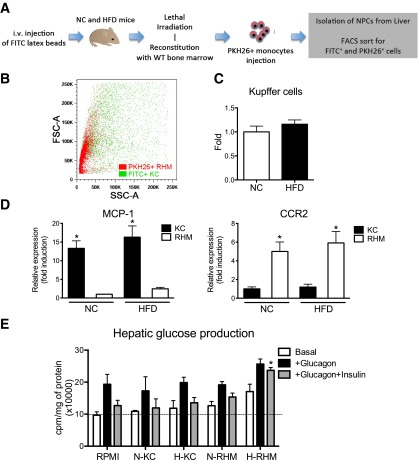
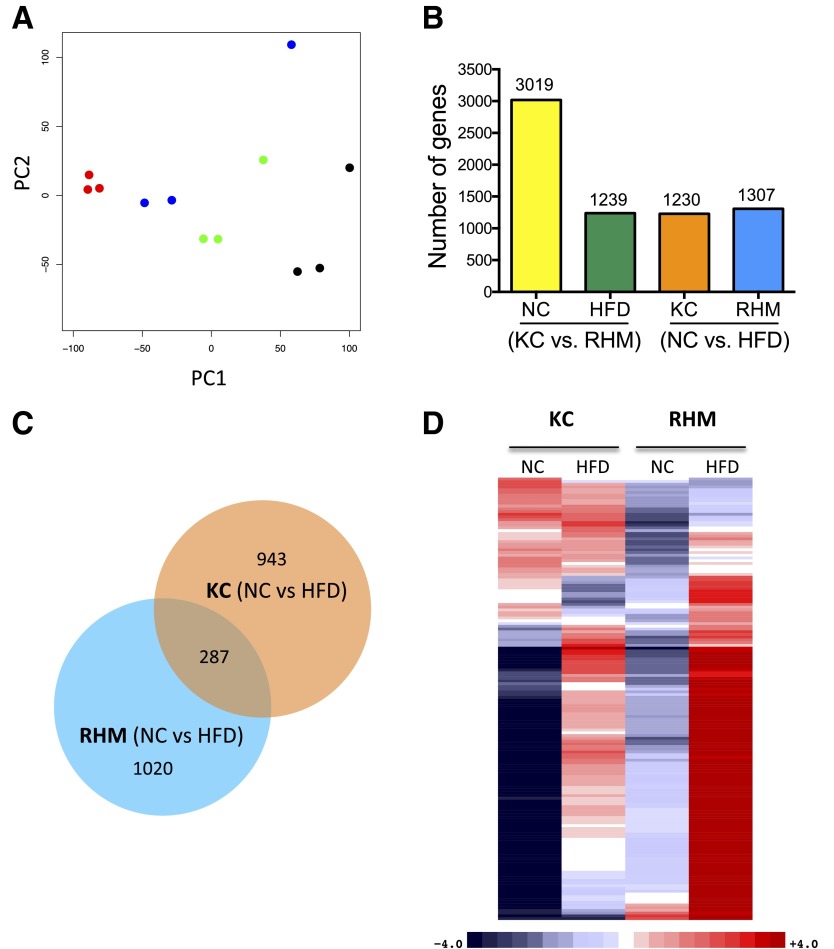
The current dogma is that obesity-associated hepatic inflammation is due to increased Kupffer cell (KC) activation. However, recruited hepatic macrophages (RHMs) were recently shown to represent a sizable liver macrophage population in the context of obesity. Therefore, we assessed whether KCs and RHMs, or both, represent the major liver inflammatory cell type in obesity. We used a combination of in vivo macrophage tracking methodologies and adoptive transfer techniques in which KCs and RHMs are differentially labeled with fluorescent markers. With these approaches, the inflammatory phenotype of these distinct macrophage populations was determined under lean and obese conditions. In vivo macrophage tracking revealed an approximately sixfold higher number of RHMs in obese mice than in lean mice, whereas the number of KCs was comparable. In addition, RHMs comprised smaller size and immature, monocyte-derived cells compared with KCs. Furthermore, RHMs from obese mice were more inflamed and expressed higher levels of tumor necrosis factor-α and interleukin-6 than RHMs from lean mice. A comparison of the MCP-1/C-C chemokine receptor type 2 (CCR2) chemokine system between the two cell types showed that the ligand (MCP-1) is more highly expressed in KCs than in RHMs, whereas CCR2 expression is approximately fivefold greater in RHMs. We conclude that KCs can participate in obesity-induced inflammation by causing the recruitment of RHMs, which are distinct from KCs and are not precursors to KCs. These RHMs then enhance the severity of obesity-induced inflammation and hepatic insulin resistance.


Figures

Figure 1
Figure 1
Isolation and characterization of NPCs from lean and obese mouse liver. A: Schematic diagram of isolation of NPCs from NC-fed lean vs. HFD-fed obese mouse liver. B: FACS analysis of NPCs from lean (NC) and obese (HFD) mouse liver with CD11b and F4/80 gating. NC mouse liver R1 population is labeled in blue, HFD mouse liver R2 population is labeled in green, and R3 population is labeled in red. The scattergram is representative of five to six independent mice from each group. C: Representative histogram plots depict the distribution of values of side (indicating relative granularity, left panel) and forward (indicating relative size, right panel) light scatter obtained from FACS analysis of R2 and R3 population from panel B. D: The relative gene expression from R1, R2, and R3 cell populations obtained from FACS sorting is shown. Data represent mean ± SEM (n = 5–6). *P < 0.05 compared with R2 vs. R3. E: TNF-α, F4/80, and CD11b protein expression in lean and obese mouse liver analyzed by immunohistochemistry. The image is representative of six independent mice from each group. Scale bar indicates 100 μm.
Figure 2
Figure 2
RHM isolation with PKH26 fluorescent labeling. A: Schematic diagram of RHM isolation and characterization with PKH26+ fluorescent-labeled monocytes. B: FACS analyses of PKH26+ cells isolated from lean or obese mouse livers 1, 5, or 16 days after injection with PKH26+-labeled monocytes. Cells were first gated out of total NPCs for PKH26 and then plotted for F4/80+ and CD11b+ fluorescence. F4/80low/CD11b+ (blue-gated) and F4/80high/CD11b+ (red-gated) fraction, similar to the R3 and R2 cells observed in Fig. 1B. The scattergram is representative of four to five independent mice from each group. C: Average number of PKH26+ cells from lean and obese mouse liver was analyzed by FACS and then plotted as fold induction ± SEM from three independent experiments (n = 4 in each group). *P < 0.05 compared with NC vs. HFD. D: FACS analysis of the average number of PKH26+ cells isolated from HFD-fed recipient mice after injection PKH26+-labeled monocytes from WT or CCR2 KO donor mice. Mean ± SEM from three independent experiments (n = 5 in each group). *P < 0.05 compared with WT vs. CCR2 KO. E: TNF-α+ (left) and interleukin-6+ (right) cells were gated out of PKH26+ cells from NPCs of lean and obese mouse liver by FACS and then plotted as the mean ± SEM from three independent experiments (n = 5 in each group). *P < 0.05 compared with NC vs. HFD. F: Western blot analysis of TNF-α protein expression in PKH26+ cells from lean and obese mouse NPCs. PKH26+ cells from lean and obese mouse NPCs were sorted by FACS and then cultured overnight before protein isolation. HSP90 was used as the loading control. The image is representative from three independent Western blots (n = 2 for each group per Western blot).
Figure 3
Figure 3
Identification of KCs in mouse liver. A: Schematic diagram of the irradiation model used to distinguish KC and RHM. i.v., intravenous. B: FITC+ KCs and PKH26+ newly infiltrating macrophages from HFD mice were plotted in forward and side scatter. The scattergram is representative of five independent mice. C: Whole-liver FITC+ KC numbers from mice fed NC were compared with mice after 12 weeks of HFD feeding. Data represent mean ± SEM (n = 5–6). D: MCP-1 and CCR2 mRNA expression were measured from FACS-sorted KCs and RHMs isolated from NC and HFD mice. Data represent mean ± SEM (n = 5). *P < 0.05 compared with KC vs. RHM. E: Hepatic glucose production assay in mouse hepatocytes. Hepatocytes were cultured with conditioned media from FACS-sorted KCs and RHMs from NC (N) and HFD (H) mice. Data represent mean ± SEM (n = 5). *P < 0.05 compared with glucagon and insulin in RPMI.
Figure 4
Figure 4
RNA-seq analysis of KCs and RHMs from NC- and HFD-fed mice. A: Principal component analysis of expressed genes in KCs and RHMs from NC- or HFD-fed mice. Samples representing three biological replicates cluster together (KC-NC, red; KC-HFD, blue; RHM-NC, green; RHM-HFD, black). B: Bar chart shows the number of differentially expressed genes between cell types (KC vs. RHM) and diets (NC vs. HFD). C: Venn diagram shows common and distinct differentially expressed genes induced by the HFD within cell types. D: Heat map shows differentially expressed inflammatory response genes between KCs and RHMs from mice fed NC and the HFD in a four-way comparison. Gene counts were adjusted for cell number as KC increase 1.17-fold on HFD and RHMs increase 5.8-fold. Upregulated genes are colored red, downregulated genes are colored blue, and darker colors reflect higher fold changes. RNA-seq studies used three biological replicates per each group.

References

    1. Olefsky JM, Courtney CH. Type 2 diabetes mellitus: etiology, pathogenesis, and natural history. In Endocrinology. 5th ed. DeGroot LJ, Jameson JL, Eds. Philadelphia, W.B. Saunders and Company, 2005, p. 1093–1117
    1. Glass CK, Olefsky JM. Inflammation and lipid signaling in the etiology of insulin resistance. Cell Metab 2012;15:635–645 - PMC - PubMed
    1. Hotamisligil GS. Inflammation and metabolic disorders. Nature 2006;444:860–867 - PubMed
    1. Curat CA, Wegner V, Sengenès C, et al. . Macrophages in human visceral adipose tissue: increased accumulation in obesity and a source of resistin and visfatin. Diabetologia 2006;49:744–747 - PubMed
    1. Dandona P, Aljada A, Bandyopadhyay A. Inflammation: the link between insulin resistance, obesity and diabetes. Trends Immunol 2004;25:4–7 - PubMed

Publication types

MeSH terms