. 2014 Oct 15;16(5):453.
doi: 10.1186/s13058-014-0453-3.

Anatomical localization of progenitor cells in human breast tissue reveals enrichment of uncommitted cells within immature lobules

Anatomical localization of progenitor cells in human breast tissue reveals enrichment of uncommitted cells within immature lobules

Lisa M Arendt et al. Breast Cancer Res. .

Abstract

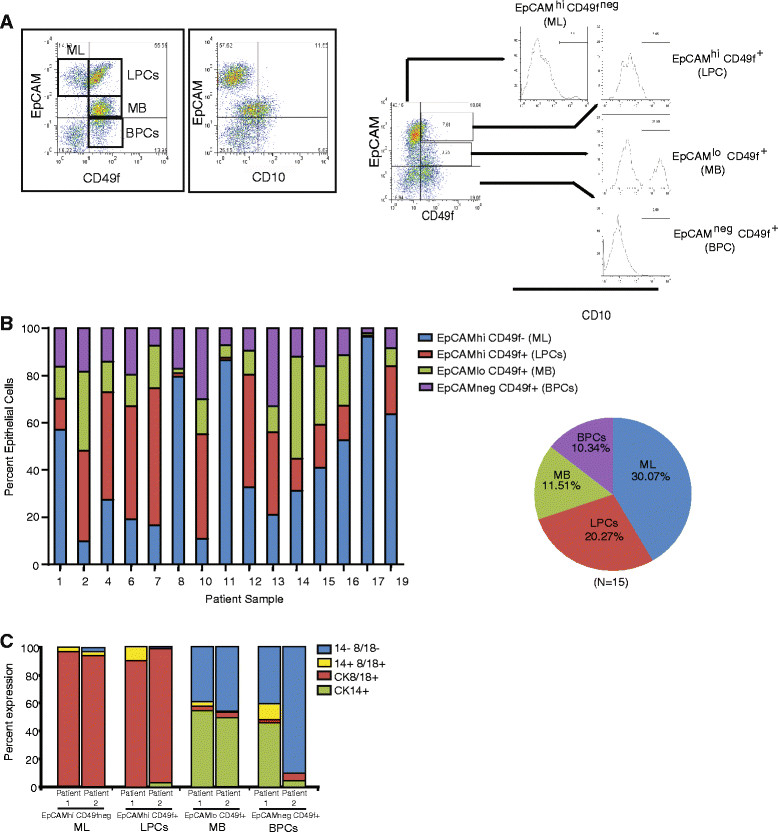
Introduction: Lineage tracing studies in mice have revealed the localization and existence of lineage-restricted mammary epithelial progenitor cells that functionally contribute to expansive growth during puberty and differentiation during pregnancy. However, extensive anatomical differences between mouse and human mammary tissues preclude the direct translation of rodent findings to the human breast. Therefore, here we characterize the mammary progenitor cell hierarchy and identify the anatomic location of progenitor cells within human breast tissues.

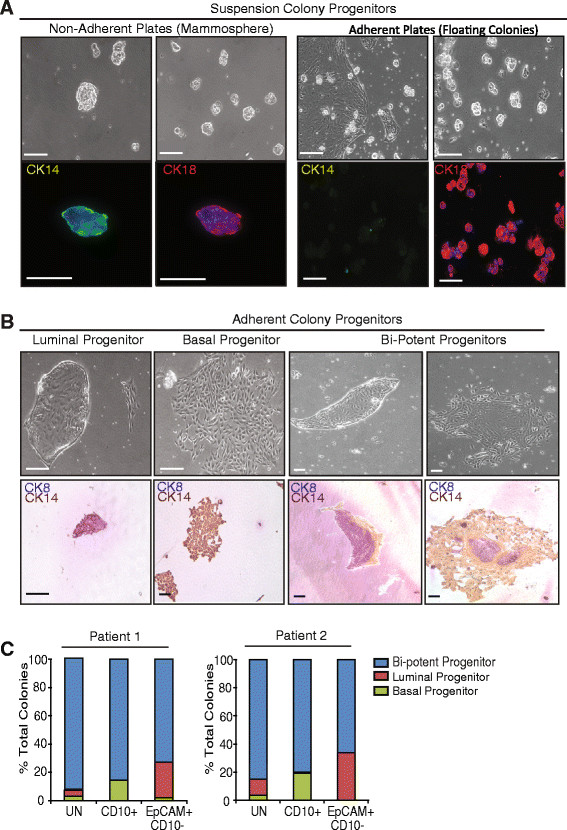
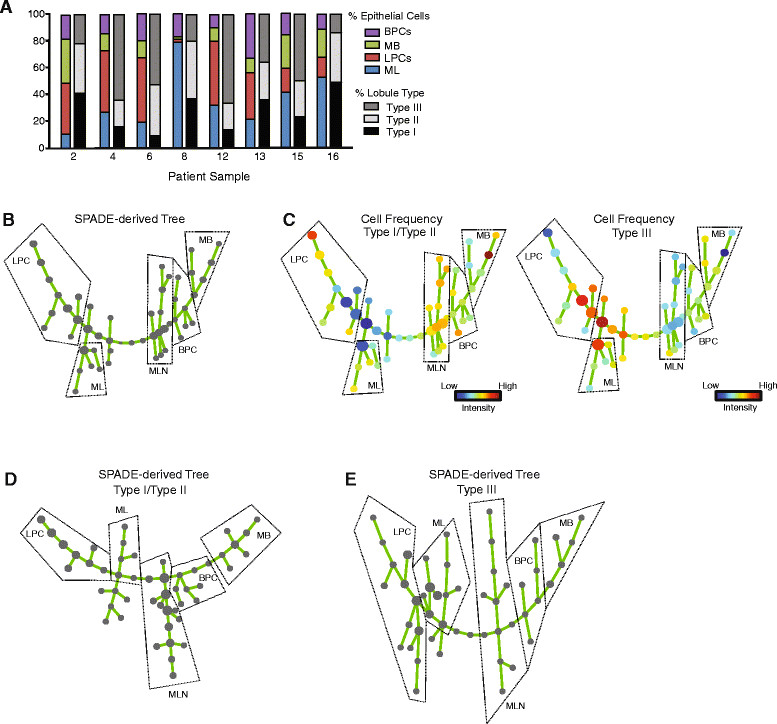
Methods: Mammary epithelial cells (MECs) were isolated from disease-free reduction mammoplasty tissues and assayed for stem/progenitor activity in vitro and in vivo. MECs were sorted and evaluated for growth on collagen and expression of lineages markers. Breast lobules were microdissected and individually characterized based on lineage markers and steroid receptor expression to identify the anatomic location of progenitor cells. Spanning-tree progression analysis of density-normalized events (SPADE) was used to identify the cellular hierarchy of MECs within lobules from high-dimensional cytometry data.

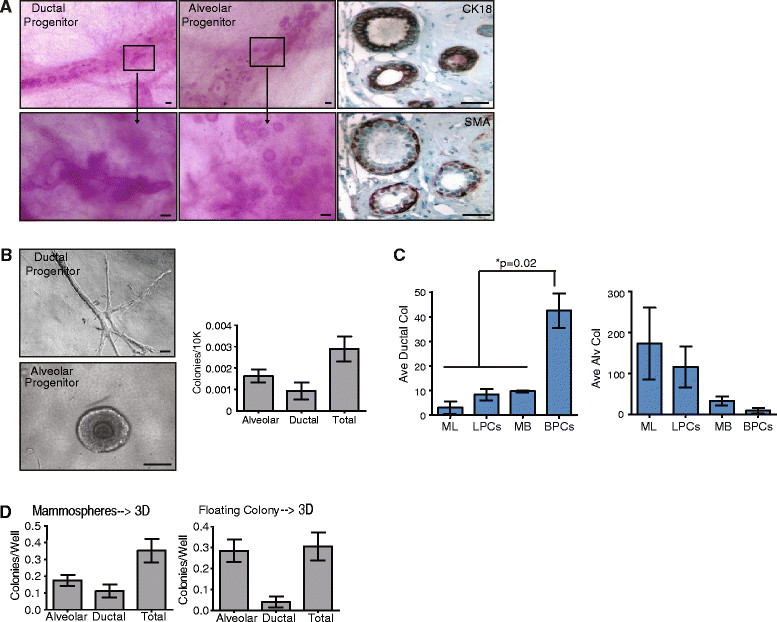
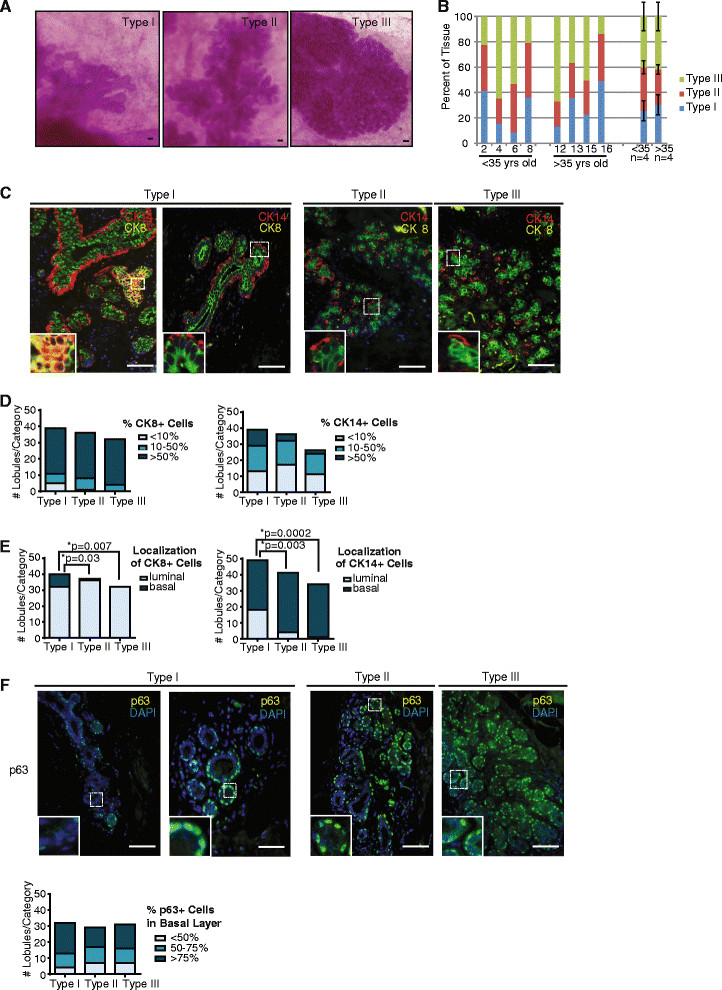
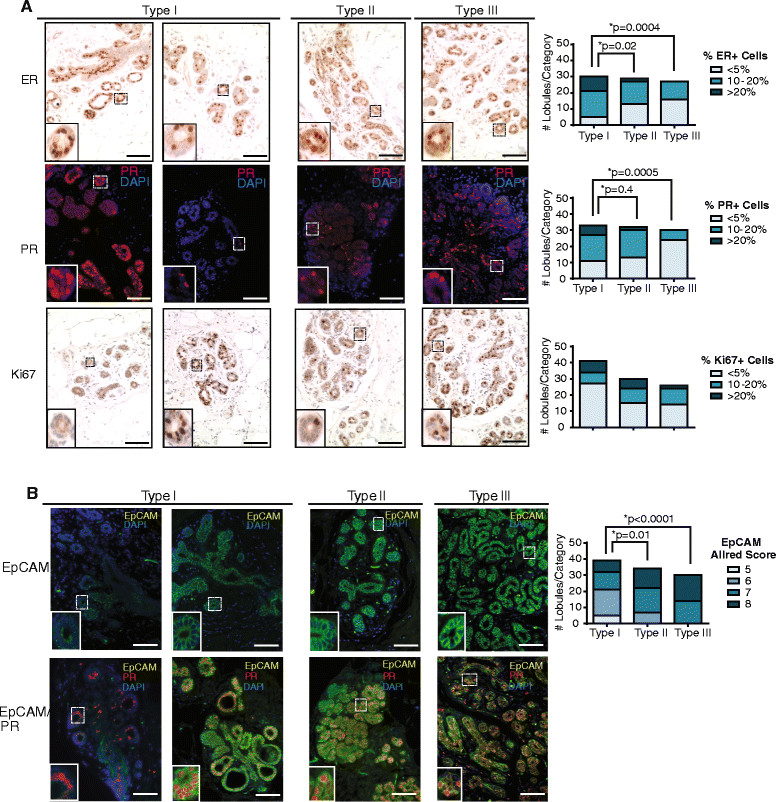
Results: Integrating multiple assays for progenitor activity, we identified the presence of luminal alveolar and basal ductal progenitors. Further, we show that Type I lobules of the human breast were the least mature, demonstrating an unrestricted pattern of expression of luminal and basal lineage markers. Consistent with this, SPADE analysis revealed that immature lobules were enriched for basal progenitor cells, while mature lobules consisted of increased hierarchal complexity of cells within the luminal lineages.

Conclusions: These results reveal underlying differences in the human breast epithelial hierarchy and suggest that with increasing glandular maturity, the epithelial hierarchy also becomes more complex.


Figures

Figure 1
Figure 1
Cell surface markers define cell populations that are variable among patient-derived epithelial cells. (A) Representative flow cytometry plots demonstrating defined epithelial cell populations using the cell surface markers EpCAM, CD10 and CD49f. ML = mature luminal, LPC = luminal progenitor cells, MB = mature basal, and BPC = basal progenitor cells. Epithelial cells were isolated from breast tissue from patients undergoing elective reduction mammoplasty surgery. (B) Percentage of epithelial cells in each cell population for 15 patient samples. (C) Epithelial cells were sorted from primary breast tissue using cell surface markers EpCAM and CD49f and stained for cytokeratin 8 (CK8) and CK14. ML and LPC populations were enriched for CK8+ epithelial cells, and MB and BPC were enriched for CK14+ cells.
Figure 2
Figure 2
Epithelial cell growth in suspension enriched for progenitors in different lineages. (A) Colonies from epithelial cells that grew in suspension in non-adherent culture (mammospheres) expressed both cytokeratin 8 (CK8+; luminal) and CK14 (basal). Colonies that grew in suspension over adherent plates (floating colonies) were CK8+ but were negative for CK14. (B) Epithelial cells formed characteristic colonies on adherent plates that were CK8+, CK14+, or CK8/14+ (bi-potent). (C) When grown on adherent plates, CD10+ cell populations formed bi-potent and basal colonies, while EpCAM+ cell populations formed bi-potent and luminal colonies. Epithelial cells were sorted based on cell surface markers EpCAM and CD10, grown in adherent culture, stained for CK8/14, and colonies were quantified. Scale bar = 100 μm.
Figure 3
Figure 3
Alveolar progenitors are enriched in luminal cell populations, while ductal progenitors are enriched in basal cell populations. (A) In vivo, primary epithelial cells isolated from reduction mammoplasty tissue form bilayered ductal or alveolar structures when grown in the humanized fat pads of NOD/SCID mice. These structures expressed luminal cytokeratin 18 (CK18) and basal smooth muscle actin (SMA). (B) In vitro, primary epithelial cells formed either ductal or alveolar structures when grown on collagen gels (n = 12; mean ± standard error of the mean (SEM)). (C) Ductal progenitor activity was enriched in the basal progenitor cell (BPC) population, while alveolar progenitor activity was enriched in mature luminal (ML) or luminal progenitor cell (LPC) populations. Epithelial cells were sorted using cell surface markers CD10 and EpCAM and grown on collagen gels. Differences were detected using analysis of variance (n = 3; mean ± SD). (D) Growth in suspension as mammospheres enriched for both alveolar and ductal progenitor activity, while growth in suspension as floating colonies over adherent plates enriched for alveolar progenitor activity. Epithelial cells were grown in suspension as floating colonies and mammospheres for 7 days then plated on collagen gels. Ductal and alveolar progenitor activity was quantified (n = 12; mean ± SEM). Scale bar = 100 μm. MB, mature basal.
Figure 4
Figure 4
Type I lobules demonstrated variable cytokeratin 8 (CK8) and CK14 expression. (A, B) Type I, Type II, and Type III lobules were (A) identified and microdissected from reduction mammoplasty tissue, then (B) quantified in each tissue sample (n = 8). (C, D) No significant differences were detected in the percentage of cells expressing CK8 and CK14 among lobule types. Type I-III lobules were stained for CK8 and CK14 and characterized for the percent positive cells in each lobule. The number of individual lobules in each category was quantified for each lobule type (n = 15 lobules/patient). (E) Type I lobules demonstrated significantly increased expression of basal CK8 and luminal CK14 compared to other lobule types. Type I-III lobules were characterized for expression of CK8 and CK14 in the luminal and basal layer, and the number of individual lobules in each category was quantified for each lobule type (n = 15 lobules/patient). Statistical differences were detected by chi squared analysis. (F) p63 was expressed exclusively in the basal layer in all lobules types examined. Type I-III lobules were characterized for the percentage of cells in the basal layer that expressed p63. The number of individual lobules in each category was quantified for each lobule type (n = 15 lobules/patient). Scale bar = 100 μm.
Figure 5
Figure 5
Type I lobules are enriched for basal progenitor cells. (A) Type I lobules demonstrated significantly different patterns of estrogen receptor (ER)α and progesterone receptor (PR) expression compared with other lobule types. Lobules were stained for ERα, PR, and Ki67, and the number of individual lobules in each category was quantified for each lobule type (n = 15 lobules/patient). Statistical differences were detected by chi-squared analysis. (B) Type I lobules demonstrated significantly reduced levels of EpCAM expression compared with other lobule types. Lobules were stained for EpCAM, and scored for cellular expression and intensity using Allred scoring criteria. The number of individual lobules in each category was quantified for each lobule type (n = 15 lobules/patient). Statistical differences detected by chi-squared analysis. Scale bar = 100 μm.
Figure 6
Figure 6
Hierarchal trees reveal differences in the cellular hierarchy of Type I/Type II and Type III lobules. (A) No correlations were found among specific cell populations, lobule type, or patient age. Percentage of epithelial cells in mature luminal (ML), luminal progenitor cell (LPC), mature basal (MB), and basal progenitor cell (BPC) populations assessed by flow cytometry analysis were compared to the percentage of each type of lobule found within the breast tissue for each patient sample (n = 8). (B) Spanning-tree progression analysis of density-normalized events (SPADE) was performed on flow cytometry data for protein markers EpCAM, CD24, and CD49f from eight patient samples with characterized lobule composition. Node size reflects the median number of cells in each population across the heterogeneous population. Dashed lines represent cell populations delineated by cell surface marker profiles. (C) The cell frequencies from breast samples with enrichment for Type I/Type II and Type III lobules were separated and visualized across the SPADE-derived tree. Nodes are colored by the median intensities of cell numbers in each node. Dashed lines represent cell populations delineated by cell surface marker profiles. (D, E) SPADE was performed on flow cytometry data for EpCAM, CD24, and CD49f for breast samples enriched for Type I/Type II (D) and Type III (E) lobules (n = 4 samples each). Dashed lines represent cell populations delineated by cell surface marker profiles. MLN, mammary lineage negative.

References

    1. Stingl J. Detection and analysis of mammary gland stem cells. J Pathol. 2009;217:229–241. doi: 10.1002/path.2457. - DOI - PubMed
    1. Visvader JE. Cells of origin in cancer. Nature. 2011;469:314–322. doi: 10.1038/nature09781. - DOI - PubMed
    1. LaMarca HL, Rosen JM. Minireview: hormones and mammary cell fate-what will I become when I grow up? Endocrinology. 2008;149:4317–4321. doi: 10.1210/en.2008-0450. - DOI - PMC - PubMed
    1. Bruno RD, Smith GH. Role of epithelial stem/progenitor cells in mammary cancer. Gene Expr. 2011;15:133–140. doi: 10.3727/105221611X13176664479368. - DOI - PMC - PubMed
    1. Going JJ, Moffat DF. Escaping from Flatland: clinical and biological aspects of human mammary duct anatomy in three dimensions. J Pathol. 2004;203:538–544. doi: 10.1002/path.1556. - DOI - PubMed

Publication types

LinkOut - more resources