. 2014;19 Suppl 2(0 2):44-60.
doi: 10.1080/10810730.2014.934936.

Predictors of health care system and physician distrust in hospitalized cardiac patients

Collaborators, Affiliations

Predictors of health care system and physician distrust in hospitalized cardiac patients

Charu Gupta et al. J Health Commun. 2014.

Abstract

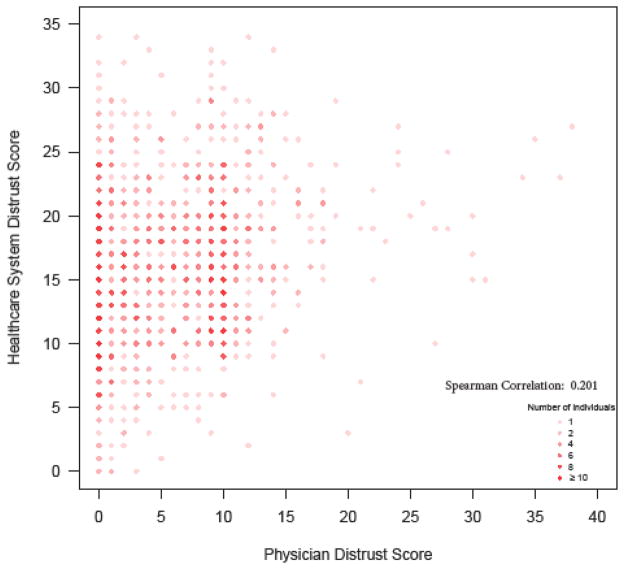
Trusting relationships among patients, physicians, and the health care system is important in encouraging self-care behaviors in cardiovascular patients. This study aimed to assess the prevalence of health care system and physician distrust in this population, compare the 2 forms of distrust, and describe the demographic, socioeconomic, and psychosocial predictors of high distrust. A total of 1,232 hospitalized adults with acute coronary syndrome or heart failure were enrolled in a prospective, observational study assessing health care system distrust and physician distrust. High health care system distrust (35%) was observed across the population, with lower levels of interpersonal physician distrust (16%). In a multivariate analysis, poor social support and coping skills were strong predictors of both health care system (p=.026, p=.003) and physician distrust (p<.001, p=.006). Individuals with low or marginal health literacy had a higher likelihood of physician distrust (p<.001), but no relation was found between health literacy and health care system distrust. In conclusion, distrust is common among acutely ill cardiac patients. Those with low social support and low coping skills are more distrusting of physicians and the health care system.


Figures

Figure 1
Figure 1. Conceptual framework of the Vanderbilt Inpatient Cohort Study [reprinted from (Meyers et al., 2014)]
Figure 2
Figure 2
Scatter plot demonstrating the relation between healthcare system distrust and physician distrust. Darker plots represent density of number of individuals.
Figure 3
Figure 3. Multivariate analysis of continuous variables and Healthcare System Distrust
(A): Forest plot displaying each linear covariate in multivariable analysis (x axis). Odds ratios are shown on the y-axis with a range of 0.25 – 4, and a dark horizontal line at 1. The reference groups for the categorical variables are male, white, married/partner, employed, income <$25K, and diagnosis of ACS*. (B): Graphical display of continuous variables modeled with non-linear effects and odds of healthcare system distrust. The plot shows predictive characteristics along the x-axis (Age, ESSI, s-TOFHLA, Subjective Numeracy Scale, PHQ, Brief Resilient Coping Scale). The y-axis shows increasing odds ratios of physician distrust ranging from 0.25 to 4. A horizontal line is placed at 1. Mean odds ratios are displayed with corresponding 95% confidence interval. *The interquartile unit changes are education: 3 years, MIDUS: 7 points, HRS: 8 points, and BHLS: 4 points. Range was limited to the 1st and 99th percentile.
Figure 4
Figure 4. Multivariate analysis of continuous variables and Physician Distrust
(A): Forest plot displaying each linear covariate in multivariable analysis (x axis). Odds ratios are shown on the y-axis with a range of 0.25 -4, and a dark horizontal line at 1. The reference groups for the categorical variables are male, white, married/partner, employed, income <$25K, and diagnosis of ACS*. (B): Graphical display of continuous variables modeled with non-linear effects and odds of physician distrust. The plot shows predictive characteristics along the x-axis (Age, ESSI, s-TOFHLA, Subjective Numeracy Scale, PHQ, Brief Resilient Coping Scale). The y-axis shows increasing odds ratios of physician distrust ranging from 0.25 to 4. A horizontal line is placed at 1. Mean odds ratios are displayed with corresponding 95% confidence interval. *The interquartile unit changes are education: 3 years, MIDUS: 7 points, HRS: 8 points, and BHLS: 4 points. Range was limited to the 1st and 99th percentile.

References

    1. (CDC), C. f. D. C. a. P. Behavioral Risk Factor Surveillance System Survey Questionnaire. Retrieved from http://www.cdc.gov/brfss/questionnaires.htm.
    1. Anderson LA, Dedrick RF. Development of the Trust in Physician scale: a measure to assess interpersonal trust in patient-physician relationships. Psychol Rep. 1990;67(3 Pt 2):1091–1100. - PubMed
    1. Barber B. The logic and limits of trust. New Brunswick, N.J: Rutgers University Press; 1983.
    1. Bell RA, Arcury TA, Ip E, Grzywacz JG, Nguyen H, Kirk JK, Quandt SA. Correlates of physician trust among rural older adults with diabetes. [Research Support, N.I.H., Extramural] Am J Health Behav. 2013;37(5):660–666. doi: 10.5993/AJHB.37.5.10. - DOI - PMC - PubMed
    1. Bonds DE, Foley KL, Dugan E, Hall MA, Extrom P. An exploration of patients’ trust in physicians in training. J Health Care Poor Underserved. 2004;15(2):294–306. - PubMed

Publication types

LinkOut - more resources