

Mutation of the inducible ARABIDOPSIS THALIANA CYTOCHROME P450 REDUCTASE2 alters lignin composition and improves saccharification
- PMID: 25315601
- PMCID: PMC4256863
- DOI: 10.1104/pp.114.245548
Mutation of the inducible ARABIDOPSIS THALIANA CYTOCHROME P450 REDUCTASE2 alters lignin composition and improves saccharification
Abstract
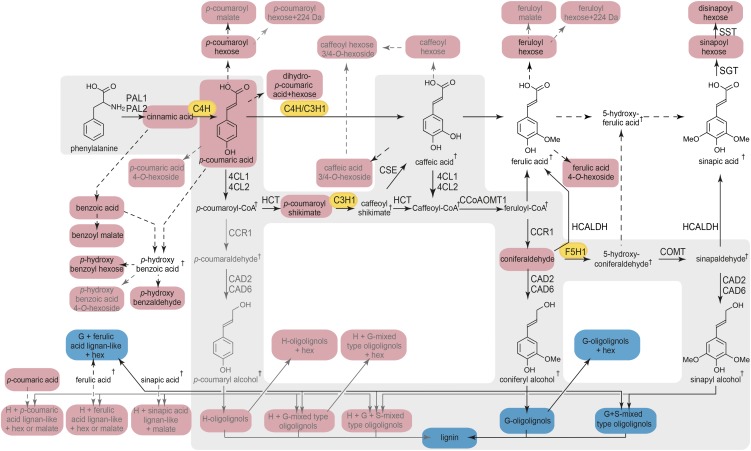
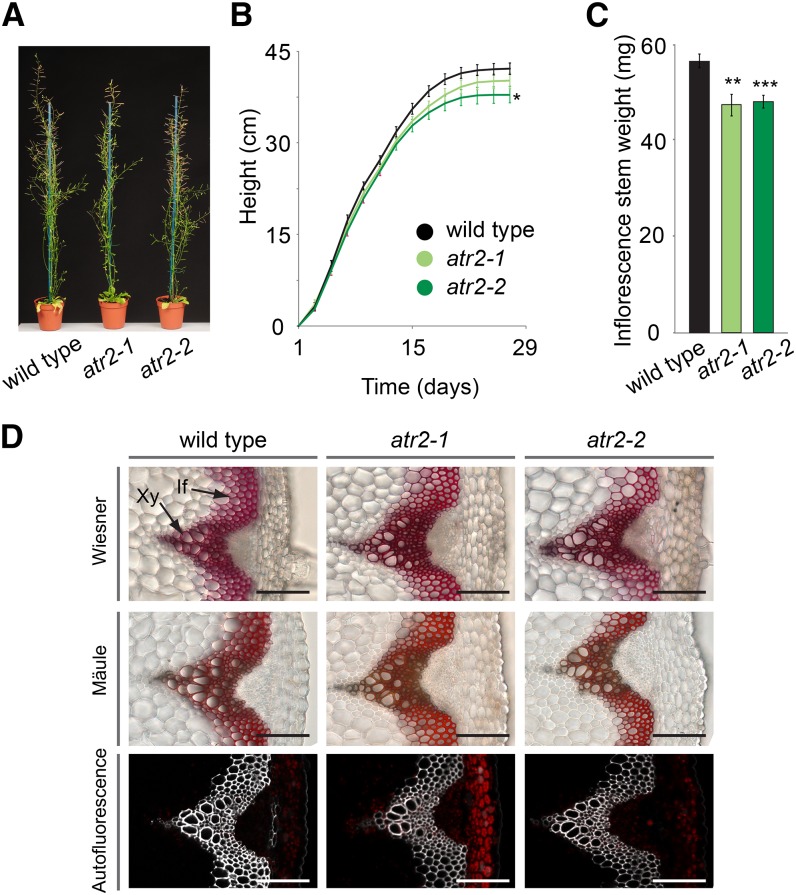
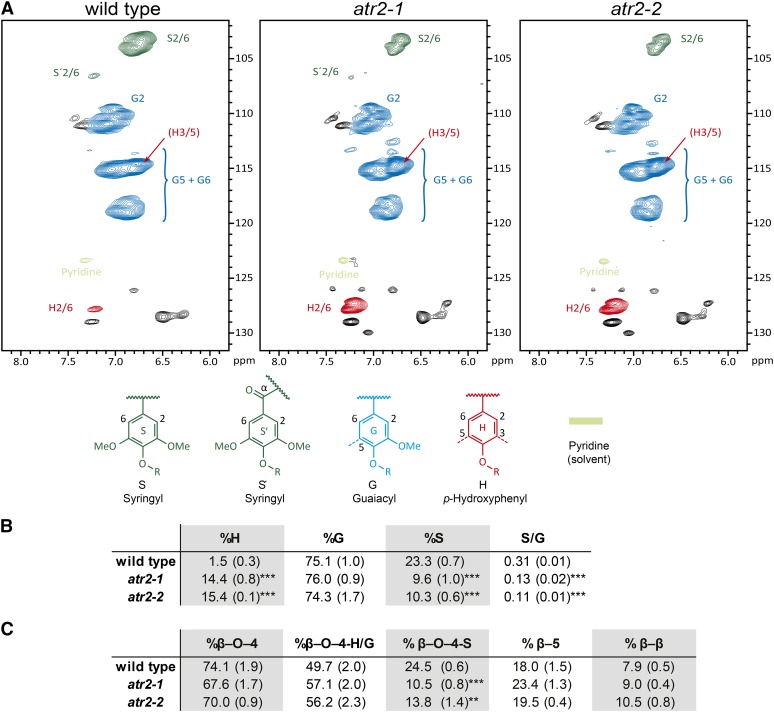
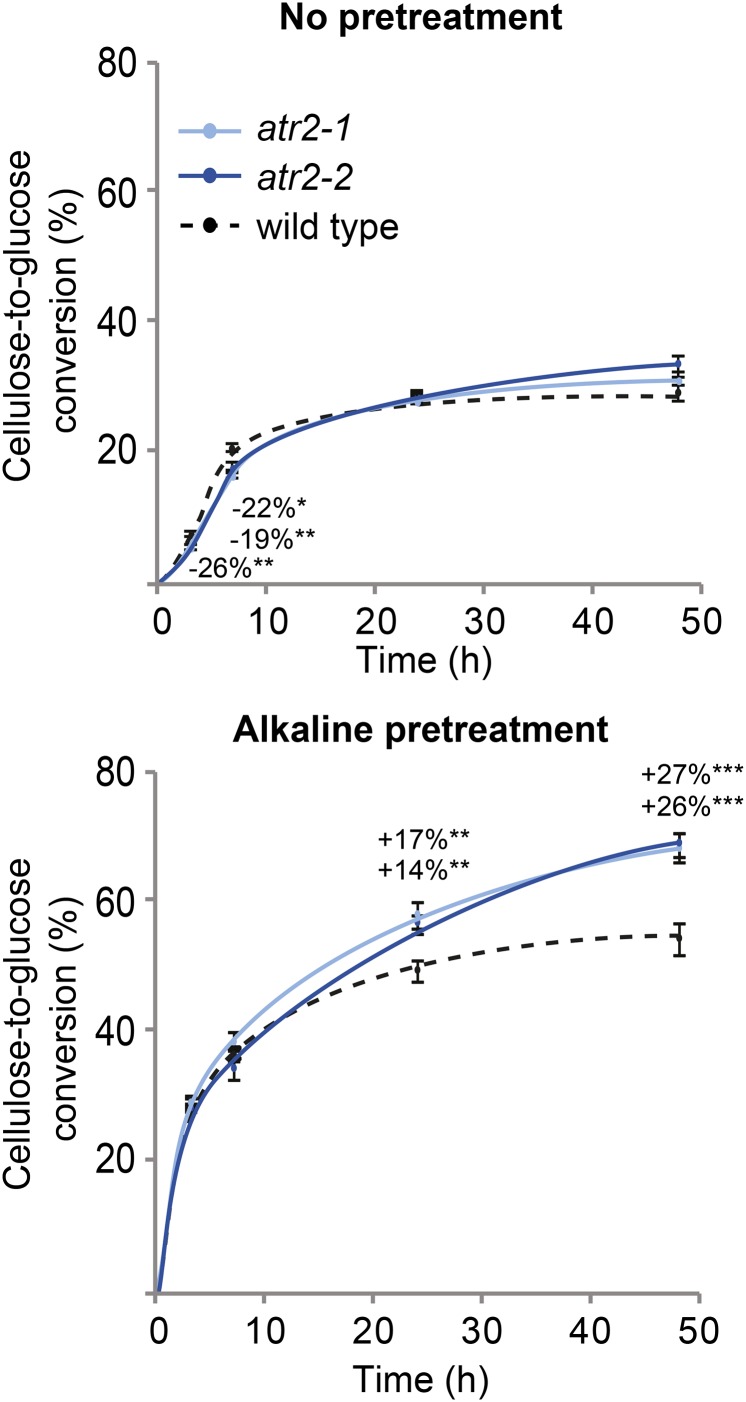
ARABIDOPSIS THALIANA CYTOCHROME P450 REDUCTASE1 (ATR1) and ATR2 provide electrons from NADPH to a large number of CYTOCHROME P450 (CYP450) enzymes in Arabidopsis (Arabidopsis thaliana). Whereas ATR1 is constitutively expressed, the expression of ATR2 appears to be induced during lignin biosynthesis and upon stresses. Therefore, ATR2 was hypothesized to be preferentially involved in providing electrons to the three CYP450s involved in lignin biosynthesis: CINNAMATE 4-HYDROXYLASE (C4H), p-COUMARATE 3-HYDROXYLASE1 (C3H1), and FERULATE 5-HYDROXYLASE1 (F5H1). Here, we show that the atr2 mutation resulted in a 6% reduction in total lignin amount in the main inflorescence stem and a compositional shift of the remaining lignin to a 10-fold higher fraction of p-hydroxyphenyl units at the expense of syringyl units. Phenolic profiling revealed shifts in lignin-related phenolic metabolites, in particular with the substrates of C4H, C3H1 and F5H1 accumulating in atr2 mutants. Glucosinolate and flavonol glycoside biosynthesis, both of which also rely on CYP450 activities, appeared less affected. The cellulose in the atr2 inflorescence stems was more susceptible to enzymatic hydrolysis after alkaline pretreatment, making ATR2 a potential target for engineering plant cell walls for biofuel production.
© 2014 American Society of Plant Biologists. All Rights Reserved.
Figures
Similar articles
-
A systems biology view of responses to lignin biosynthesis perturbations in Arabidopsis.Plant Cell. 2012 Sep;24(9):3506-29. doi: 10.1105/tpc.112.102574. Epub 2012 Sep 25. Plant Cell. 2012. PMID: 23012438 Free PMC article.
-
Engineering traditional monolignols out of lignin by concomitant up-regulation of F5H1 and down-regulation of COMT in Arabidopsis.Plant J. 2010 Dec;64(6):885-97. doi: 10.1111/j.1365-313X.2010.04353.x. Epub 2010 Oct 15. Plant J. 2010. PMID: 20822504
-
Structure of the Arabidopsis thaliana NADPH-cytochrome P450 reductase 2 (ATR2) provides insight into its function.FEBS J. 2017 Mar;284(5):754-765. doi: 10.1111/febs.14017. Epub 2017 Feb 8. FEBS J. 2017. PMID: 28103421
-
The Arabidopsis wood model-the case for the inflorescence stem.Plant Sci. 2013 Sep;210:193-205. doi: 10.1016/j.plantsci.2013.05.007. Epub 2013 May 21. Plant Sci. 2013. PMID: 23849126 Review.
-
Regulation of plant secondary metabolism and associated specialized cell development by MYBs and bHLHs.Phytochemistry. 2016 Nov;131:26-43. doi: 10.1016/j.phytochem.2016.08.006. Epub 2016 Aug 26. Phytochemistry. 2016. PMID: 27569707 Free PMC article. Review.
Cited by
-
Cytochrome b 5: A versatile electron carrier and regulator for plant metabolism.Front Plant Sci. 2022 Sep 23;13:984174. doi: 10.3389/fpls.2022.984174. eCollection 2022. Front Plant Sci. 2022. PMID: 36212330 Free PMC article. Review.
-
The cell biology of lignification in higher plants.Ann Bot. 2015 Jun;115(7):1053-74. doi: 10.1093/aob/mcv046. Epub 2015 Apr 15. Ann Bot. 2015. PMID: 25878140 Free PMC article. Review.
-
Unraveling the Role of P450 Reductase in Herbicide Metabolic Resistance Mechanism.Plant Direct. 2025 Aug 14;9(8):e70102. doi: 10.1002/pld3.70102. eCollection 2025 Aug. Plant Direct. 2025. PMID: 40823267 Free PMC article.
-
Cellular and Genetic Regulation of Coniferaldehyde Incorporation in Lignin of Herbaceous and Woody Plants by Quantitative Wiesner Staining.Front Plant Sci. 2020 Mar 2;11:109. doi: 10.3389/fpls.2020.00109. eCollection 2020. Front Plant Sci. 2020. PMID: 32194582 Free PMC article.
-
Polyploidy Affects Plant Growth and Alters Cell Wall Composition.Plant Physiol. 2019 Jan;179(1):74-87. doi: 10.1104/pp.18.00967. Epub 2018 Oct 9. Plant Physiol. 2019. PMID: 30301776 Free PMC article.
References
-
- Abdulrazzak N, Pollet B, Ehlting J, Larsen K, Asnaghi C, Ronseau S, Proux C, Erhardt M, Seltzer V, Renou JP, et al. (2006) A coumaroyl-ester-3-hydroxylase insertion mutant reveals the existence of nonredundant meta-hydroxylation pathways and essential roles for phenolic precursors in cell expansion and plant growth. Plant Physiol 140: 30–48 - PMC - PubMed
-
- Alonso JM, Stepanova AN, Leisse TJ, Kim CJ, Chen H, Shinn P, Stevenson DK, Zimmerman J, Barajas P, Cheuk R, et al. (2003) Genome-wide insertional mutagenesis of Arabidopsis thaliana. Science 301: 653–657 - PubMed
-
- Alvira P, Tomás-Pejó E, Ballesteros M, Negro MJ (2010) Pretreatment technologies for an efficient bioethanol production process based on enzymatic hydrolysis: a review. Bioresour Technol 101: 4851–4861 - PubMed
Publication types
MeSH terms
Substances
LinkOut - more resources
Full Text Sources
Other Literature Sources
Molecular Biology Databases
