. 2015 Jan:73:204-12.
doi: 10.1016/j.nbd.2014.10.002. Epub 2014 Oct 12.

PARK2 patient neuroprogenitors show increased mitochondrial sensitivity to copper

Affiliations

PARK2 patient neuroprogenitors show increased mitochondrial sensitivity to copper

Asad A Aboud et al. Neurobiol Dis. 2015 Jan.

Abstract

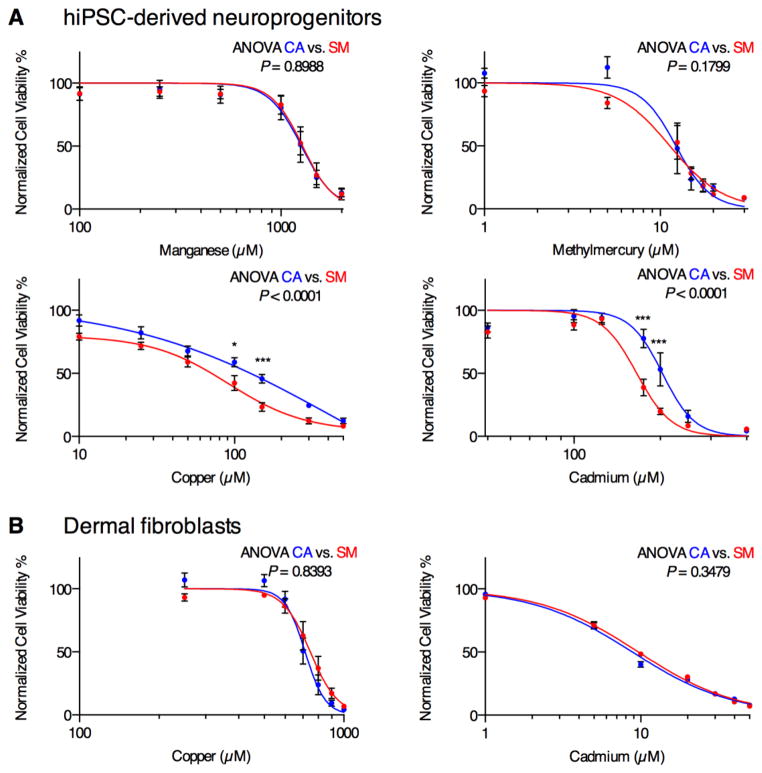
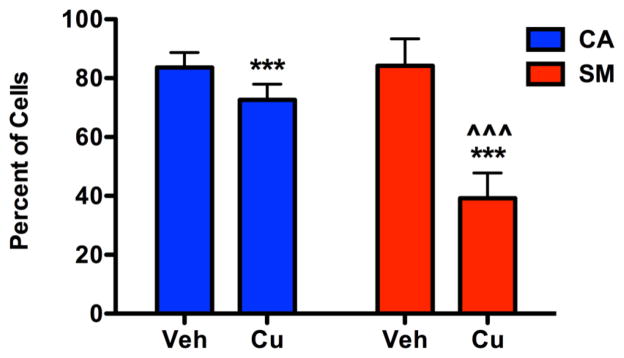
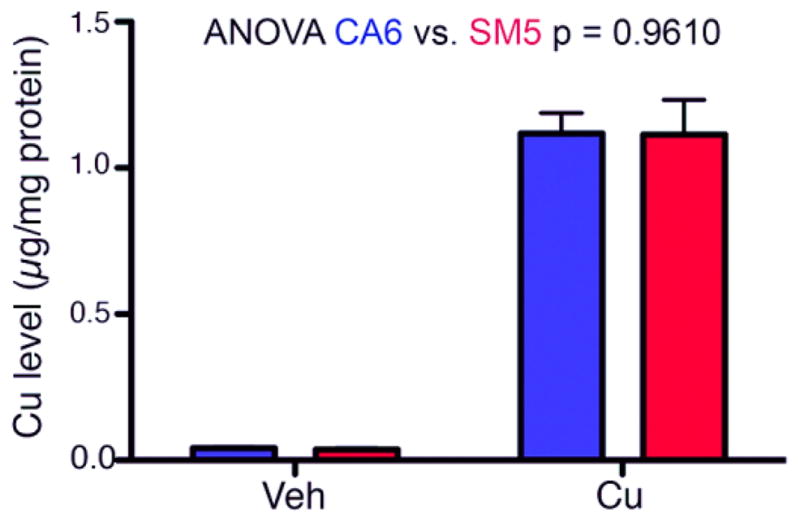
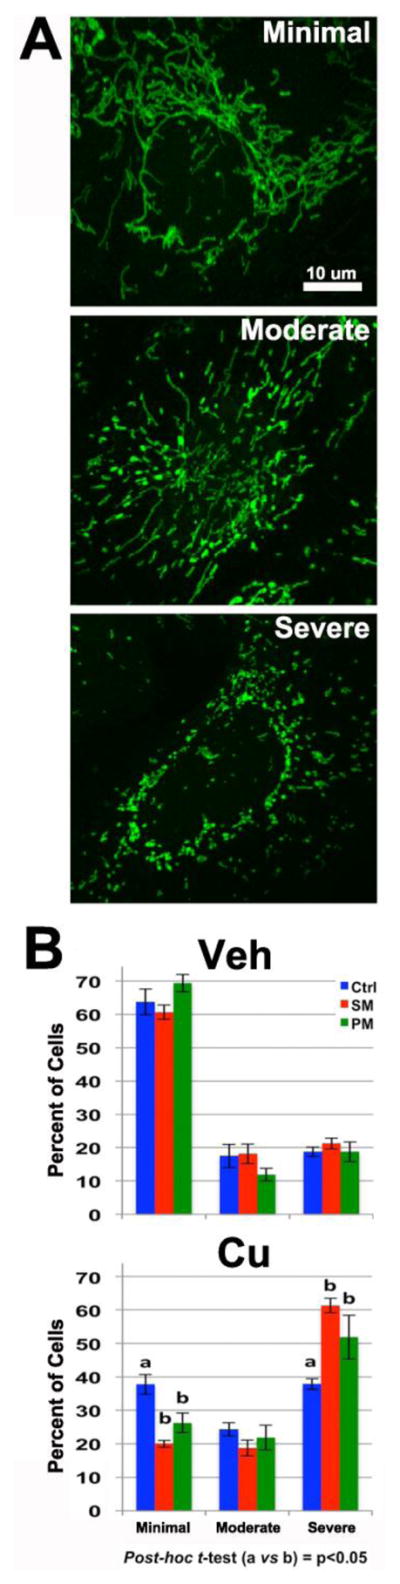
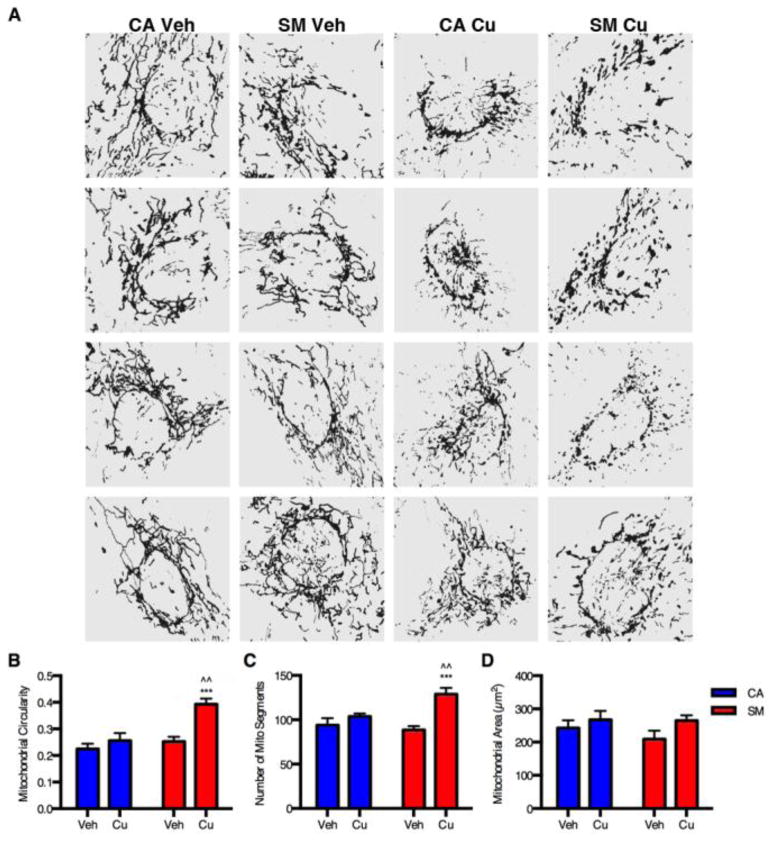
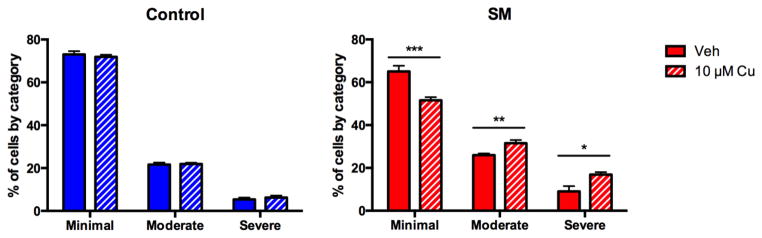
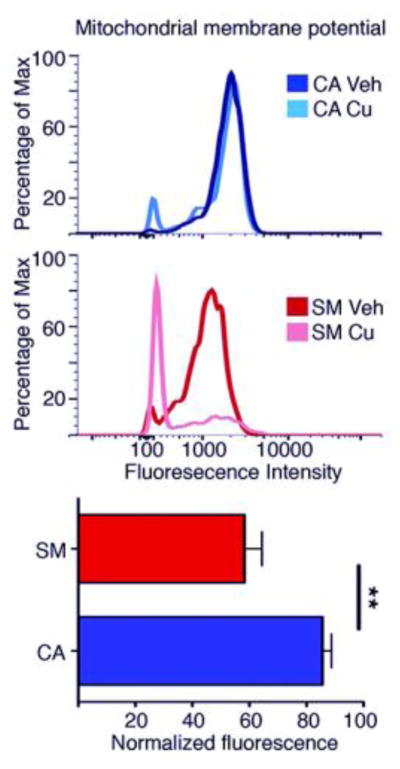
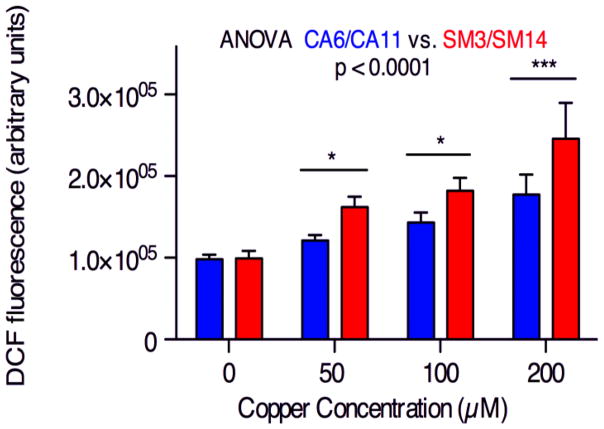
Poorly-defined interactions between environmental and genetic risk factors underlie Parkinson's disease (PD) etiology. Here we tested the hypothesis that human stem cell derived forebrain neuroprogenitors from patients with known familial risk for early onset PD will exhibit enhanced sensitivity to PD environmental risk factors compared to healthy control subjects without a family history of PD. Two male siblings (SM and PM) with biallelic loss-of-function mutations in PARK2 were identified. Human induced pluripotent stem cells (hiPSCs) from SM, PM, and four control subjects with no known family histories of PD or related neurodegenerative diseases were utilized. We tested the hypothesis that hiPSC-derived neuroprogenitors from patients with PARK2 mutations would show heightened cell death, mitochondrial dysfunction, and reactive oxygen species generation compared to control cells as a result of exposure to heavy metals (PD environmental risk factors). We report that PARK2 mutant neuroprogenitors showed increased cytotoxicity with copper (Cu) and cadmium (Cd) exposure but not manganese (Mn) or methyl mercury (MeHg) relative to control neuroprogenitors. PARK2 mutant neuroprogenitors also showed a substantial increase in mitochondrial fragmentation, initial ROS generation, and loss of mitochondrial membrane potential following Cu exposure. Our data substantiate Cu exposure as an environmental risk factor for PD. Furthermore, we report a shift in the lowest observable effect level (LOEL) for greater sensitivity to Cu-dependent mitochondrial dysfunction in patients SM and PM relative to controls, correlating with their increased genetic risk for PD.

Keywords: Copper; Environmental risk factors; Neurotoxicty; PARK2; Parkinson's disease.


Figures

Figure 1
Figure 1. SM neuroprogenitors but not fibroblasts show increased sensitivity to Cd and Cu toxicity
(A) Neuroprogenitor survival curves measured by MTT assay after 48 hr exposure to Mn, MeHg, Cu, and Cd (CA: CA4, CA6 at N = 6 or 8; SM: SM3, SM4, SM5 at N = 7 or 8). Error bars represent ± SEM. (B) The primary dermal fibroblast lines were exposed to Cd or Cu, and cell viability was measured by MTT assay (Cu: CA, n = 7; SM, n = 7; Cd: CA, n = 3; SM, n = 3). Statistical analysis for genotype effects was performed by two-way repeated measures ANOVA. Pairwise post-hoc analysis with Bonferroni correction is indicated between CA and SM hiPSC lines as * p < 0.05, *** p < 0.001. Error bars represent ± SEM
Figure 2
Figure 2. SM neuroprogenitors show a stronger reduction in the non-apoptotic cell population following Cu exposure
Gating for non-apoptotic cells were performed based on the forward and side scatter properties of the vehicle-exposed control group in each independent experiment as shown in Figure S4. Percentage of non-apoptotic cells is plotted. Apoptotic cells have decreased forward scatter properties due to cell shrinkage. Data collected across 5 independent paired experiments (CA6:SM4 n=2, CA6:SM5 n=2, CA11:SM14 n=1, total n=5). Statistical analysis was performed by two-way ANOVA and paired two-tailed t-test for post-hoc analysis (*** or ^^^ indicates p < 0.001, absence of a symbol indicates no significant difference p > 0.05). * indicates a significant difference within genotype between exposures, and ^ indicates a significant difference between genotypes with the same exposure. Error bars represent + SEM.
Figure 3
Figure 3. Total Cu accumulation is not different between SM and CA neuroprogenitors
CA (CA6) and SM (SM5) neuroprogenitors were treated with either vehicle (Veh) or 50 μM Cu (Cu) for 24 hrs, and total cellular Cu levels were assessed by GFAAS (Vehicle n=3; Cu n=5). Two-way ANOVA was used for statistical analysis. Error bars represent + SEM.
Figure 4
Figure 4. Enhanced Cu-dependent mitochondrial fragmentation in SM/PM neuroprogenitors
Forty individual Pax6+ neuroprogenitors were scored into three severity classes of mitochondrial fragmentation (minimal, moderate and severe) for each independent sample, and the percentage of cells in each severity category was determined. (A) Representative images of mild, moderate, and severe categories of mitochondrial fragmentation for semi-quantitative analysis. (B) Quantification of mitochondrial fragmentation in control (CA11, CE6, CF1), SM (SM3, SM14) and PM (PM12 and PM17) neuroprogenitors after a 24 hr exposure to vehicle or 100 μM Cu. Two independent experiments were performed with each line for a total of n=6 control experiments; n=8 SM/PM experiments (n=4 SM; n=4 PM). Analysis was performed using repeated measures ANOVA (across the three severity categories) and post-hoc t-test (columns are labeled with ‘a’ or ‘b’ to designate significant differences, p < 0.05). Error bars represent ± SEM.
Figure 5
Figure 5. Quantitative mitochondrial analysis of Cu-exposed neuroprogenitors
Quantitative analysis of mitochondrial morphology was performed using the ImageJ Mito-Morphology macro. Randomly selected Pax6+ neuroprogenitors were imaged by an observer blinded to genotype or exposure condition from two independent experiments (5 images from each, total n=10) for both vehicle and Cu exposed CA6 and SM3 neuroprogenitors. (A) Four representative, binary image masks from each treatment category are shown for visual comparison. Quantitative measures were assessed by the macro including (B) mitochondrial circularity, (C) total number of mitochondrial segments/particles, and (D) total mitochondrial surface area of the binary image masks. Statistical analysis was performed by two-way ANOVA and two-tailed t-test for post-hoc analysis (*** or ^^^ indicates p < 0.001; ^^ indicates p < 0.01). * symbol indicates significant difference as compared to the vehicle-treated group of the same genotype, and ^ symbol represents significant difference compared to Cu-exposed group of the other genotype. Error bars represent + SEM.
Figure 6
Figure 6. Decreased Cu-dependent LOEL for mitochondrial fragmentation in SM neuroprogenitors
Eight independent experiments were performed with pairs of control versus SM neuroprogenitors (CA6:SM3 n=2, CA6: SM4 n=2, CA6:SM5 n=2, CB5:SM5 n=2, total n=8) exposed to vehicle or 10 μM Cu. Mitochondrial fragmentation was scored blind into three severity categories (minimal, moderate, or severe) for 40 PAX6+ neuroprogenitors for each sample. For concentration comparisons * for p < 0.05, ** p < 0.01, *** p < 0.001 by t-test. Error bars represent + SEM.
Figure 7
Figure 7. Decreased mitochondrial membrane potential by Cu-exposure is more severe in SM neuroprogenitors than control
(Upper two panels) Representative flow cytometry experiment using DiIC1(5) fluorescence as an indicator of mitochondrial membrane potential after a 24 hr exposure to 50 μM Cu in CA6 and SM5. (Lower graph) Mean normalized fluorescence intensity of Cu-exposed neuroprogenitors. Data represent single live cell events assessed by flow cytometry across 5 independent paired experiments (CA6:SM4 n=2, CA6:SM5 n=2, CA11:SM14 n=1, total n=5). Statistical analysis was performed by a paired two-tailed t-test (p = 0.011). Error bars represent + SEM.
Figure 8
Figure 8. SM neuroprogenitors have greater ROS production in the presence of Cu
ROS generation in neuroprogenitors was measured using a DCF-dye based assay after a 30 minute exposure to Cu. Paired CA/SM experiments were performed (CA6:SM3 n=2, CA6:SM14 n=3, CA11:SM3 n=2, total n=7). Statistical analysis for genotype effects was by two-way repeated measures ANOVA. Pairwise post-hoc analysis with Bonferroni correction is indicated between CA and SM hiPSC lines as * p < 0.05, *** p < 0.001. Error bars represent + SEM.

References

    1. Abbas N, et al. A wide variety of mutations in the parkin gene are responsible for autosomal recessive parkinsonism in Europe. French Parkinson’s Disease Genetics Study Group and the European Consortium on Genetic Susceptibility in Parkinson’s Disease. Hum Mol Genet. 1999;8:567–74. - PubMed
    1. Aboud AA, et al. Genetic risk for Parkinson’s disease correlates with alterations in neuronal manganese sensitivity between two human subjects. NeuroToxicology. 2012;33:1443–9. - PMC - PubMed
    1. Betarbet R, et al. Chronic systemic pesticide exposure reproduces features of Parkinson’s disease. Nat Neurosci. 2000;3:1301–6. - PubMed
    1. Boll M-C, et al. Free copper, ferroxidase and SOD1 activities, lipid peroxidation and NO(x) content in the CSF. A different marker profile in four neurodegenerative diseases. Neurochem Res. 2008;33:1717–23. - PubMed
    1. Buzanska L, et al. A human stem cell-based model for identifying adverse effects of organic and inorganic chemicals on the developing nervous system. Stem Cells. 2009;27:2591–601. - PubMed

Publication types