. 2014 Dec 1;127(Pt 23):5066-78.
doi: 10.1242/jcs.158840. Epub 2014 Oct 14.

Phosphorylation of threonine 3 on histone H3 by haspin kinase is required for meiosis I in mouse oocytes

Affiliations

Phosphorylation of threonine 3 on histone H3 by haspin kinase is required for meiosis I in mouse oocytes

Alexandra L Nguyen et al. J Cell Sci. .

Abstract

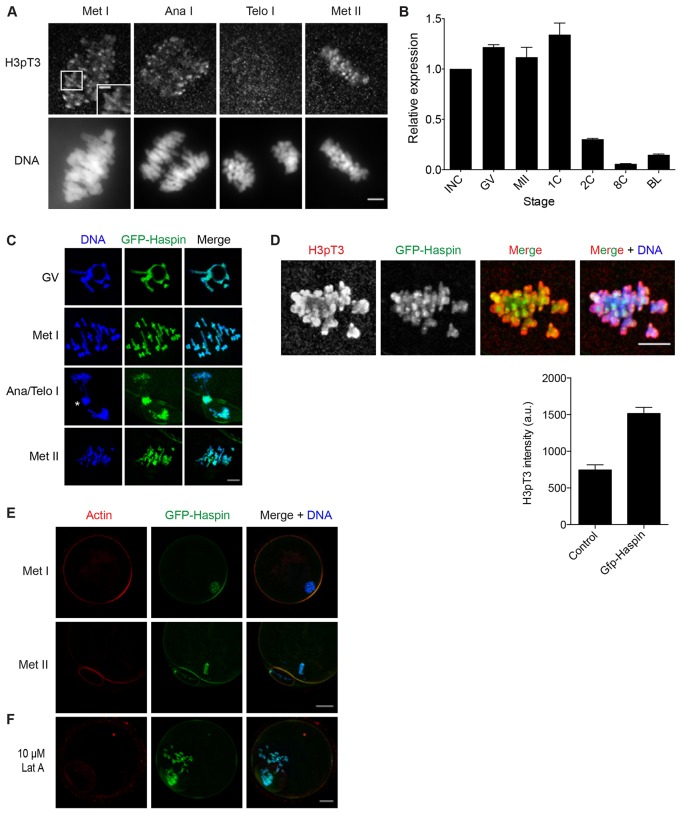
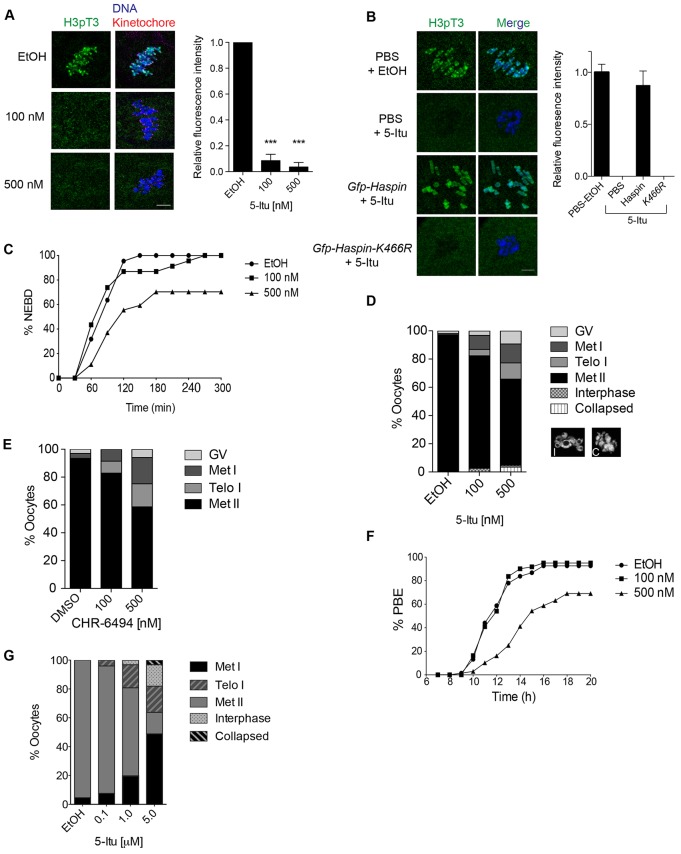
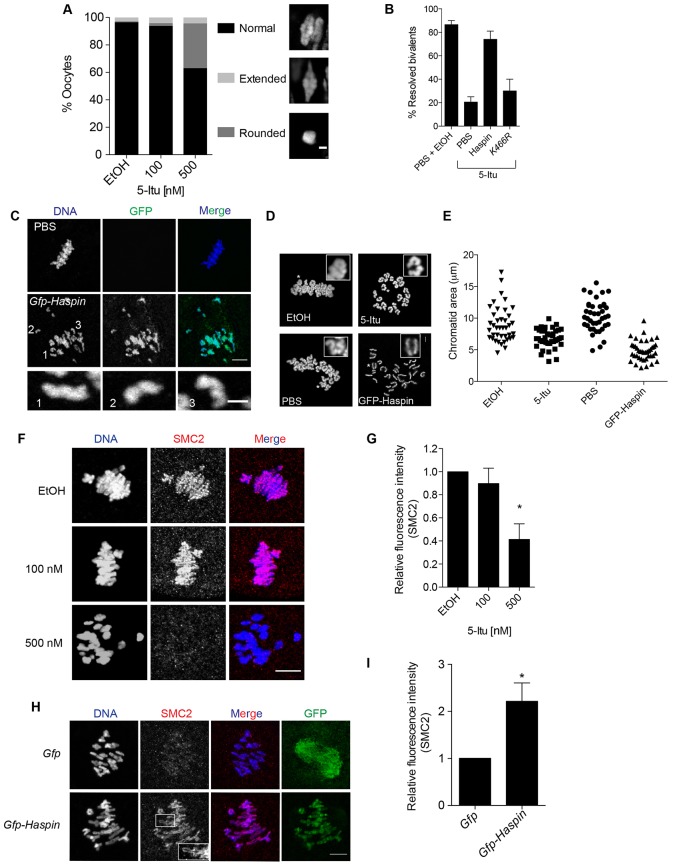
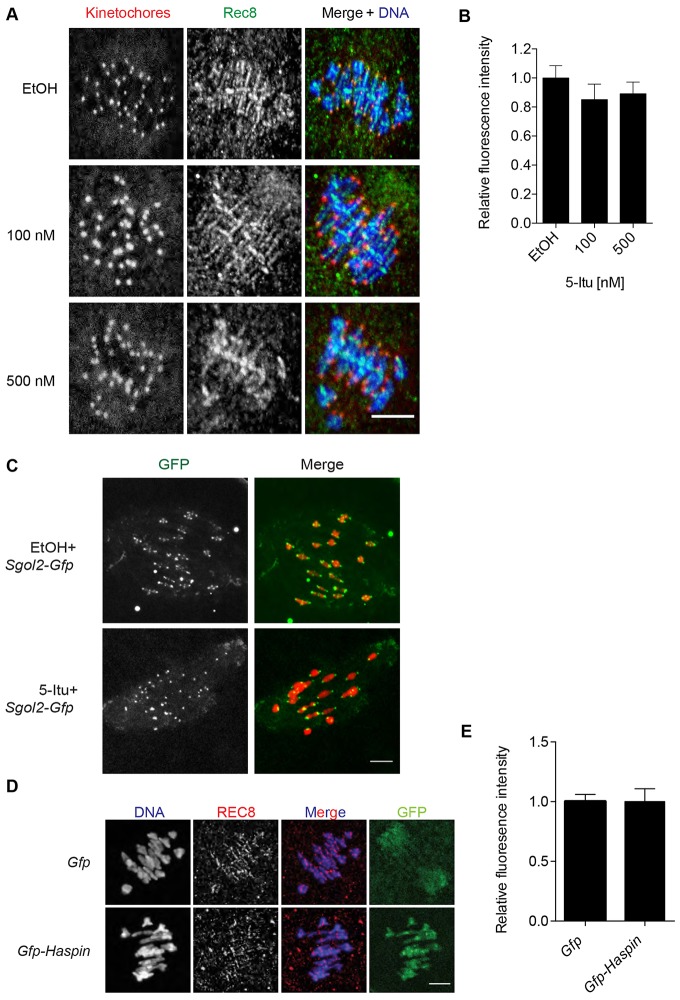
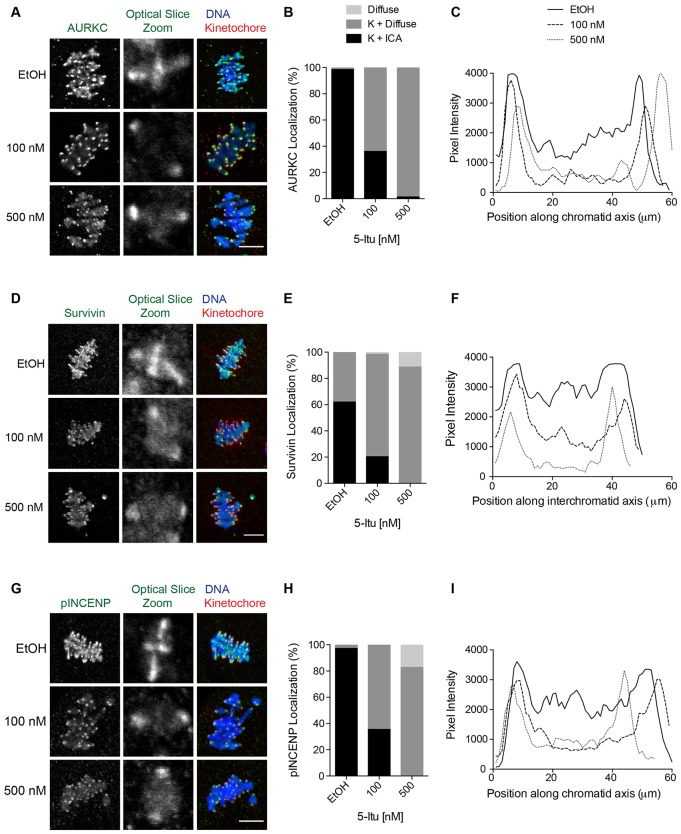
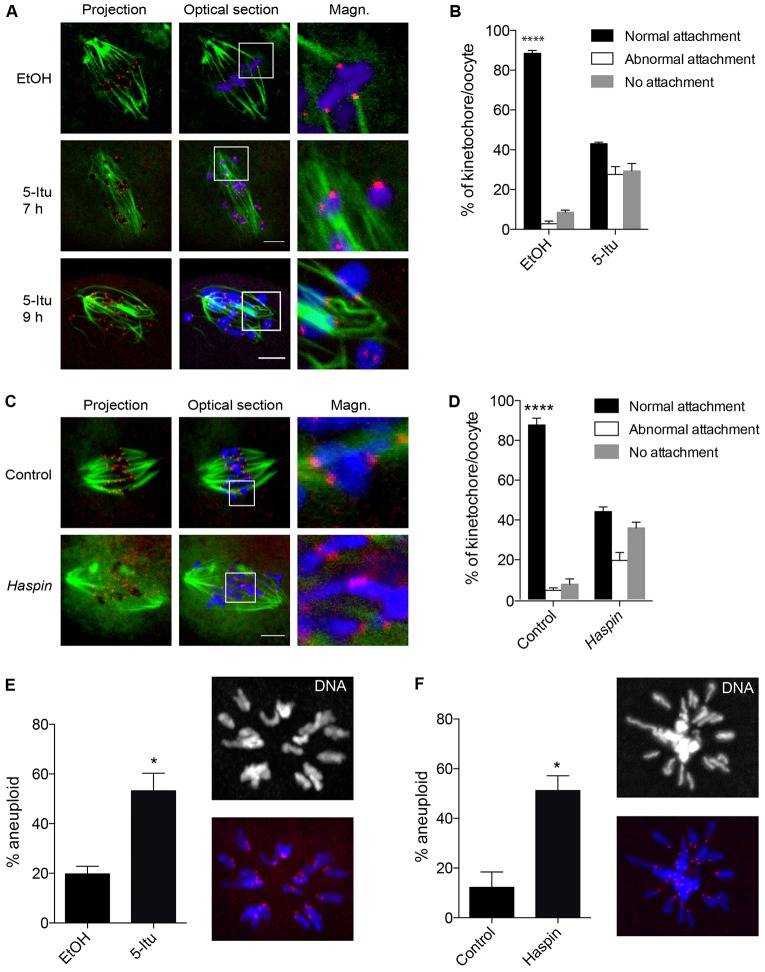
Meiosis I (MI), the division that generates haploids, is prone to errors that lead to aneuploidy in females. Haspin is a kinase that phosphorylates histone H3 on threonine 3, thereby recruiting Aurora kinase B (AURKB) and the chromosomal passenger complex (CPC) to kinetochores to regulate mitosis. Haspin and AURKC, an AURKB homolog, are enriched in germ cells, yet their significance in regulating MI is not fully understood. Using inhibitors and overexpression approaches, we show a role for haspin during MI in mouse oocytes. Haspin-perturbed oocytes display abnormalities in chromosome morphology and alignment, improper kinetochore-microtubule attachments at metaphase I and aneuploidy at metaphase II. Unlike in mitosis, kinetochore localization remained intact, whereas the distribution of the CPC along chromosomes was absent. The meiotic defects following haspin inhibition were similar to those observed in oocytes where AURKC was inhibited, suggesting that the correction of microtubule attachments during MI requires AURKC along chromosome arms rather than at kinetochores. Our data implicate haspin as a regulator of the CPC and chromosome segregation during MI, while highlighting important differences in how chromosome segregation is regulated between MI and mitosis.

Keywords: Aurora kinase; Haspin kinase; Histone phosphorylation; Meiosis I; Meiotic maturation; Oocyte.


Figures

Fig. 1.
Fig. 1.
Mouse oocytes contain active haspin protein kinase. (A) Germinal-vesicle-intact oocytes were isolated and matured in vitro to the indicated stages prior to fixation and detection of phosphorylated threonine 3 on histone 3 (H3pT3) and DNA. Shown are optical slices obtained by confocal microscopy from a representative experiment. The experiment was repeated three times with ≥15 oocytes per stage. (B) Relative mRNA levels of haspin in oocytes and preimplantation embryos. Expression levels were determined by quantitative RT-PCR and were normalized against exogenous Gfp. Data are shown as the mean±s.e.m. (three independent experiments). (C–F) Germinal-vesicle-intact oocytes were isolated, microinjected with Gfp-haspin cRNA and matured in vitro to the indicated stages prior to fixation and processing to detect GFP–haspin (green), DNA (blue), H3pT3 (red) (D) or actin (red) (E,F). Asterisk, chromosomes in an anaphase bridge. (F) Met II eggs were incubated in 10 µM of latrunculin A (Lat A) for 10 min prior to fixation. Shown are representative Z-projections obtained using confocal microscopy. Quantification of H3T3 phosphorylation levels are also shown, as the mean±s.e.m. a.u., arbitrary units. The experiments were conducted at least twice, with 15 oocytes in each group. INC, incompetent oocyte; 1C, 1-cell embryo; 2C, 2-cell embryo; 8C, 8-cell embryo; BL, blastocyst; GV, germinal vesicle; Met I, metaphase I; Ana I, anaphase I; Telo I, telophase I, MII or Met II, metaphase II. Scale bars: 10 µm (A,C–F), 2 µm (inset in A).
Fig. 2.
Fig. 2.
Inhibition of haspin perturbs MI. Prophase-I-arrested oocytes were isolated and matured in vitro in the presence of the indicated concentration of 5-iodotubercidin (5-Itu) or CHR-6494 (CHR) prior to analysis. The drugs were added to culture medium containing oocytes with an intact nuclear envelope in A–F or oocytes that underwent nuclear envelope breakdown (NEBD) in G. (A,B) Oocytes were matured to Met I (7 h) prior to fixation and detection of phosphorylated threonine 3 on histone 3 (H3pT3) (green), kinetochores [(A) CREST anti-serum] (red) and DNA (blue) in the presence of 5-Itu. Shown are representative Z-projections obtained by confocal microscopy from one experiment. Quantification of the H3pT3 signals are shown to the right of each image panel. (B) The indicated material was microinjected 1 h after the addition of ethanol (EtOH) or 500 nM of 5-Itu. For A,B, data are shown as the mean±s.e.m.; ***P<0.001 (one-way ANOVA). Scale bars: 10 µm. (C) The timing of NEBD as determined by live-cell imaging when oocytes were matured in the indicated dose of 5-Itu. Images were captured every 30 min. (D,E,G) Analysis of the meiotic stage reached after maturation in the indicated drug for 16 h, as determined by confocal microscopy. Examples of interphase (‘I’) and collapsed (‘C’) oocytes are shown below the key. (F) Timing of polar body extrusion (PBE) as determined by live-cell imaging when oocytes were matured in the indicated dose of 5-Itu. The data were corrected for delay in NEBD prior to analysis. These experiments were repeated three times with ≥15 oocytes per group. GV, germinal vesicle; Met I, metaphase I; Ana I, anaphase I; Telo I, telophase I, Met II, metaphase II.
Fig. 3.
Fig. 3.
Perturbation of haspin alters Met I chromosome morphology. (A,B,F,G) Prophase-I-arrested oocytes were isolated and matured in vitro to Met I [7 h (control) and 9 h (5-Itu)] in the presence of the indicated concentration of 5-iodotubercidin (5-Itu). (B) Prior to maturation, oocytes were microinjected with PBS, GFP–haspin or GFP–haspin-K466R. The 5-Itu dose was 500 nM. Resolved bivalents were equivalent to ‘normal’ in panel A. (C,H,I) Prophase-I-arrested oocytes were isolated, microinjected with the indicated cRNA (green) and matured in vitro to Met II (16 h) (C) or Met I (7 h) (H,I) prior to analysis of chromosome morphology by DAPI staining (C) or SMC2 localization (red, H) and abundance (I). (D) Oocytes were matured in ethanol (EtOH) or 500 nM 5-Itu, or microinjected with PBS or GFP–haspin before maturation to Met II (18 h) prior to lysis and spreading of chromosomes. (E) Area measurements were taken of each sister chromatids using the freehand line tool in ImageJ. Each point is the area of a single chromatid from the eggs in D. DNA was detected by DAPI staining. In C,D, the number labels and asterisks correspond to the magnified image panels demonstrating the morphology phenotypes. (F,H) SMC2 (red) and DNA (blue) were detected by immunocytochemistry. Shown are representative Z-projections obtained by confocal microscopy. In F,H, the laser power was set so that the brightest group was not saturated. These experiments were repeated at least three times with a mean of 15 oocytes per group. Data are expressed as the mean±s.e.m.; *P<0.05 (one-way ANOVA, G; Student's t-test, I). Scale bars: 10 µm.
Fig. 4.
Fig. 4.
Perturbation of haspin does not affect sister chromatid cohesion at Met I. (A,B) Germinal-vesicle-intact oocytes were isolated and matured in vitro to Met I (7 h) in the presence of the indicated concentrations of 5-Itu prior to fixation. Oocytes were stained for REC8 (green), kinetochores (CREST anti-sera, red) and DNA (blue). (C–E) Germinal-vesicle-intact oocytes were isolated, microinjected with the indicated cRNA and matured in vitro to Met I (7 h) prior to fixation. In C, ethanol (EtOH) or 5-Itu was added to the maturation medium. Samples were stained for REC8 (red) and DNA (red in C, blue in D). Shown are representative Z-projections obtained by confocal microscopy from the same experiment. Scale bars: 10 µm. (B,E) Quantification of the REC8 signal along chromosomes. Data show the mean±s.e.m. These experiments were repeated at least twice with 10–15 oocytes per group. The data were not statistically significant [one-way ANOVA (B) or Student's t-test (E)].
Fig. 5.
Fig. 5.
Inhibition of haspin perturbs AURKC-CPC ICA localization. Prophase-I-arrested oocytes were isolated and matured in vitro to Met I (7 h for control, 9 h for 5-Itu) in the presence of the indicated concentrations of 5-iodotubercidin (5-Itu). (A,D,G) The indicated CPC subunits (green in merge) were detected by immunocytochemistry and shown are representative images. The ‘zoom’ panels highlight the presence of the CPC subunit remaining at the kinetochore (CREST antisera; red in merge) but diffusely localized along the ICA. The zoomed images show a selected chromosome from an optical slice before Z-projection. Scale bars: 10 µm. (B,E,H) Quantification of CPC subunit localization. K+diffuse, kinetochore and diffuse signal on interchromatid axis; K+ICA, kinetochore and interchromatid axis; diffuse, no kinetochore or interchromatid axis localization using a qualitative method. (C,F,I) Examples of quantitative assessment of the chromosome image in the zoom, using the ‘plot profiles’ function in ImageJ. The analyses show CPC subunit localization on chromosomes, following the use of CREST antisera to mark the kinetochores. These experiments were repeated at least three times with 15 oocytes per group. EtOH, ethanol.
Fig. 6.
Fig. 6.
Perturbation of haspin alters kinetochore–microtubule attachments and causes aneuploidy. (A,B) Prophase-I-arrested oocytes were isolated and matured in vitro to Met I (7 h and 9 h) in the presence of 500 nM 5-Itu prior to exposure to cold medium and fixation. Microtubules (green), kinetochores (red) and DNA (blue) were detected by confocal microscopy. Shown are representative Z-projections and optical slices. (B) Quantification of the types of attachments of each kinetochore per oocyte. At least 12 kinetochores were analyzed per oocyte and 40 oocytes were analyzed per group. (C,D) Prophase-I-arrested oocytes were isolated, microinjected with buffer or haspin cRNA and matured in vitro to Met I (7 h) prior to exposure to cold medium and fixation. Analysis was conducted as in A,B. Magn., magnified view of the area outlined in white. Scale bars: 10 µm. (E) Germinal-vesicle-intact oocytes were isolated and matured in vitro to Met II (16 h) in the presence of 500 nM 5-Itu. (F) Oocytes were treated as in E, but were microinjected with buffer or haspin cRNA prior to maturation. For E,F, after maturation, eggs were exposed to monastrol to collapse the spindle and spread the chromosomes. After fixation, DNA (blue in merge) and kinetochores (red in merge) were detected by epifluorescence microscopy. The images on the right demonstrate a typical spread and the difference in chromosome morphology between 5-Itu and overexpression treatments. All experiments were repeated three times. The quantitative data show the mean±s.e.m.; *P<0.05; ****P<0.0001 [Student's t-test (F,G), two-way ANOVA (B,D)]. EtOH, ethanol.

Similar articles

Cited by

References

    1. Ashtiyani R. K., Moghaddam A. M., Schubert V., Rutten T., Fuchs J., Demidov D., Blattner F. R., Houben A. (2011). AtHaspin phosphorylates histone H3 at threonine 3 during mitosis and contributes to embryonic patterning in Arabidopsis. Plant J. 68, 443–454 10.1111/j.1365-313X.2011.04699.x - DOI - PubMed
    1. Balboula A. Z., Schindler K. (2014). Selective disruption of aurora C kinase reveals distinct functions from aurora B kinase during meiosis in mouse oocytes. PLoS Genet. 10, e1004194 10.1371/journal.pgen.1004194 - DOI - PMC - PubMed
    1. Balboula A. Z., Stein P., Schultz R. M., Schindler K. (2014). Knockdown of RBBP7 unveils a requirement of histone deacetylation for CPC function in mouse oocytes. Cell Cycle 13, 600–611 10.4161/cc.27410 - DOI - PMC - PubMed
    1. Bembenek J. N., Verbrugghe K. J., Khanikar J., Csankovszki G., Chan R. C. (2013). Condensin and the spindle midzone prevent cytokinesis failure induced by chromatin bridges in C. elegans embryos. Curr. Biol. 23, 937–946 10.1016/j.cub.2013.04.028 - DOI - PMC - PubMed
    1. Carmena M., Wheelock M., Funabiki H., Earnshaw W. C. (2012). The chromosomal passenger complex (CPC): from easy rider to the godfather of mitosis. Nat. Rev. Mol. Cell Biol. 13, 789–803 10.1038/nrm3474 - DOI - PMC - PubMed

Publication types

MeSH terms