

Cerebral perfusion in insulin resistance and type 2 diabetes
- PMID: 25315860
- PMCID: PMC4294398
- DOI: 10.1038/jcbfm.2014.173
Cerebral perfusion in insulin resistance and type 2 diabetes
Abstract
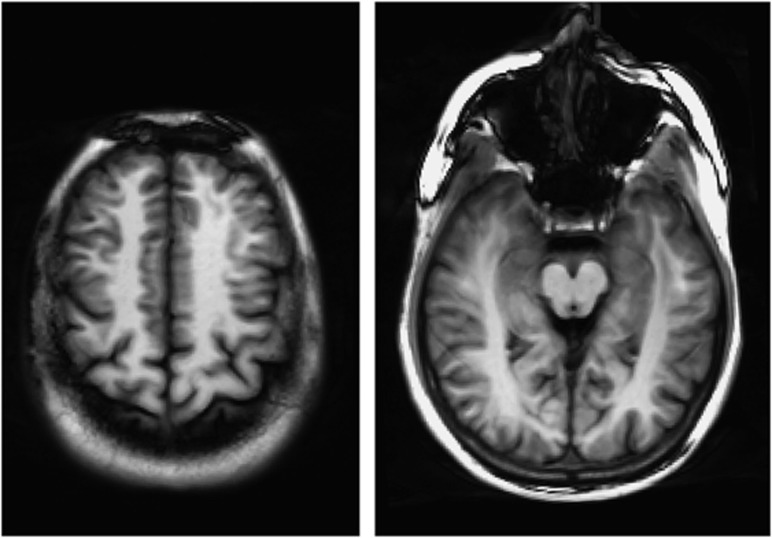
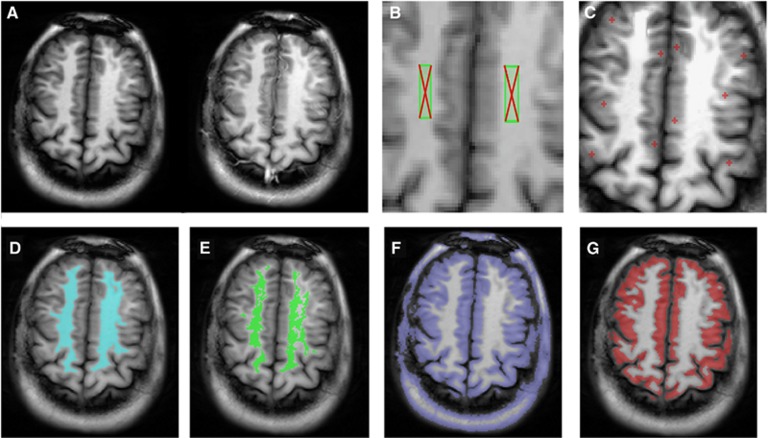
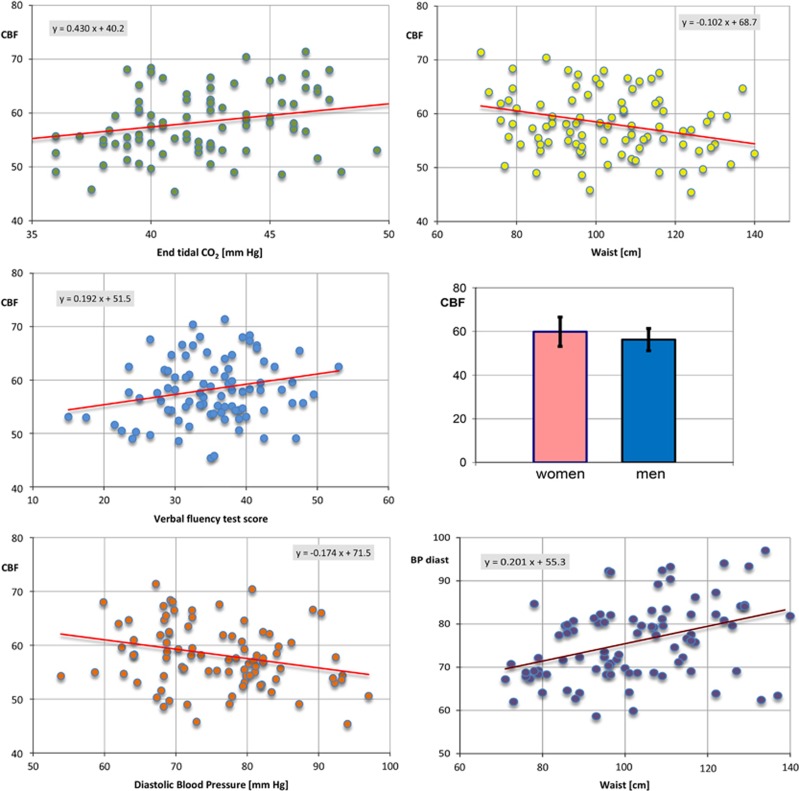
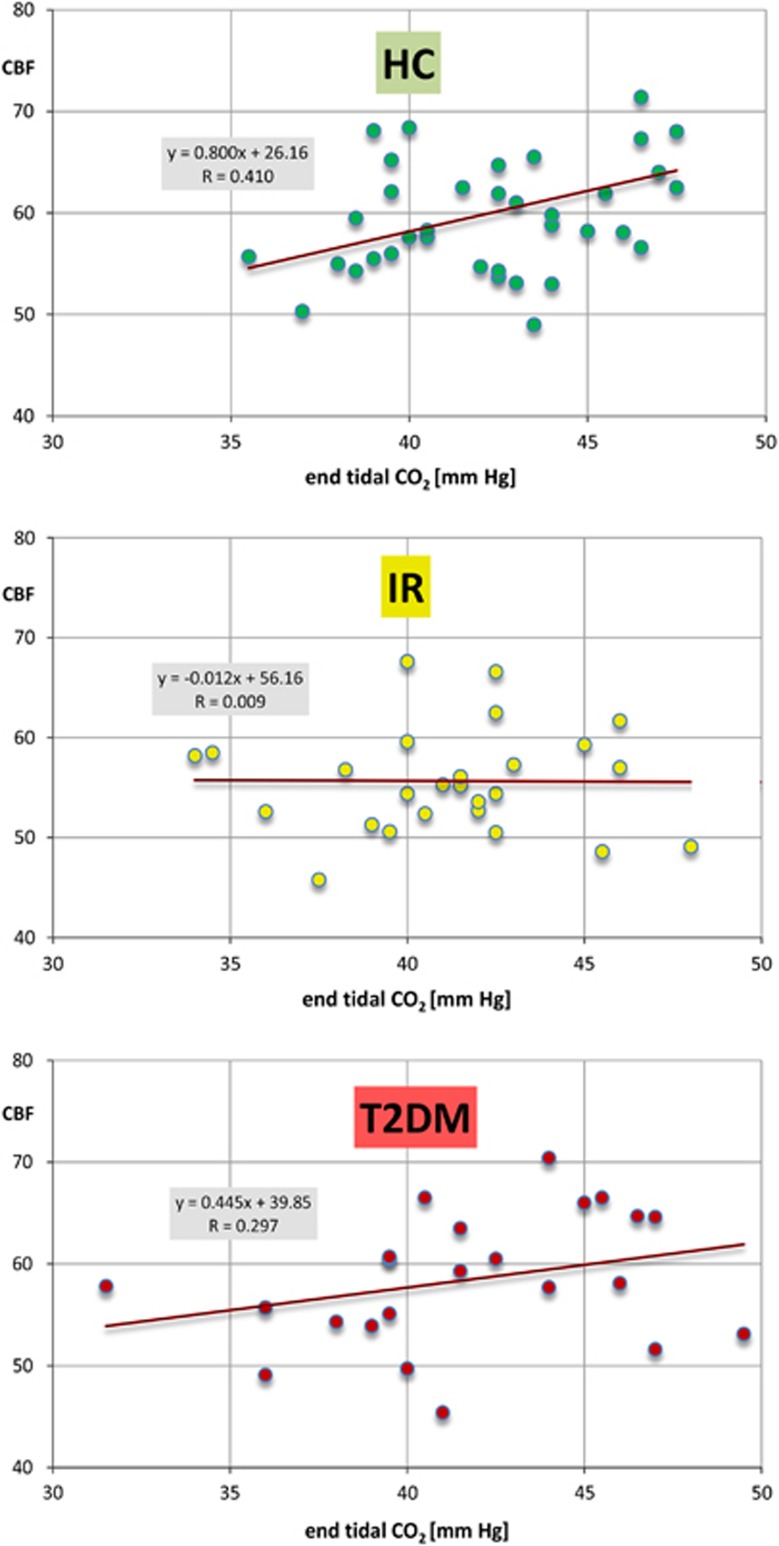
Cerebral perfusion was evaluated in 87 subjects prospectively enrolled in three study groups-healthy controls (HC), patients with insulin resistance (IR) but not with diabetes, and type 2 diabetes mellitus (T2DM). Participants received a comprehensive 8-hour clinical evaluation and arterial spin labeling magnetic resonance imaging (MRI). In order of decreasing significance, an association was found between cerebral blood flow (CBF) and sex, waist circumference, diastolic blood pressure (BP), end tidal CO2, and verbal fluency score (R(2)=0.27, F=5.89, P<0.001). Mean gray-matter CBF in IR was 4.4 mL/100 g per minute lower than in control subjects (P=0.005), with no hypoperfusion in T2DM (P=0.312). Subjects with IR also showed no CO2 relationship (slope=-0.012) in the normocapnic range, in contrast to a strong relationship in healthy brains (slope=0.800) and intermediate response (slope=0.445) in diabetic patients. Since the majority of T2DM but few IR subjects were aggressively treated with blood glucose, cholesterol, and BP lowering medications, our finding could be attributed to the beneficial effect of these drugs.
Figures

Similar articles
-
Cerebral perfusion alterations in type 2 diabetes and its relation to insulin resistance and cognitive dysfunction.Brain Imaging Behav. 2017 Oct;11(5):1248-1257. doi: 10.1007/s11682-016-9583-9. Brain Imaging Behav. 2017. PMID: 27714551 Free PMC article.
-
The resting perfusion pattern associates with functional decline in type 2 diabetes.Neurobiol Aging. 2017 Dec;60:192-202. doi: 10.1016/j.neurobiolaging.2017.09.004. Epub 2017 Sep 14. Neurobiol Aging. 2017. PMID: 28992987 Free PMC article.
-
Insulin resistance is associated with lower arterial blood flow and reduced cortical perfusion in cognitively asymptomatic middle-aged adults.J Cereb Blood Flow Metab. 2017 Jun;37(6):2249-2261. doi: 10.1177/0271678X16663214. Epub 2016 Jan 1. J Cereb Blood Flow Metab. 2017. PMID: 27488909 Free PMC article.
-
Intensive blood pressure control affects cerebral blood flow in type 2 diabetes mellitus patients.Hypertension. 2011 Apr;57(4):738-45. doi: 10.1161/HYPERTENSIONAHA.110.160523. Epub 2011 Feb 28. Hypertension. 2011. PMID: 21357278
-
Effects of high-protein diet on glycemic control, insulin resistance and blood pressure in type 2 diabetes: A systematic review and meta-analysis of randomized controlled trials.Clin Nutr. 2020 Jun;39(6):1724-1734. doi: 10.1016/j.clnu.2019.08.008. Epub 2019 Aug 15. Clin Nutr. 2020. PMID: 31466731
Cited by
-
Can insulin signaling pathways be targeted to transport Aβ out of the brain?Front Aging Neurosci. 2015 Jun 16;7:114. doi: 10.3389/fnagi.2015.00114. eCollection 2015. Front Aging Neurosci. 2015. PMID: 26136681 Free PMC article. Review.
-
Association between triglyceride glucose index and all-cause mortality in patients with cerebrovascular disease: a retrospective study.Diabetol Metab Syndr. 2024 Jan 3;16(1):1. doi: 10.1186/s13098-023-01243-2. Diabetol Metab Syndr. 2024. PMID: 38173012 Free PMC article.
-
Reduced Regional Cerebral Blood Flow Relates to Poorer Cognition in Older Adults With Type 2 Diabetes.Front Aging Neurosci. 2018 Sep 10;10:270. doi: 10.3389/fnagi.2018.00270. eCollection 2018. Front Aging Neurosci. 2018. PMID: 30250430 Free PMC article.
-
Reduced basal macrovascular and microvascular cerebral blood flow in young adults with metabolic syndrome: potential mechanisms.J Appl Physiol (1985). 2023 Jul 1;135(1):94-108. doi: 10.1152/japplphysiol.00688.2022. Epub 2023 May 18. J Appl Physiol (1985). 2023. PMID: 37199780 Free PMC article.
-
Association between metabolic score for insulin resistance and stroke: a nationally representative cross-sectional study from NHANES 2007-2018.Front Neurol. 2025 Jan 3;15:1478884. doi: 10.3389/fneur.2024.1478884. eCollection 2024. Front Neurol. 2025. PMID: 39830199 Free PMC article.
References
-
- Flegal KM, Carroll MD, Kit BK, Ogden CL. Prevalence of obesity and trends in the distribution of body mass index among US adults, 1999-2010. JAMA. 2012;307:491–497. - PubMed
-
- Ervin RB. National Health Statistics Reports. Centers for Disease Control and Prevention: Maryland, USA; 2009. Prevalence of metabolic syndrome among adults 20 years of age and over, by sex, age, race and ethnicity, and body mass index: United States, 2003-2006. - PubMed
-
- Awad N, Gagnon M, Messier C. The relationship between Impaired glucose tolerance, type 2 diabetes, and cognitive function. J Clin Exper Neuropsych. 2004;26:1044–1080. - PubMed
Publication types
MeSH terms
Grants and funding
LinkOut - more resources
Full Text Sources
Other Literature Sources
Medical
