

Nigrostriatal Dopamine Acting on Globus Pallidus Regulates Sleep
- PMID: 25316334
- PMCID: PMC4785943
- DOI: 10.1093/cercor/bhu241
Nigrostriatal Dopamine Acting on Globus Pallidus Regulates Sleep
Abstract
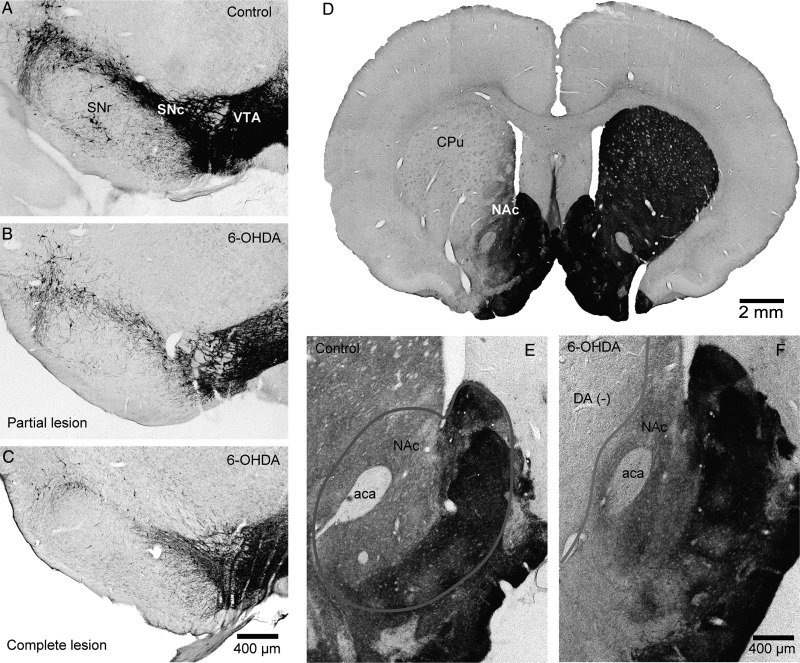
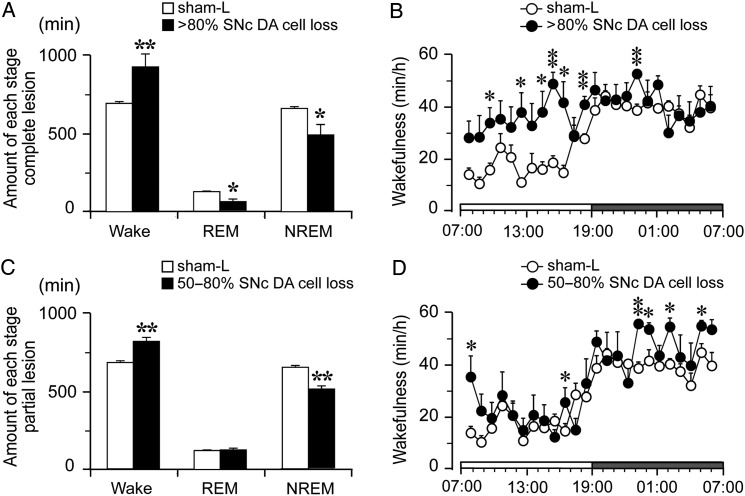
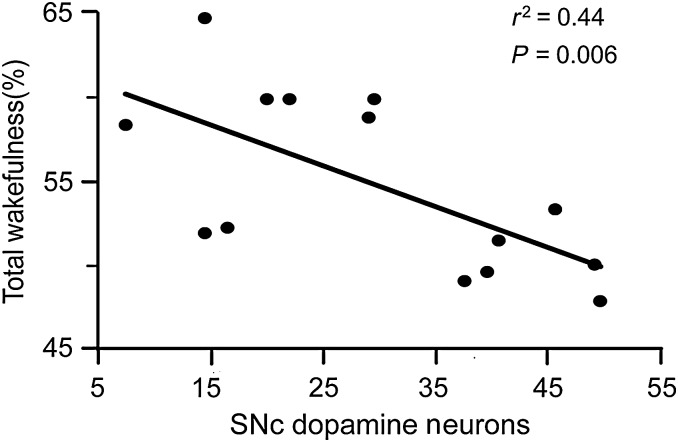
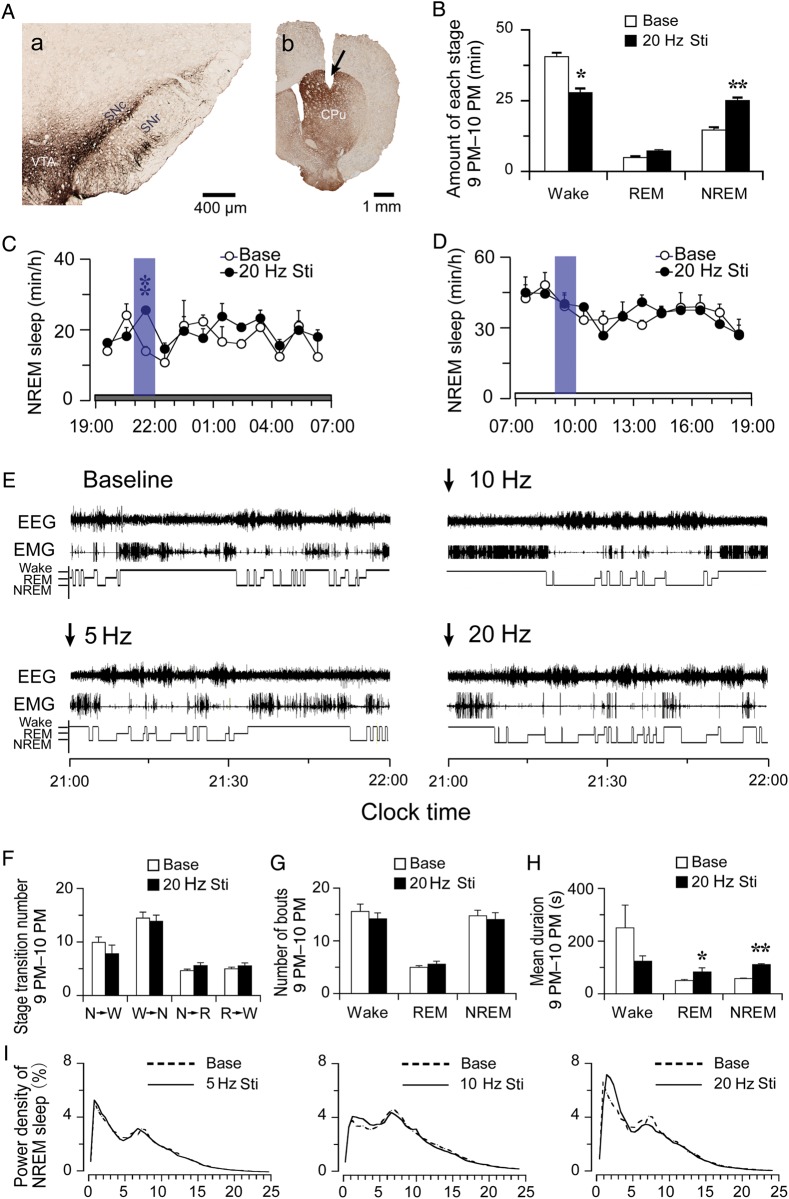
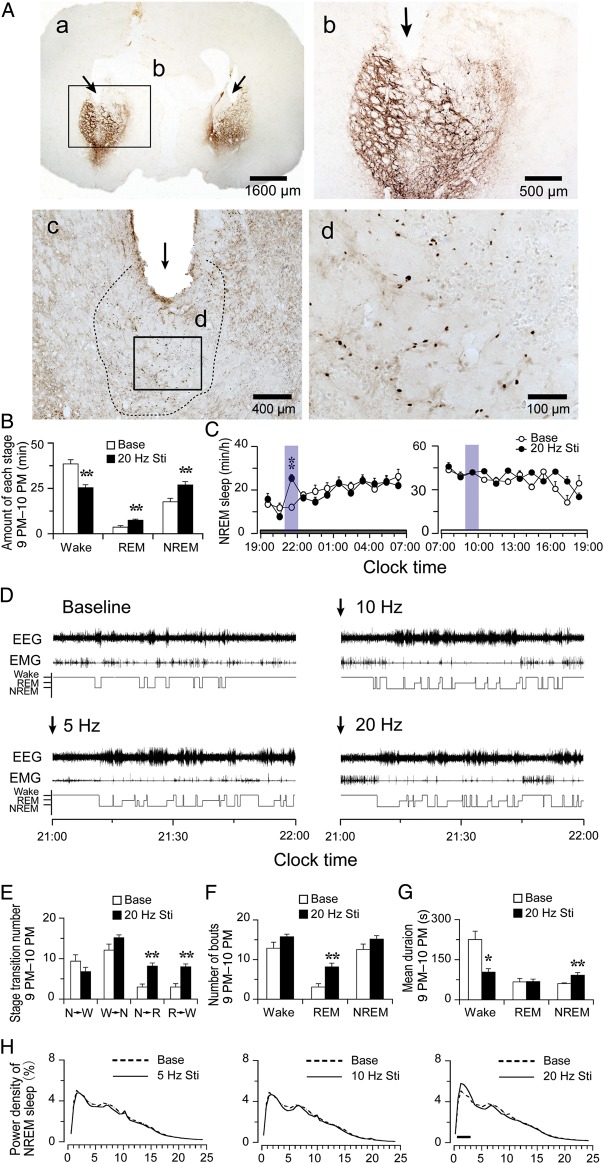
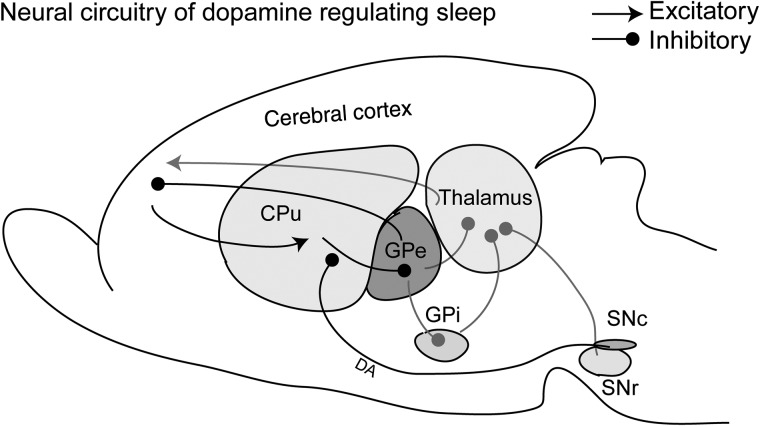
Lesions of the globus pallidus externa (GPe) produce a profound sleep loss (∼45%) in rats, suggesting that GPe neurons promote sleep. As GPe neuronal activity is enhanced by dopamine (DA) from the substantia nigra pars compacta (SNc), we hypothesized that SNc DA via the GPe promotes sleep. To test this hypothesis, we selectively destroyed the DA afferents to the caudoputamen (CPu) using 6-hydroxydopamine and examined changes in sleep-wake profiles in rats. Rats with 80-90% loss of SNc neurons displayed a significant 33.7% increase in wakefulness (or sleep reduction). This increase significantly correlated with the extent of SNc DA neuron loss. Furthermore, these animals exhibited sleep-wake fragmentation and reduced diurnal variability of sleep. We then optogenetic-stimulated SNc DA terminals in the CPu and found that 20-Hz stimulation from 9 to 10 PM increased total sleep by 69% with high electroencephalograph (EEG) delta power. We finally directly optogenetic-stimulated GPe neurons and found that 20-Hz stimulation of the GPe from 9 to 10 PM increased total sleep by 66% and significantly increased EEG delta power. These findings elucidate a novel circuit for DA control of sleep and the mechanisms of abnormal sleep in BG disorders such as Parkinson's disease and Huntington's disease.
Keywords: Parkinson's disease; dopamine; globus pallidus; sleep; substantia nigra pars compacta.
© The Author 2014. Published by Oxford University Press. All rights reserved. For Permissions, please e-mail: journals.permissions@oup.com.
Figures
Similar articles
-
Striatal, pallidal, and pars reticulata evoked inhibition of nigrostriatal dopaminergic neurons is mediated by GABA(A) receptors in vivo.Neuroscience. 1999 Mar;89(3):799-812. doi: 10.1016/s0306-4522(98)00355-8. Neuroscience. 1999. PMID: 10199614
-
Substantia nigra compacta neurons that innervate the reticular thalamic nucleus in the rat also project to striatum or globus pallidus: implications for abnormal motor behavior.Neuroscience. 2006 Dec 1;143(2):477-86. doi: 10.1016/j.neuroscience.2006.08.033. Epub 2006 Sep 27. Neuroscience. 2006. PMID: 17008017
-
Effects of dopamine depletion on information flow between the subthalamic nucleus and external globus pallidus.J Neurophysiol. 2011 Oct;106(4):2012-23. doi: 10.1152/jn.00094.2011. Epub 2011 Aug 3. J Neurophysiol. 2011. PMID: 21813748 Free PMC article.
-
Functional organization of the basal ganglia: therapeutic implications for Parkinson's disease.Mov Disord. 2008;23 Suppl 3:S548-59. doi: 10.1002/mds.22062. Mov Disord. 2008. PMID: 18781672 Review.
-
Cellular and Synaptic Dysfunctions in Parkinson's Disease: Stepping out of the Striatum.Cells. 2019 Aug 29;8(9):1005. doi: 10.3390/cells8091005. Cells. 2019. PMID: 31470672 Free PMC article. Review.
Cited by
-
The effect of pallidal stimulation on sleep outcomes and related brain connectometries in Parkinson's disease.NPJ Parkinsons Dis. 2024 Nov 4;10(1):212. doi: 10.1038/s41531-024-00800-4. NPJ Parkinsons Dis. 2024. PMID: 39496609 Free PMC article.
-
Acupuncture in circadian rhythm sleep-wake disorders and its potential neurochemical mechanisms.Front Neurosci. 2024 Jan 22;18:1346635. doi: 10.3389/fnins.2024.1346635. eCollection 2024. Front Neurosci. 2024. PMID: 38318465 Free PMC article. Review.
-
Mechanisms of Sleep/Wake Regulation under Hypodopaminergic State: Insights from MitoPark Mouse Model of Parkinson's Disease.Adv Sci (Weinh). 2023 Feb;10(5):e2203170. doi: 10.1002/advs.202203170. Epub 2022 Dec 14. Adv Sci (Weinh). 2023. PMID: 36515271 Free PMC article.
-
Ventrolateral periaqueductal gray mediates rapid eye movement sleep regulation by melanin-concentrating hormone neurons.Neuroscience. 2019 May 15;406:314-324. doi: 10.1016/j.neuroscience.2019.03.020. Epub 2019 Mar 16. Neuroscience. 2019. PMID: 30890480 Free PMC article.
-
Animal Approaches to Studying Risk Factors for Parkinson's Disease: A Narrative Review.Brain Sci. 2024 Feb 2;14(2):156. doi: 10.3390/brainsci14020156. Brain Sci. 2024. PMID: 38391730 Free PMC article. Review.
References
-
- Cooper AJ, Stanford IM. 2001. Dopamine D2 receptor mediated presynaptic inhibition of striatopallidal GABA(A) IPSCs in vitro. Neuropharmacology. 41:62–71. - PubMed
-
- Dahan L, Astier B, Vautrelle N, Urbain N, Kocsis B, Chouvet G. 2007. Prominent burst firing of dopaminergic neurons in the ventral tegmental area during paradoxical sleep. Neuropsychopharmacology. 32:1232–1241. - PubMed
Publication types
MeSH terms
Substances
Grants and funding
LinkOut - more resources
Full Text Sources
Other Literature Sources
Research Materials
Miscellaneous
