. 2016 Jan;26(1):288-303.
doi: 10.1093/cercor/bhu239. Epub 2014 Oct 14.

Generation and Evaluation of a Cortical Area Parcellation from Resting-State Correlations

Affiliations

Generation and Evaluation of a Cortical Area Parcellation from Resting-State Correlations

Evan M Gordon et al. Cereb Cortex. 2016 Jan.

Abstract

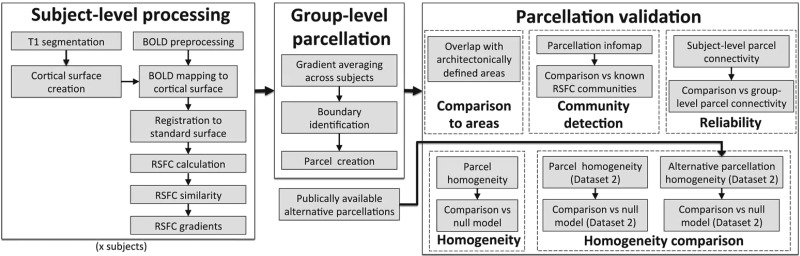
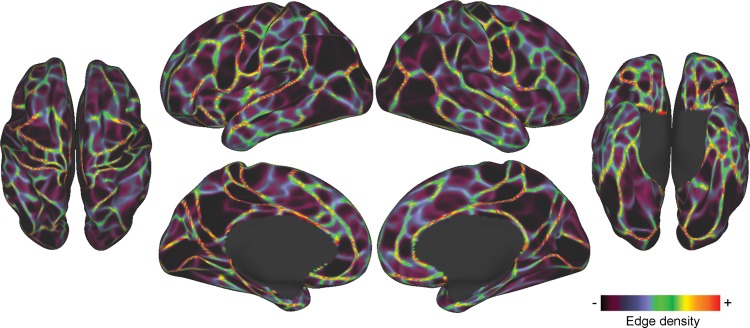
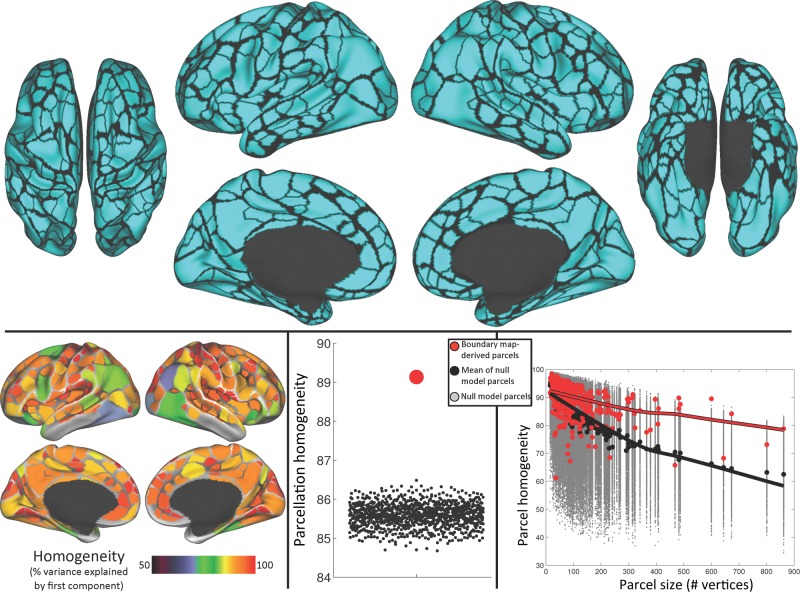
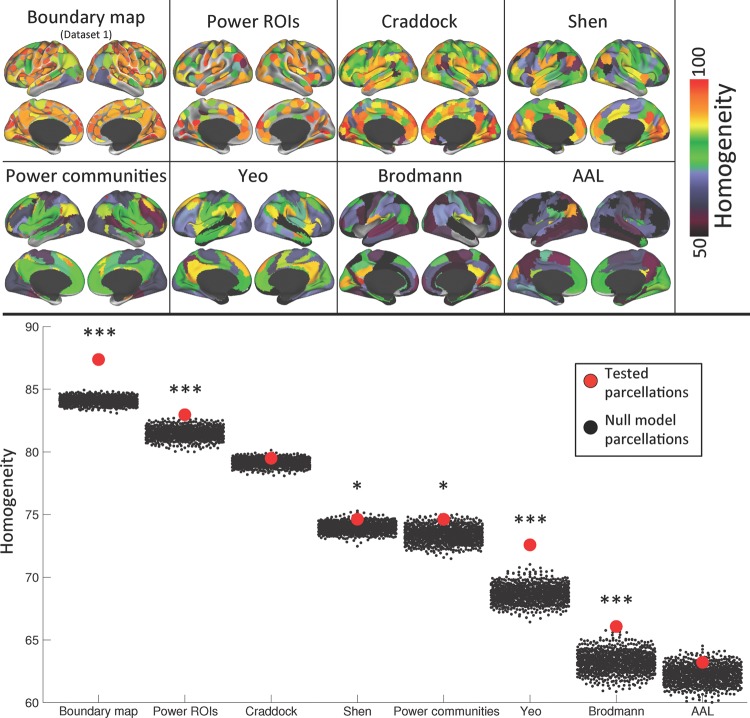
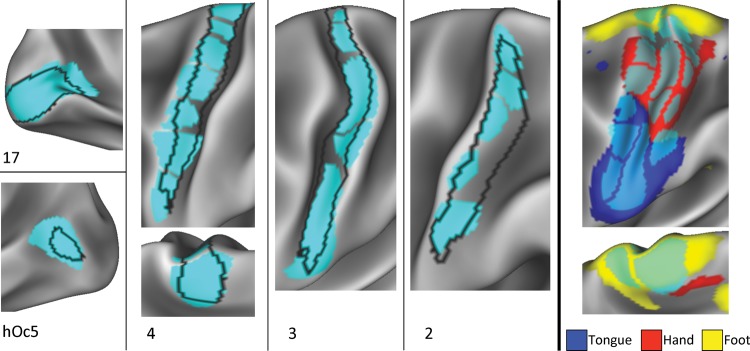
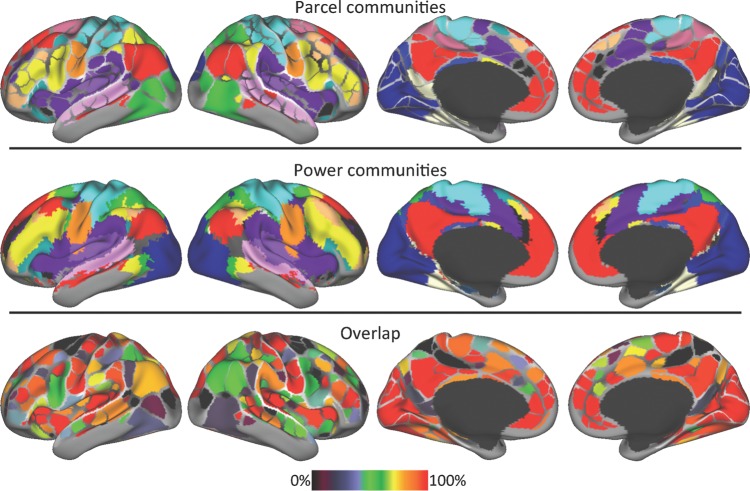
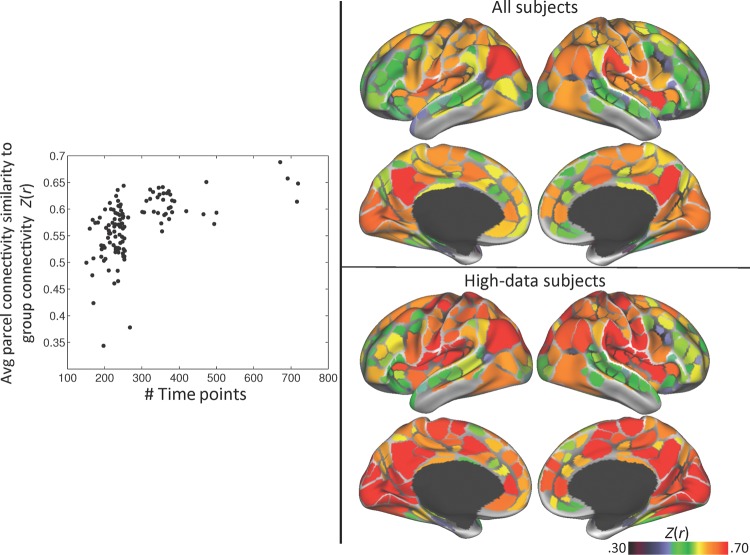
The cortical surface is organized into a large number of cortical areas; however, these areas have not been comprehensively mapped in the human. Abrupt transitions in resting-state functional connectivity (RSFC) patterns can noninvasively identify locations of putative borders between cortical areas (RSFC-boundary mapping; Cohen et al. 2008). Here we describe a technique for using RSFC-boundary maps to define parcels that represent putative cortical areas. These parcels had highly homogenous RSFC patterns, indicating that they contained one unique RSFC signal; furthermore, the parcels were much more homogenous than a null model matched for parcel size when tested in two separate datasets. Several alternative parcellation schemes were tested this way, and no other parcellation was as homogenous as or had as large a difference compared with its null model. The boundary map-derived parcellation contained parcels that overlapped with architectonic mapping of areas 17, 2, 3, and 4. These parcels had a network structure similar to the known network structure of the brain, and their connectivity patterns were reliable across individual subjects. These observations suggest that RSFC-boundary map-derived parcels provide information about the location and extent of human cortical areas. A parcellation generated using this method is available at http://www.nil.wustl.edu/labs/petersen/Resources.html.

Keywords: cortical areas; functional connectivity; parcellation; resting state.


Figures

Figure 1.
Figure 1.
Visual outline of analysis methods.
Figure 2.
Figure 2.
RSFC-boundary map from Dataset 1. Bright colors indicate locations where abrupt transitions in RSFC patterns were reliably found across many cortical vertices, representing putative boundaries between cortical areas. Dim colors represent relatively stable RSFC patterns.
Figure 3.
Figure 3.
Boundary map-derived parcels are both highly homogenous and more homogenous than a null model. Top: 422 cortical parcels were created from the Dataset 1 boundary map. Bottom left: homogeneity of each parcel, calculated as the percent of the variance in RSFC patterns explained by the parcel's first PCA eigenvariate. Green indicates a parcel is >70% homogenous; red indicates >90% homogenous. Bottom middle: average homogeneity across parcels (red dot) was significantly higher than that across parcels of each null model iteration (black dots). Bottom right: homogeneity of individual real parcels (red dots) was higher than that of null model parcels (gray dots) when plotted against parcel size. Black dots indicate the median homogeneity across iterations for each null model parcel. Lowess fit lines in red and black emphasize the homogeneity–size relationship for the real and null model parcels, respectively.
Figure 4.
Figure 4.
When tested in an independent dataset, the boundary map-derived parcellation is more homogenous than any other parcellation, and does better relative to its null model than any other parcellation. Top: parcel homogeneities of each competing parcellation when tested in Dataset 2. Bottom: average homogeneity across parcels of each parcellation (red dots) compared with the average homogeneity across parcels of each of 1000 null model iterations (black dots), which vary in homogeneity because of differing parcel sizes. ***indicates the parcellation was more homogenous than all of its 1000 null model iterations (i.e., P < 0.001); *indicates the parcellation was more homogenous than at least 950 of its null model iterations (P < 0.05).
Figure 5.
Figure 5.
Boundary map-derived parcels match known cortical areas and functional activation patterns. Left and middle: a variety of cytoarchitectonically defined cortical areas (Fischl et al. 2008) were matched by boundary map-derived parcels. Area 17 overlapped very well with one parcel, whereas area hOc5 overlapped moderately well with another parcel. Areas 2, 3, and 4 overlapped with several adjacent parcels. Right: parcel divisions within cytoarchitectonic areas 2, 3, and 4 corresponded with divisions between activation clusters from motor movements of the right foot, right hand, and tongue (Barch et al. 2013).
Figure 6.
Figure 6.
The network structure of the boundary map-derived parcellation closely corresponds with the previously described network structure of the brain. Top: communities identified with the Infomap community detection procedure using the boundary map-derived parcels as network nodes. See the text for names of each colored community. Middle: the network structure of the brain calculated using every voxel as a network node (Power et al. 2011). Bottom: spatial overlap of the parcel- and voxel-wise community assignments.
Figure 7.
Figure 7.
Group-average parcel connectivity is similar to subject-level connectivity, but this similarity varies across parcels and subjects. Left: the average Fisher-transformed correlation between group- and subject-level parcel connectivity patterns for each subject, plotted against the number of time points in each subject's resting-state data. Top right: the average group–subject correlation for each parcel, averaged across all subjects. Bottom right: the average group–subject correlation for each parcel, averaged across subjects with >300 time points (12.5 min) of resting-state data.

References

    1. Amunts K, Malikovic A, Mohlberg H, Schormann T, Zilles K. 2000. Brodmann's areas 17 and 18 brought into stereotaxic space—where and how variable? NeuroImage. 11:66–84. - PubMed
    1. Anderson JS, Ferguson MA, Lopez-Larson M, Yurgelun-Todd D. 2011. Reproducibility of single-subject functional connectivity measurements. AJNR Am J Neuroradiol. 32:548–555. - PMC - PubMed
    1. Argyelan M, Ikuta T, DeRosse P, Braga RJ, Burdick KE, John M, Kingsley PB, Malhotra AK, Szeszko PR. 2014. Resting-state fMRI connectivity impairment in schizophrenia and bipolar disorder. Schizophr Bull. 40:100–110. - PMC - PubMed
    1. Barch DM, Burgess GC, Harms MP, Petersen SE, Schlaggar BL, Corbetta M, Glasser MF, Curtiss S, Dixit S, Feldt C, et al. 2013. Function in the human connectome: task-fMRI and individual differences in behavior. NeuroImage. 80:169–189. - PMC - PubMed
    1. Barnes KA, Nelson SM, Cohen AL, Power JD, Coalson RS, Miezin FM, Vogel AC, Dubis JW, Church JA, Petersen SE, et al. 2012. Parcellation in left lateral parietal cortex is similar in adults and children. Cereb Cortex. 22:1148–1158. - PMC - PubMed

Publication types