

Slow-Theta-to-Gamma Phase-Amplitude Coupling in Human Hippocampus Supports the Formation of New Episodic Memories
- PMID: 25316340
- PMCID: PMC4677977
- DOI: 10.1093/cercor/bhu232
Slow-Theta-to-Gamma Phase-Amplitude Coupling in Human Hippocampus Supports the Formation of New Episodic Memories
Abstract
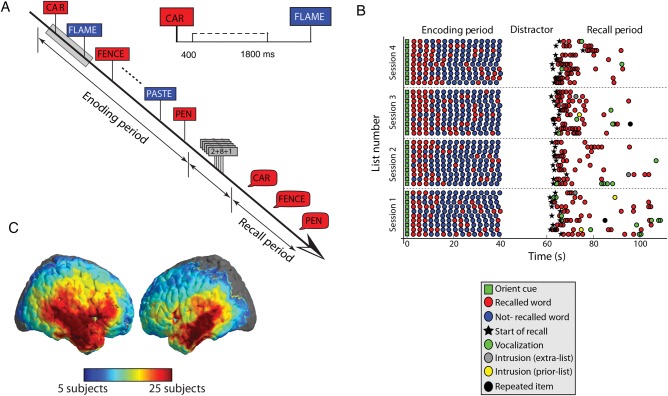
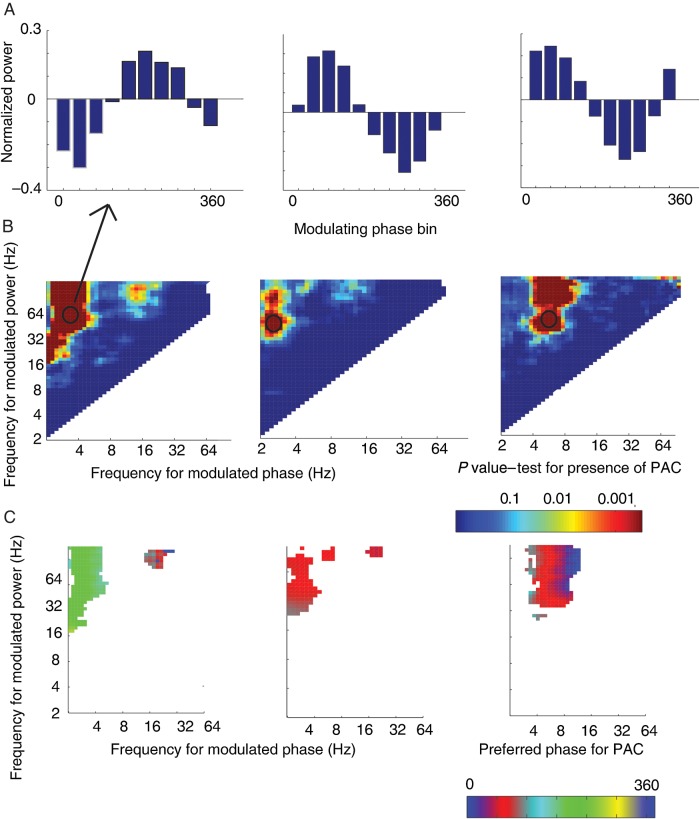
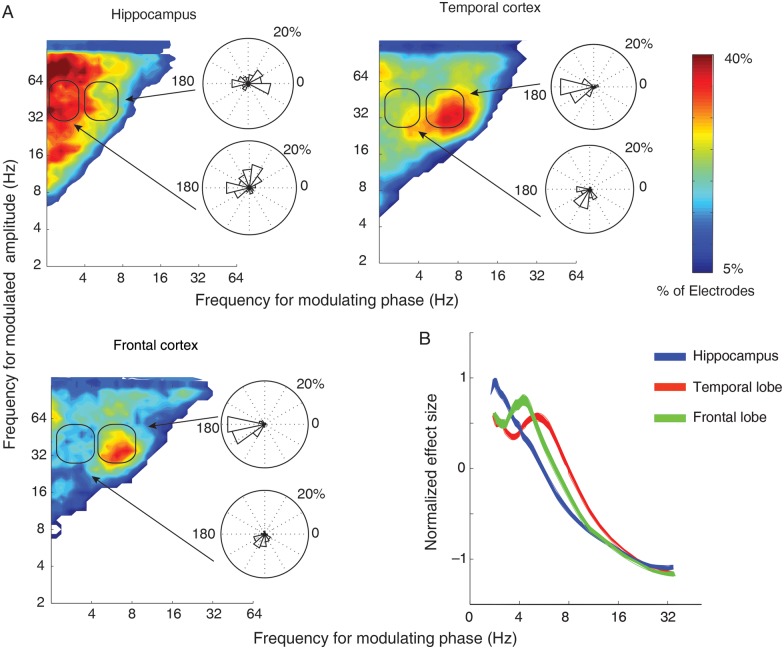
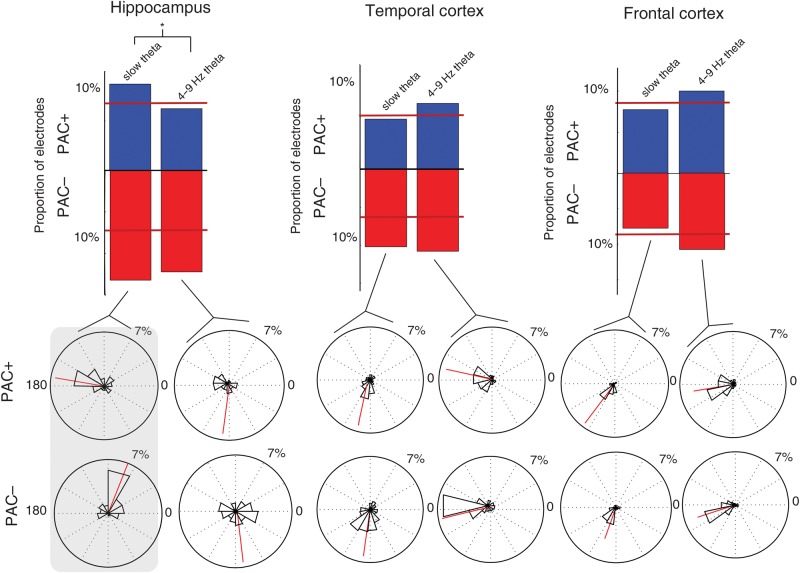
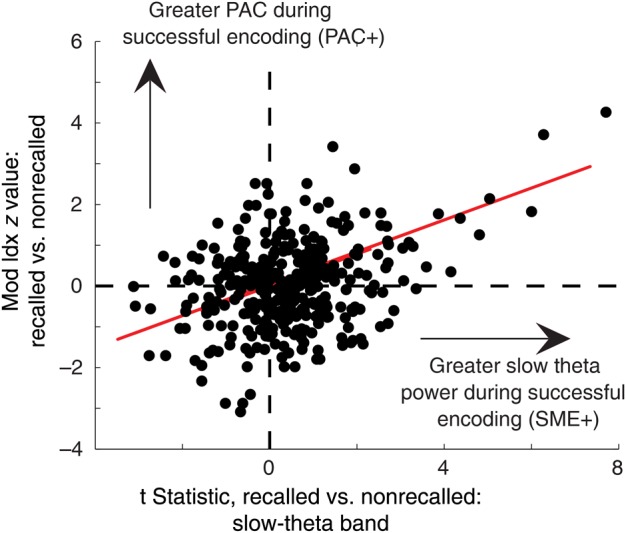
Phase-amplitude coupling (PAC) has been proposed as a neural mechanism for coordinating information processing across brain regions. Here we sought to characterize PAC in the human hippocampus, and in temporal and frontal cortices, during the formation of new episodic memories. Intracranial recordings taken as 56 neurosurgical patients studied and recalled lists of words revealed significant hippocampal PAC, with slow-theta activity (2.5-5 Hz) modulating gamma band activity (34-130 Hz). Furthermore, a significant number of hippocampal electrodes exhibited greater PAC during successful than unsuccessful encoding, with the gamma activity at these sites coupled to the trough of the slow-theta oscillation. These same conditions facilitate LTP in animal models, providing a possible mechanism of action for this effect in human memory. Uniquely in the hippocampus, phase preference during item encoding exhibited a biphasic pattern. Overall, our findings help translate between the patterns identified during basic memory tasks in animals and those present during complex human memory encoding. We discuss the unique properties of human hippocampal PAC and how our findings relate to influential theories of information processing based on theta-gamma interactions.
Keywords: episodic memory; hippocampus; phase–amplitude coupling; theta.
© The Author 2014. Published by Oxford University Press. All rights reserved. For Permissions, please e-mail: journals.permissions@oup.com.
Figures
Similar articles
-
Human hippocampal theta oscillations and the formation of episodic memories.Hippocampus. 2012 Apr;22(4):748-61. doi: 10.1002/hipo.20937. Epub 2011 Apr 27. Hippocampus. 2012. PMID: 21538660
-
Cross-regional phase amplitude coupling supports the encoding of episodic memories.Hippocampus. 2021 May;31(5):481-492. doi: 10.1002/hipo.23309. Epub 2021 Feb 5. Hippocampus. 2021. PMID: 33544408 Free PMC article.
-
Hippocampal Theta Oscillations Support Successful Associative Memory Formation.J Neurosci. 2020 Dec 2;40(49):9507-9518. doi: 10.1523/JNEUROSCI.0767-20.2020. Epub 2020 Nov 6. J Neurosci. 2020. PMID: 33158958 Free PMC article.
-
Frontal midline theta oscillations during working memory maintenance and episodic encoding and retrieval.Neuroimage. 2014 Jan 15;85 Pt 2(0 2):721-9. doi: 10.1016/j.neuroimage.2013.08.003. Epub 2013 Aug 8. Neuroimage. 2014. PMID: 23933041 Free PMC article. Review.
-
Theta rhythm and the encoding and retrieval of space and time.Neuroimage. 2014 Jan 15;85 Pt 2(0 2):656-66. doi: 10.1016/j.neuroimage.2013.06.022. Epub 2013 Jun 14. Neuroimage. 2014. PMID: 23774394 Free PMC article. Review.
Cited by
-
Memory formation during anaesthesia: plausibility of a neurophysiological basis.Br J Anaesth. 2015 Jul;115 Suppl 1(Suppl 1):i13-i19. doi: 10.1093/bja/aev035. Epub 2015 Mar 3. Br J Anaesth. 2015. PMID: 25735711 Free PMC article. Review.
-
Neural oscillations during cognitive processes in an App knock-in mouse model of Alzheimer's disease pathology.Sci Rep. 2019 Nov 8;9(1):16363. doi: 10.1038/s41598-019-51928-w. Sci Rep. 2019. PMID: 31705038 Free PMC article.
-
Alterations of Coherent Theta and Gamma Network Oscillations as an Early Biomarker of Temporal Lobe Epilepsy and Alzheimer's Disease.Front Integr Neurosci. 2018 Aug 27;12:36. doi: 10.3389/fnint.2018.00036. eCollection 2018. Front Integr Neurosci. 2018. PMID: 30210311 Free PMC article. Review.
-
Maturational trajectories of local and long-range functional connectivity in autism during face processing.Hum Brain Mapp. 2018 Oct;39(10):4094-4104. doi: 10.1002/hbm.24234. Epub 2018 Jun 26. Hum Brain Mapp. 2018. PMID: 29947148 Free PMC article.
-
Brain Oscillations in Sport: Toward EEG Biomarkers of Performance.Front Psychol. 2016 Feb 26;7:246. doi: 10.3389/fpsyg.2016.00246. eCollection 2016. Front Psychol. 2016. PMID: 26955362 Free PMC article. Review.
References
-
- Addison P. 2002. The illustrated wavelet transform handbook: introductory theory and applications in science, engineering, medicine and finance. Bristol: Institute of Physics Publishing.
-
- Buzsáki G. 2005. Theta rhythm of navigation: link between path integration and landmark navigation, episodic and semantic memory. Hippocampus. 15(7):827–840. - PubMed
Publication types
MeSH terms
Grants and funding
LinkOut - more resources
Full Text Sources
Other Literature Sources
