. 2016 Apr;26(4):1388-400.
doi: 10.1093/cercor/bhu238. Epub 2014 Oct 14.

Multiple Brain Markers are Linked to Age-Related Variation in Cognition

Affiliations

Multiple Brain Markers are Linked to Age-Related Variation in Cognition

Trey Hedden et al. Cereb Cortex. 2016 Apr.

Abstract

Age-related alterations in brain structure and function have been challenging to link to cognition due to potential overlapping influences of multiple neurobiological cascades. We examined multiple brain markers associated with age-related variation in cognition. Clinically normal older humans aged 65-90 from the Harvard Aging Brain Study (N = 186) were characterized on a priori magnetic resonance imaging markers of gray matter thickness and volume, white matter hyperintensities, fractional anisotropy (FA), resting-state functional connectivity, positron emission tomography markers of glucose metabolism and amyloid burden, and cognitive factors of processing speed, executive function, and episodic memory. Partial correlation and mediation analyses estimated age-related variance in cognition shared with individual brain markers and unique to each marker. The largest relationships linked FA and striatum volume to processing speed and executive function, and hippocampal volume to episodic memory. Of the age-related variance in cognition, 70-80% was accounted for by combining all brain markers (but only ∼20% of total variance). Age had significant indirect effects on cognition via brain markers, with significant markers varying across cognitive domains. These results suggest that most age-related variation in cognition is shared among multiple brain markers, but potential specificity between some brain markers and cognitive domains motivates additional study of age-related markers of neural health.

Keywords: aging; amyloid; executive function; memory; white matter.


Figures

Figure 1.
Figure 1.
Neuroimaging methods. (A) Cortical thickness measures extracted from FreeSurfer-defined regions for parahippocampal gyrus (yellow), entorhinal cortex (white), and a set of cortical regions (all other colors) chosen from a prior study (Fjell et al. 2013). Regions are overlaid on an example subject's surface map. (B) Volume measures extracted from FreeSurfer-defined regions for hippocampus (green), and striatum averaged across caudate (blue) and putamen (pink). Volume measures were corrected for estimated total intracranial volume, and are overlaid on an example subject's brain. (C) Functional connectivity measure for the DN. (D) Functional connectivity measure for the frontoparietal network. Connectivity measures were averaged across all voxels in each displayed network template defined from an independent dataset, and are displayed on a surface map in atlas space. (E) Diffusion tensor imaging measure of FA extracted from a mask of the mean FA skeleton (yellow), overlaid on the group average FA map. (F) White matter hyperintensity volumes extracted using an automated algorithm in each individual subject. Regions labeled as hyperintensities (yellow) are displayed for an example subject. (G) Fluorodeoxyglucose (FDG) SUVR values extracted from a composite set of regions (gray) defined from a previous study (Landau et al. 2011). Regions are overlaid on data from an example subject and projected to a surface map in atlas space. (H) Pittsburgh Compound-B (PIB) DVR values extracted from a composite set of regions (gray) defined in previous studies using independent datasets (Hedden et al. 2009; Hedden, Van Dijk et al. 2012). Regions are overlaid on data from an example subject and projected to a surface map in atlas space.
Figure 2.
Figure 2.
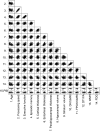
Pairwise correlations between age, cognition, and brain markers. Scatterplots for each correlation reported in Table 1 are displayed for descriptive purposes.
Figure 3.
Figure 3.
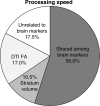
Age-related variance in processing speed shared with and unique to brain markers. Pie sections indicate the percentage of age-related variance in processing speed that is unrelated to any brain marker examined, unique to individual brain markers, or shared among any 2 or more brain markers. Only variables uniquely sharing >2% of age-related variance in processing speed are indicated.
Figure 4.
Figure 4.
Age-related variance in executive function shared with and unique to brain markers. Pie sections indicate the percentage of age-related variance in executive function that is unrelated to any brain marker examined, unique to individual brain markers, or shared among any 2 or more brain markers. Only variables uniquely sharing >2% of age-related variance in executive function are indicated.
Figure 5.
Figure 5.
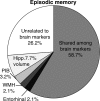
Age-related variance in episodic memory shared with and unique to brain markers. Pie sections indicate the percentage of age-related variance in episodic memory that is unrelated to any brain marker examined, unique to individual brain markers, or shared among any 2 or more brain markers. Only variables uniquely sharing >2% of age-related variance in episodic memory are indicated.
Figure 6.
Figure 6.
Mediation model for processing speed. Results from the reduced mediation model including only brain markers with significant indirect effects from age to cognition. Solid lines indicate significant paths (P ≤ 0.05, one-tailed), dashed lines indicate nonsignificant paths. Path values indicate standardized beta weights. Italicized values indicate direct (unmediated) paths from age to cognition. Indirect effects operating through each brain marker and the total indirect effect are given below the model. Values in parentheses indicate the 10 000 sample bootstrapped 90% confidence intervals for the indirect effects. All displayed confidence intervals did not include 0; results are truncated at −0.001. R2 indicates the fit of the reduced model.
Figure 7.
Figure 7.
Mediation model for executive function. Results from the reduced mediation model including only brain markers with significant indirect effects from age to cognition. Solid lines indicate significant paths (P ≤ 0.05, one-tailed), dashed lines indicate nonsignificant paths. Path values indicate standardized beta weights. Italicized values indicate direct (unmediated) paths from age to cognition. Indirect effects operating through each brain marker and the total indirect effect are given below the model. Values in parentheses indicate the 10 000 sample bootstrapped 90% confidence intervals for the indirect effects. All displayed confidence intervals did not include 0; results are truncated at −0.001. R2 indicates the fit of the reduced model.
Figure 8.
Figure 8.
Mediation model for episodic memory. Results from the reduced mediation model including only brain markers with significant indirect effects from age to cognition. Solid lines indicate significant paths (P ≤ 0.05, one-tailed), dashed lines indicate nonsignificant paths. Path values indicate standardized beta weights. Italicized values indicate direct (unmediated) paths from age to cognition. Indirect effects operating through each brain marker and the total indirect effect are given below the model. Values in parentheses indicate the 10 000 sample bootstrapped 90% confidence intervals for the indirect effects. All displayed confidence intervals did not include 0; results are truncated at −0.001. R2 indicates the fit of the reduced model. Hipp = hippocampal; Parahipp = parahippocampal gyrus.

References

    1. Amariglio RE, Becker JA, Carmasin J, Wadsworth LP, Lorius N, Sullivan C, Maye JE, Gidicsin C, Pepin LC, Sperling RA, et al. 2011. Subjective cognitive complaints and amyloid burden in cognitively normal older individuals. Neuropsychologia. 50:2880–2886. - PMC - PubMed
    1. Andrews-Hanna JR, Snyder AZ, Vincent JL, Lustig C, Head D, Raichle ME, Buckner RL. 2007. Disruption of large-scale brain systems in advanced aging. Neuron. 56:924–935. - PMC - PubMed
    1. Becker JA, Hedden T, Carmasin J, Maye J, Rentz DM, Putcha D, Fischl B, Greve DN, Marshall GA, Salloway S, et al. 2011. Amyloid-β associated cortical thinning in clinically normal elderly. Ann Neurol. 69:1032–1042. - PMC - PubMed
    1. Bennett DA, Schneider JA, Arvanitakis Z, Kelly JF, Aggarwal NT, Shah RC, Wilson RS. 2006. Neuropathology of older persons without cognitive impairment from two community-based studies. Neurology. 66:1837–1844. - PubMed
    1. Bennett IJ, Madden DJ. 2013. Disconnected aging: cerebral white matter integrity and age-related differences in cognition. Neuroscience. 276C:187–205. - PMC - PubMed

Publication types

MeSH terms