SRC homology 2 domain-containing leukocyte phosphoprotein of 76 kDa (SLP-76) N-terminal tyrosine residues regulate a dynamic signaling equilibrium involving feedback of proximal T-cell receptor (TCR) signaling
- PMID: 25316710
- PMCID: PMC4288261
- DOI: 10.1074/mcp.M114.037861
SRC homology 2 domain-containing leukocyte phosphoprotein of 76 kDa (SLP-76) N-terminal tyrosine residues regulate a dynamic signaling equilibrium involving feedback of proximal T-cell receptor (TCR) signaling
Abstract
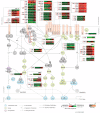
SRC homology 2 domain-containing leukocyte phosphoprotein of 76 kDa (SLP-76) is a cytosolic adaptor protein that plays an important role in the T-cell receptor-mediated T-cell signaling pathway. SLP-76 links proximal receptor stimulation to downstream effectors through interaction with many signaling proteins. Previous studies showed that mutation of three tyrosine residues, Tyr(112), Tyr(128), and Tyr(145), in the N terminus of SLP-76 results in severely impaired phosphorylation and activation of Itk and PLCγ1, which leads to defective calcium mobilization, Erk activation, and NFAT activation. To expand our knowledge of the role of N-terminal phosphorylation of SLP-76 from these three tyrosine sites, we characterized nearly 1000 tyrosine phosphorylation sites via mass spectrometry in SLP-76 reconstituted wild-type cells and SLP-76 mutant cells in which three tyrosine residues were replaced with phenylalanines (Y3F mutant). Mutation of the three N-terminal tyrosine residues of SLP-76 phenocopied SLP-76-deficient cells for the majority of tyrosine phosphorylation sites observed, including feedback on proximal T-cell receptor signaling proteins. Meanwhile, reversed phosphorylation changes were observed on Tyr(192) of Lck when we compared mutants to the complete removal of SLP-76. In addition, N-terminal tyrosine sites of SLP-76 also perturbed phosphorylation of Tyr(440) of Fyn, Tyr(702) of PLCγ1, Tyr(204), Tyr(397), and Tyr(69) of ZAP-70, revealing new modes of regulation on these sites. All these findings confirmed the central role of N-terminal tyrosine sites of SLP-76 in the pathway and also shed light on novel signaling events that are uniquely regulated by SLP-76 N-terminal tyrosine residues.
© 2015 by The American Society for Biochemistry and Molecular Biology, Inc.
Figures


Similar articles
-
Activated Cdc42-associated kinase 1 (ACK1) binds the sterile α motif (SAM) domain of the adaptor SLP-76 and phosphorylates proximal tyrosines.J Biol Chem. 2017 Apr 14;292(15):6281-6290. doi: 10.1074/jbc.M116.759555. Epub 2017 Feb 10. J Biol Chem. 2017. PMID: 28188290 Free PMC article.
-
Quantitative phosphoproteomics reveals SLP-76 dependent regulation of PAG and Src family kinases in T cells.PLoS One. 2012;7(10):e46725. doi: 10.1371/journal.pone.0046725. Epub 2012 Oct 11. PLoS One. 2012. PMID: 23071622 Free PMC article.
-
SH2 domain containing leukocyte phosphoprotein of 76-kDa (SLP-76) feedback regulation of ZAP-70 microclustering.Proc Natl Acad Sci U S A. 2010 Jun 1;107(22):10166-71. doi: 10.1073/pnas.0909112107. Epub 2010 May 13. Proc Natl Acad Sci U S A. 2010. PMID: 20534575 Free PMC article.
-
Keeping the (kinase) party going: SLP-76 and ITK dance to the beat.Sci STKE. 2007 Jul 24;2007(396):pe39. doi: 10.1126/stke.3962007pe39. Sci STKE. 2007. PMID: 17652306 Free PMC article. Review.
-
T cell activation at the immunological synapse: vesicles emerge for LATer signaling.Sci Signal. 2010 May 11;3(121):pe16. doi: 10.1126/scisignal.3121pe16. Sci Signal. 2010. PMID: 20460646 Review.
Cited by
-
A PLC-γ1 Feedback Pathway Regulates Lck Substrate Phosphorylation at the T-Cell Receptor and SLP-76 Complex.J Proteome Res. 2017 Aug 4;16(8):2729-2742. doi: 10.1021/acs.jproteome.6b01026. Epub 2017 Jul 6. J Proteome Res. 2017. PMID: 28644030 Free PMC article.
-
Phosphoproteomics data-driven signalling network inference: Does it work?Comput Struct Biotechnol J. 2022 Dec 15;21:432-443. doi: 10.1016/j.csbj.2022.12.010. eCollection 2023. Comput Struct Biotechnol J. 2022. PMID: 36618990 Free PMC article.
-
Tandem Mass Tag Approach Utilizing Pervanadate BOOST Channels Delivers Deeper Quantitative Characterization of the Tyrosine Phosphoproteome.Mol Cell Proteomics. 2020 Apr;19(4):730-743. doi: 10.1074/mcp.TIR119.001865. Epub 2020 Feb 18. Mol Cell Proteomics. 2020. PMID: 32071147 Free PMC article.
-
Quantitative Phosphoproteomic Analysis of T-Cell Receptor Signaling.Methods Mol Biol. 2017;1584:369-382. doi: 10.1007/978-1-4939-6881-7_22. Methods Mol Biol. 2017. PMID: 28255713 Free PMC article.
-
Lighting Up T Lymphocyte Signaling with Quantitative Phosphoproteomics.Front Immunol. 2017 Aug 9;8:938. doi: 10.3389/fimmu.2017.00938. eCollection 2017. Front Immunol. 2017. PMID: 28848546 Free PMC article. Review.
References
-
- Zamoyska R., Basson A., Filby A., Legname G., Lovatt M., Seddon B. (2003) The influence of the src-family kinases, Lck and Fyn, on T cell differentiation, survival and activation. Immunol. Rev. 191, 107–118 - PubMed
-
- Zhang W., Sloan-Lancaster J., Kitchen J., Trible R. P., Samelson L. E. (1998) LAT: the ZAP-70 tyrosine kinase substrate that links T cell receptor to cellular activation. Cell 92, 83–92 - PubMed
-
- Bubeck Wardenburg J., Fu C., Jackman J. K., Flotow H., Wilkinson S. E., Williams D. H., Johnson R., Kong G., Chan A. C., Findell P. R. (1996) Phosphorylation of SLP-76 by the ZAP-70 protein-tyrosine kinase is required for T-cell receptor function. J. Biol. Chem. 271, 19641–19644 - PubMed
-
- Pivniouk V., Tsitsikov E., Swinton P., Rathbun G., Alt F. W., Geha R. S. (1998) Impaired viability and profound block in thymocyte development in mice lacking the adaptor protein SLP-76. Cell 94, 229–238 - PubMed
-
- Clements J. L., Yang B., Ross-Barta S. E., Eliason S. L., Hrstka R. F., Williamson R. A., Koretzky G. A. (1998) Requirement for the leukocyte-specific adapter protein SLP-76 for normal T cell development. Science 281, 416–419 - PubMed
Publication types
MeSH terms
Substances
Grants and funding
LinkOut - more resources
Full Text Sources
Molecular Biology Databases
Research Materials
Miscellaneous

