

Limitations of using administratively reported immunization data for monitoring routine immunization system performance in Nigeria
- PMID: 25316876
- PMCID: PMC11037521
- DOI: 10.1093/infdis/jiu373
Limitations of using administratively reported immunization data for monitoring routine immunization system performance in Nigeria
Abstract
Background: Efforts are underway to strengthen Nigeria's routine immunization system, yet measuring impact poses a challenge. We document limitations in using administrative data from 12 states in Nigeria and explore alternative approaches.
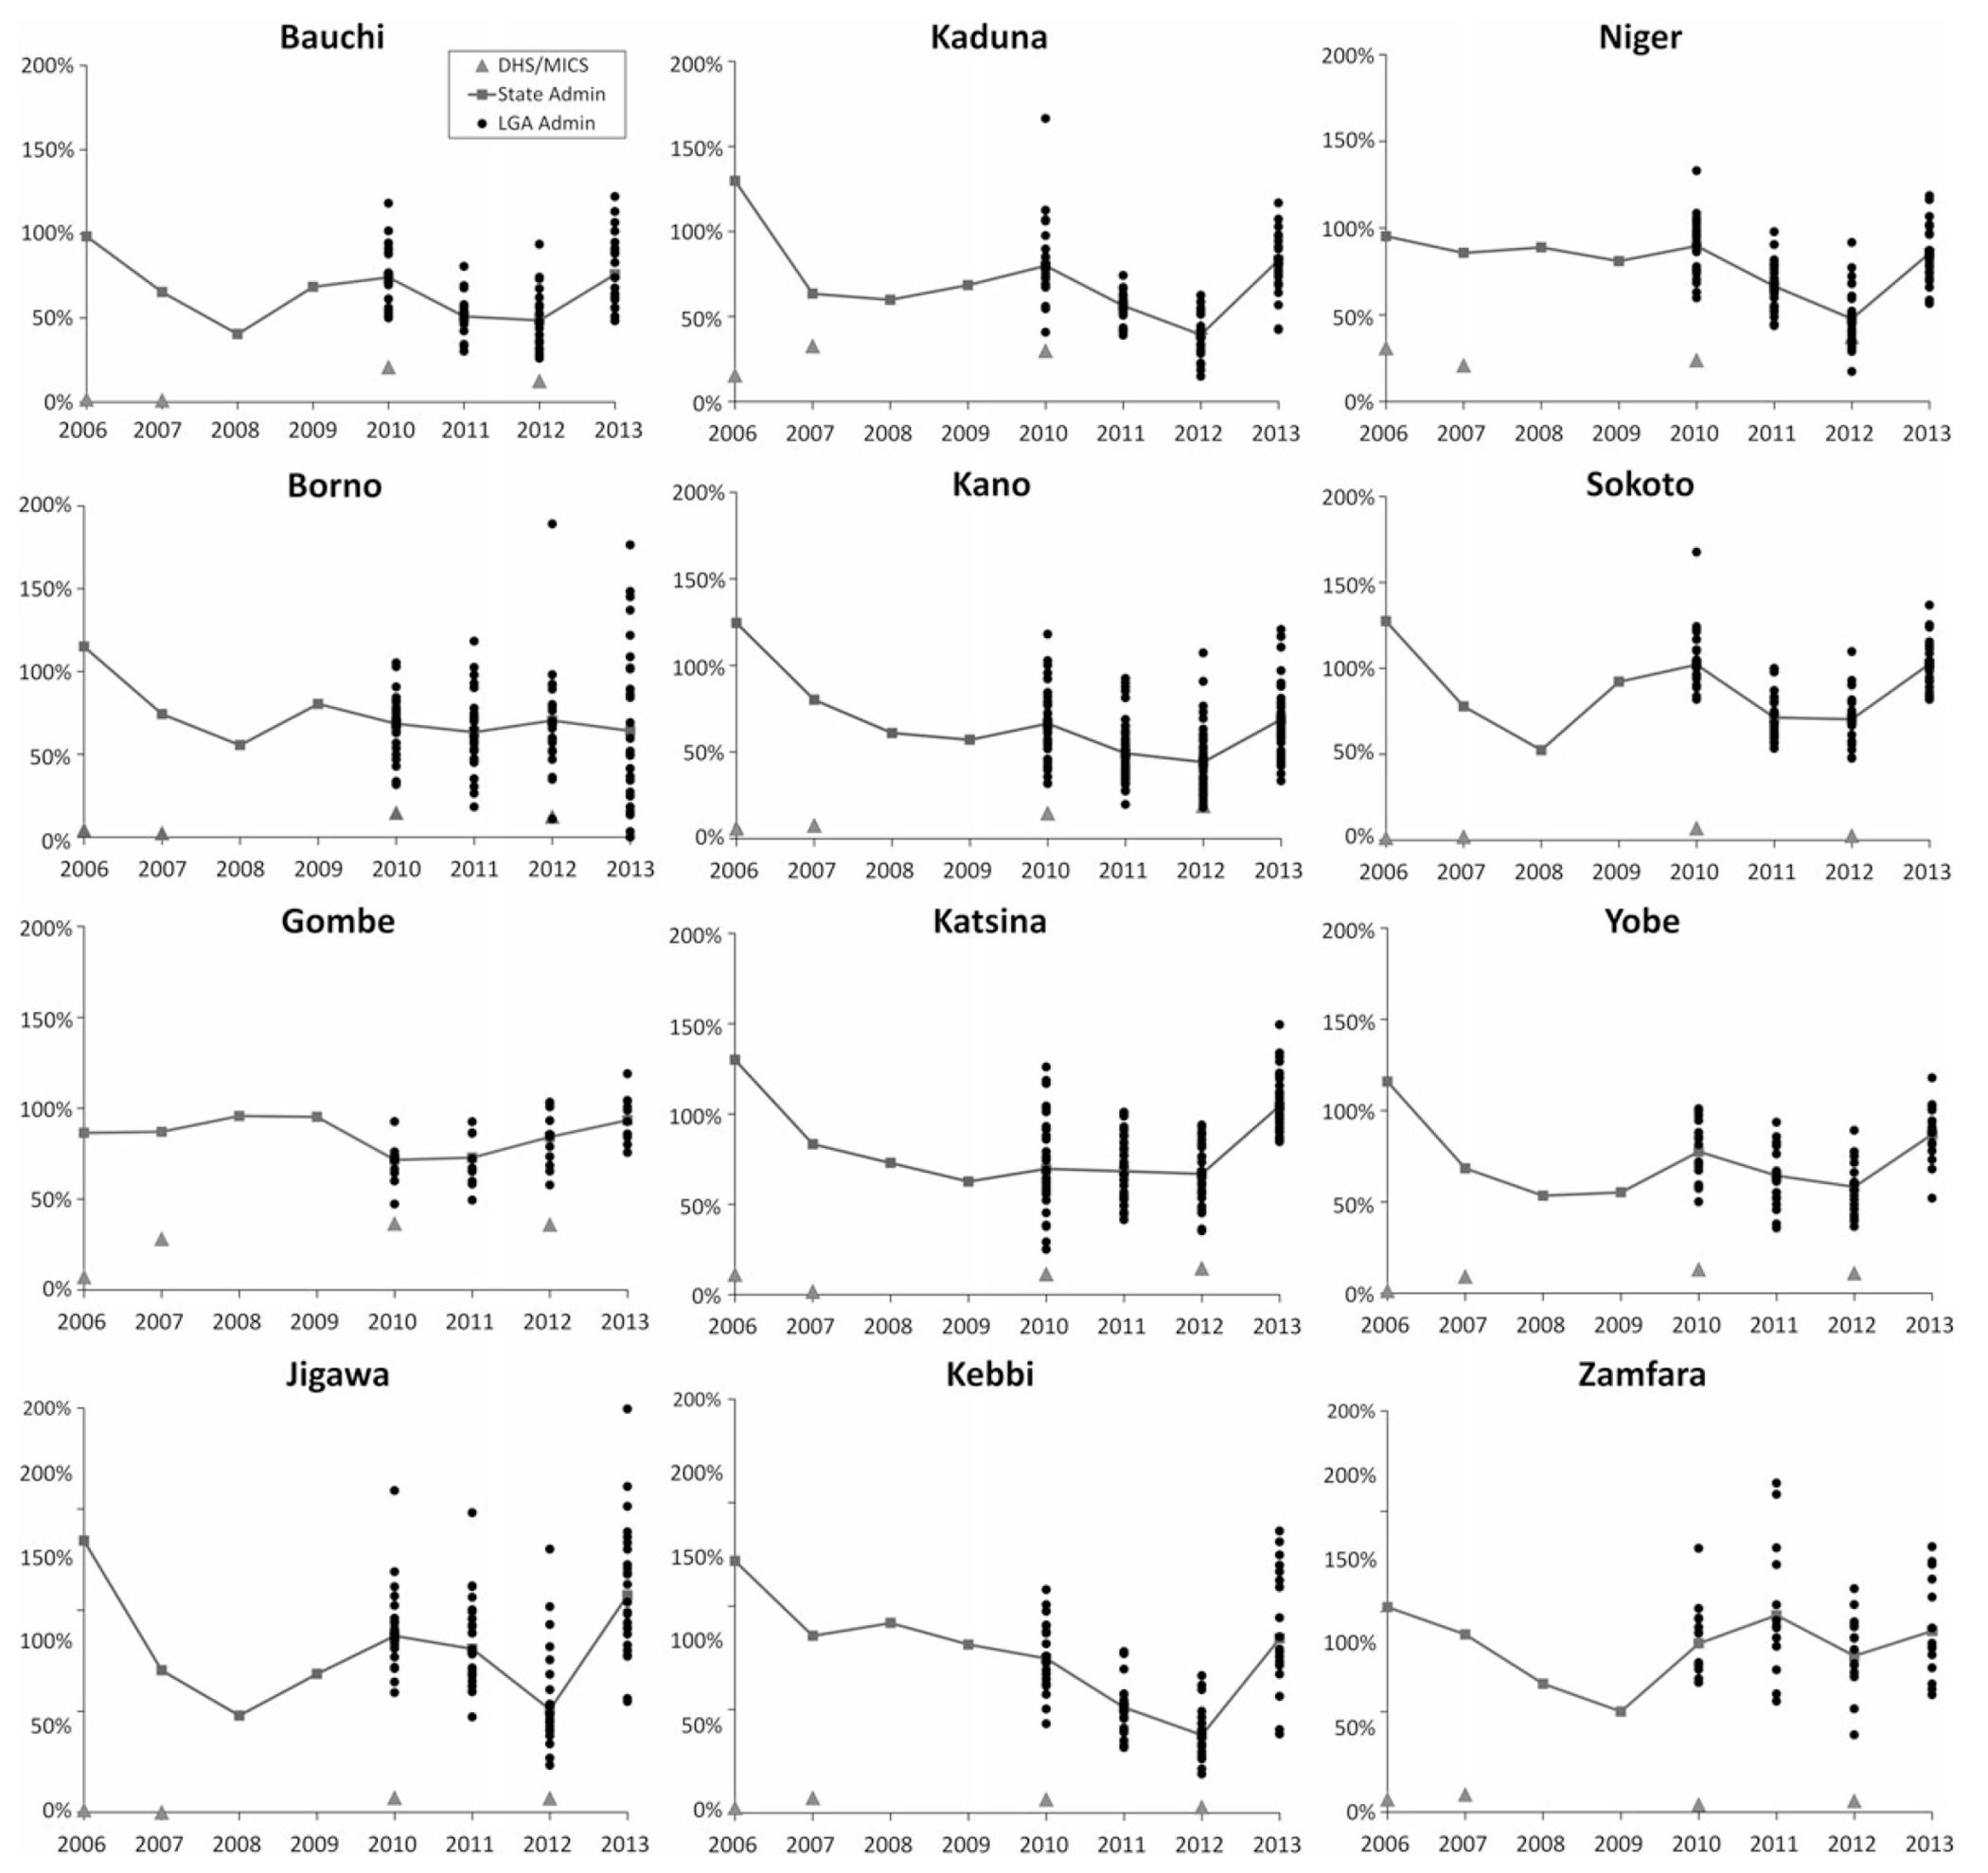
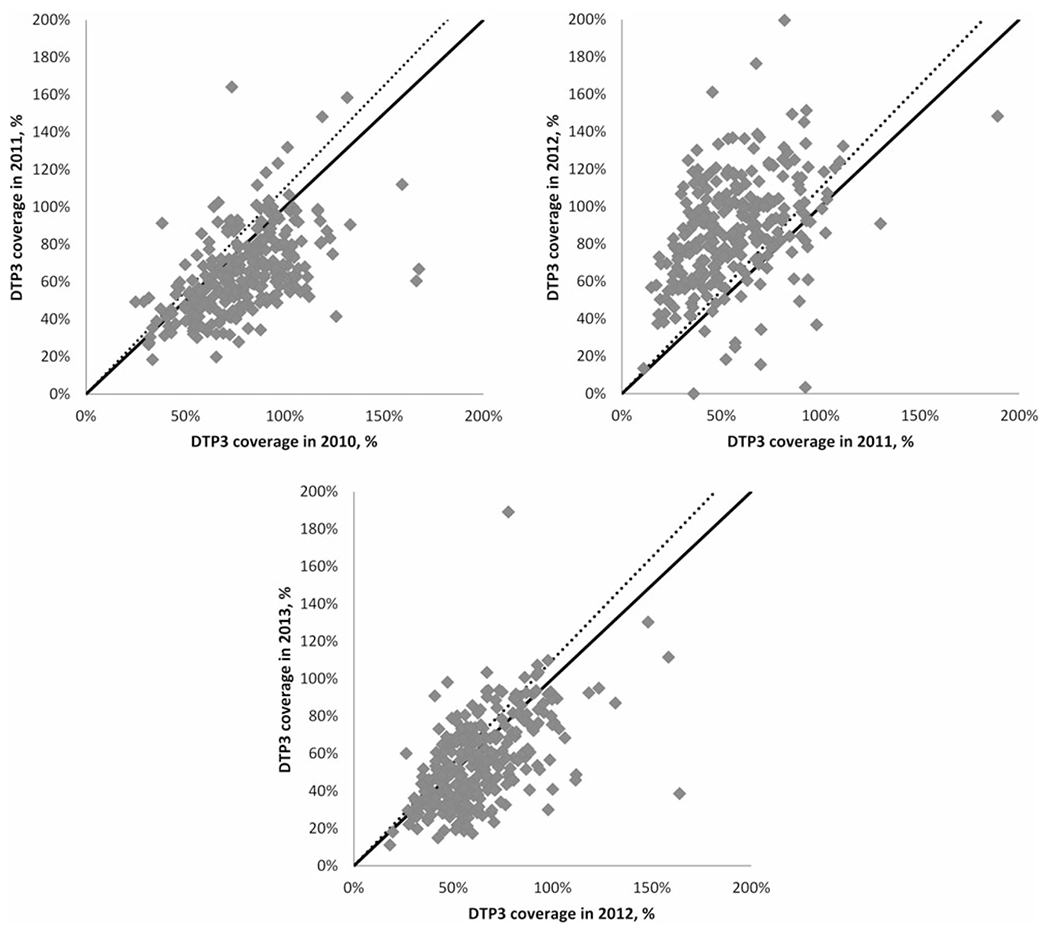
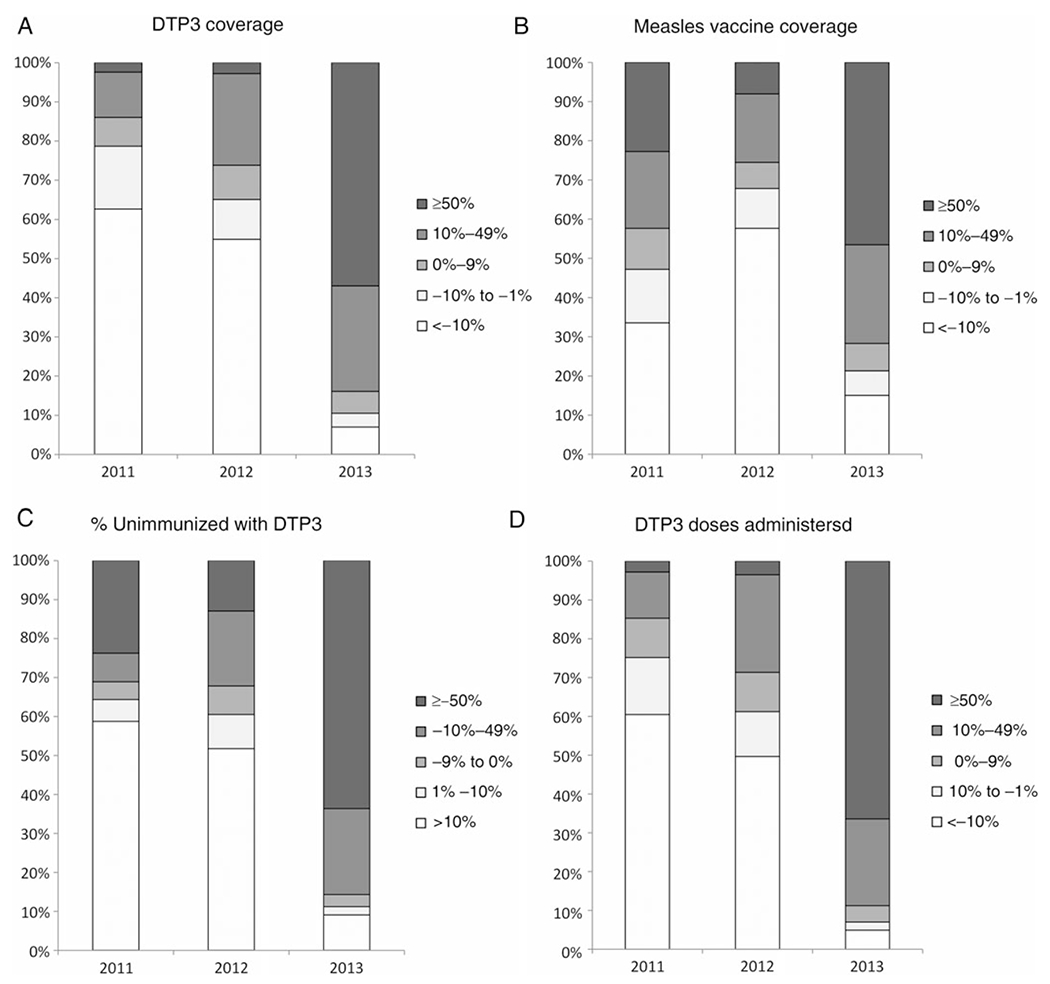
Methods: We compared state-reported coverage with the third dose of diphtheria-tetanus-pertussis vaccine (DTP3) to district-reported coverage and data from coverage surveys conducted during 2006-2013. We used district-reported data during 2010-2013 to calculate the annual change in immunization coverage, the percentage of the target population that was unimmunized, and the number of vaccine doses administered. Data quality indicators were also assessed.
Results: State-reported DTP3 coverage was 66%-102% in 2010, 49%-98% in 2011, 38%-84% in 2012, and 75%-123% in 2013 and was a median 46%-114% greater than survey coverage during 2006-2013. The mean local government area (LGA)-reported coverage varied substantially (standard deviation range, 10%-33% across years). For 2010-2013, the mean annual percentage change in LGA-reported DTP3 coverage was -15% from 2010 to 2011, -9% from 2011 to 2012, and 74% from 2012 to 2013; the mean annual percentage change in the percentage of the target population unimmunized was -62%, 426%, and -62%, respectively; and the mean annual percentage change in the number of doses administered was -13%, -7%, and 90%, respectively. Annually, a mean 14% of LGAs reported DTP3 coverage of >100%.
Discussion: Assessing immunization system performance by using administrative data has notable limitations. In addition to long-term improvements in administrative data management, alternatives for measuring routine immunization performance should be considered.
Keywords: DTP3; Nigeria; immunization coverage; immunization programs; poliomyelitis; program improvement; routine immunization; system monitoring.
Published by Oxford University Press on behalf of the Infectious Diseases Society of America 2014. This work is written by (a) US Government employee(s) and is in the public domain in the US.
Conflict of interest statement
All authors have submitted the ICMJE Form for Disclosure of Potential Conflicts of Interest. Conflicts that the editors consider relevant to the content of the manuscript have been disclosed.
Figures
References
-
- National Primary Health Care Development Agency. 2013 Nigeria Polio Eradication Emergency Plan. http://www.polioeradication.org/Portals/0/Document/Aboutus/Governance/IM.... Accessed 6 March 2014.
-
- Global Polio Eradication Initiative. Global Polio Eradication Initiative Emergency Action Plan 2012–2013. http://www.polioeradication.org/Portals/0/Document/Resources/StrategyWor.... Accessed 6 March 2014.
-
- National Bureau of Statistics. Nigeria Multiple Indicator Cluster Survey 2007 final report. http://www.childinfo.org/files/MICS3_Nigeria_FinalReport_2007_Eng.pdf. Accessed 6 March 2014.
-
- National Population Commission. Nigeria Demographic and Health Survey 2008. http://www.unicef.org/nigeria/ng_publications_Nigeria_DHS_2008_Final_Rep.... Accessed 6 March 2014.
-
- National Bureau ofStatistics. Nigeria Multiple Indicator Cluster Survey 2011 main report. http://www.childinfo.org/files/MICS4_Nigeria_FinalReport_2011_Eng.pdf. Accessed 6 March 2014.
Publication types
MeSH terms
Substances
Grants and funding
LinkOut - more resources
Full Text Sources
Other Literature Sources
Medical
