. 2015 Jan 1;517(7532):77-80.
doi: 10.1038/nature13805. Epub 2014 Oct 15.

Origins of major archaeal clades correspond to gene acquisitions from bacteria

Affiliations

Origins of major archaeal clades correspond to gene acquisitions from bacteria

Shijulal Nelson-Sathi et al. Nature. .

Abstract

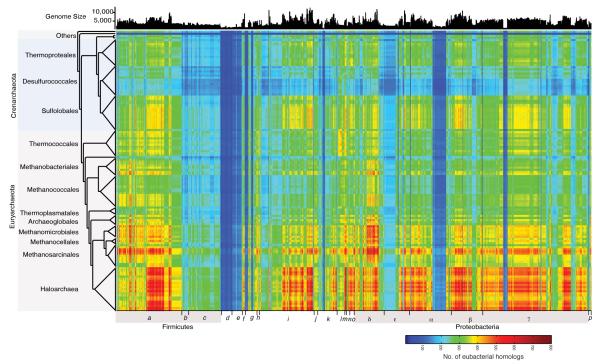
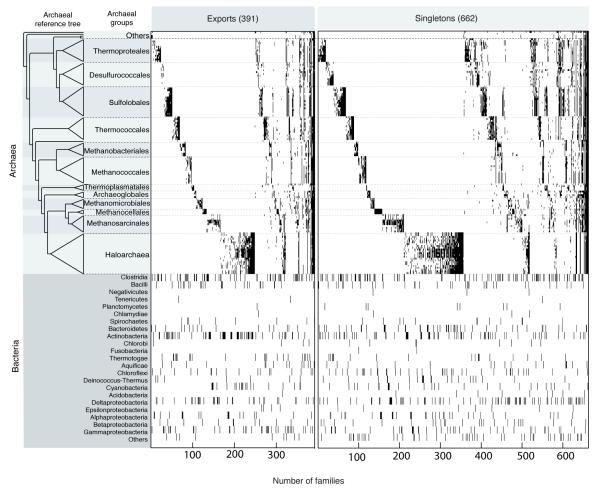
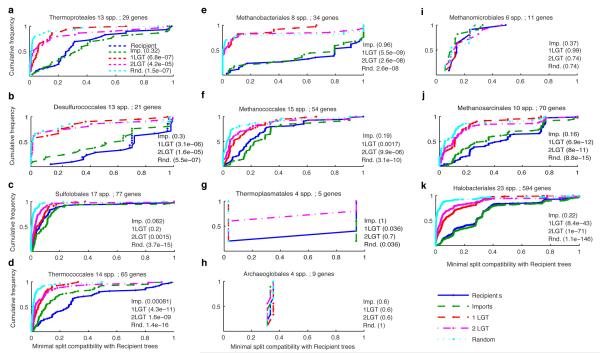
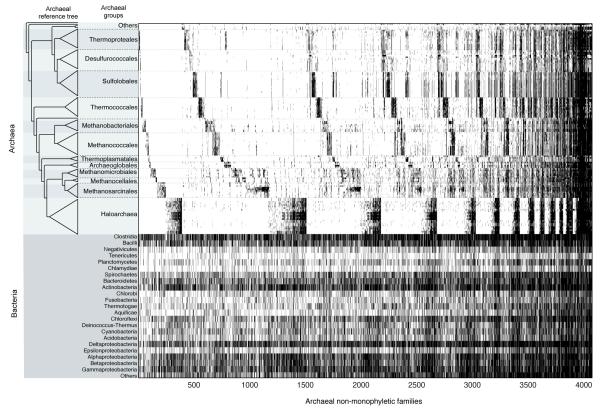
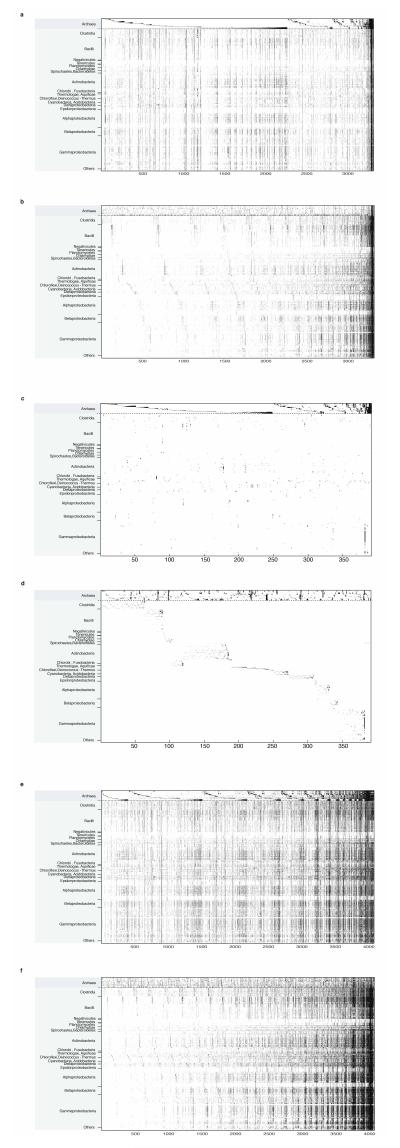
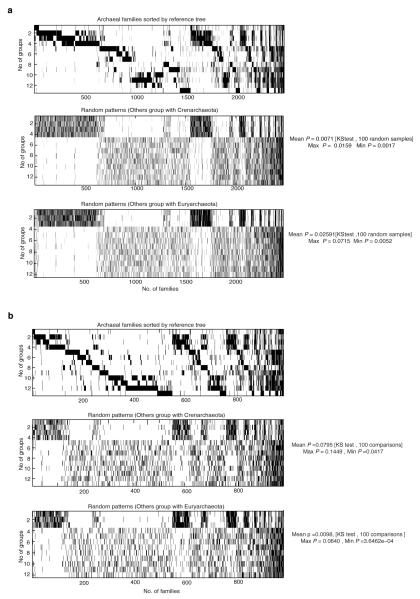
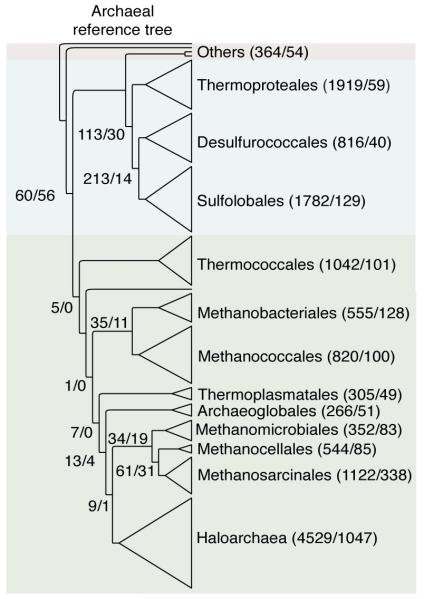
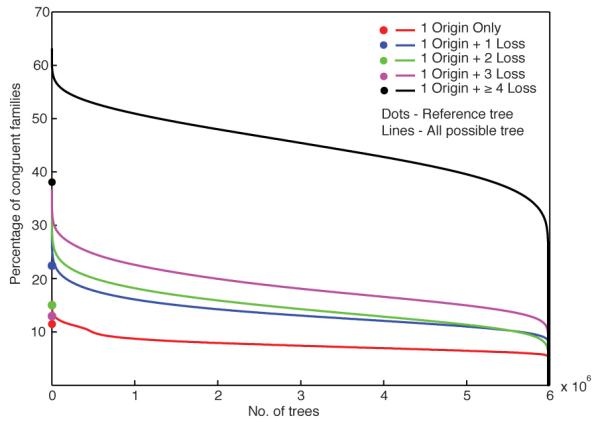
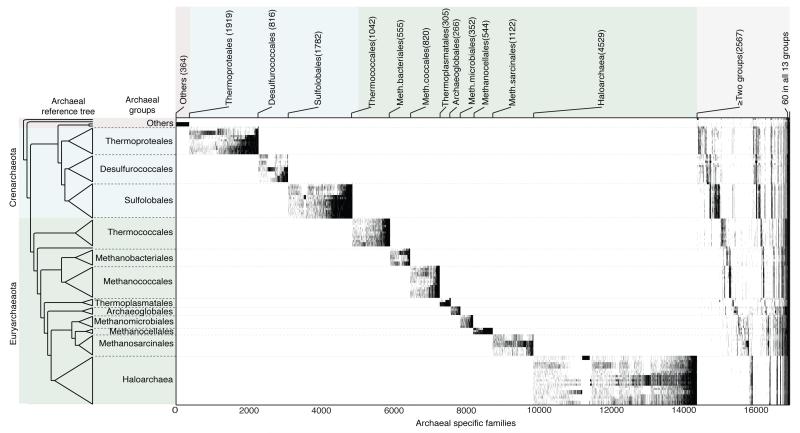
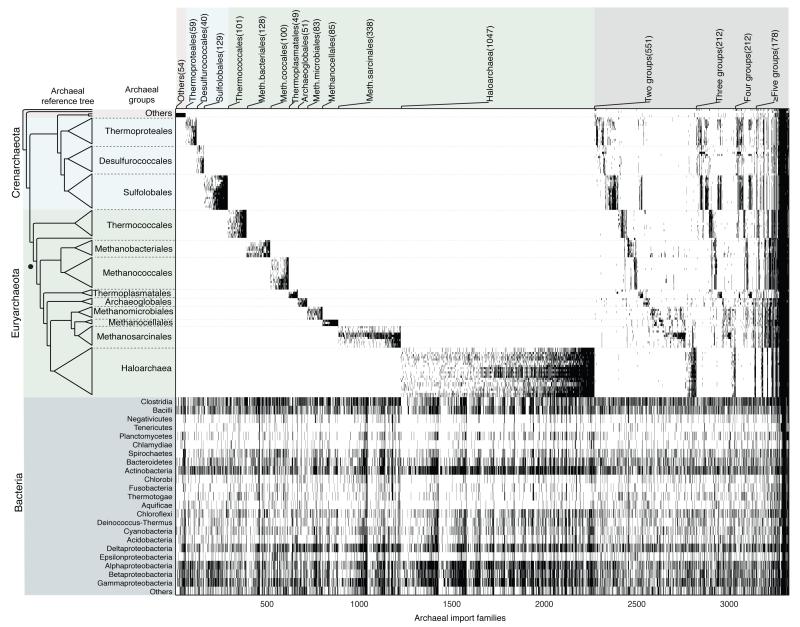
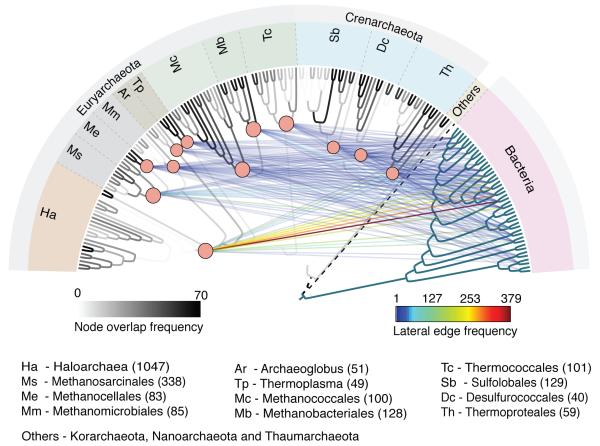
The mechanisms that underlie the origin of major prokaryotic groups are poorly understood. In principle, the origin of both species and higher taxa among prokaryotes should entail similar mechanisms--ecological interactions with the environment paired with natural genetic variation involving lineage-specific gene innovations and lineage-specific gene acquisitions. To investigate the origin of higher taxa in archaea, we have determined gene distributions and gene phylogenies for the 267,568 protein-coding genes of 134 sequenced archaeal genomes in the context of their homologues from 1,847 reference bacterial genomes. Archaeal-specific gene families define 13 traditionally recognized archaeal higher taxa in our sample. Here we report that the origins of these 13 groups unexpectedly correspond to 2,264 group-specific gene acquisitions from bacteria. Interdomain gene transfer is highly asymmetric, transfers from bacteria to archaea are more than fivefold more frequent than vice versa. Gene transfers identified at major evolutionary transitions among prokaryotes specifically implicate gene acquisitions for metabolic functions from bacteria as key innovations in the origin of higher archaeal taxa.


Figures

Extended Data Figure 1
Extended Data Figure 1. Inter-domain gene sharing network
Each cell in the matrix indicates the number of genes (e-value ≤10−10 and ≥25% global identity) shared between 134 archaeal and 1,847 bacterial genomes in each pairwise inter-domain comparison (scale bar at lower right). Archaeal genomes are listed as in Fig. 1. Bacterial genomes are presented in 23 groups corresponding to phylum or class in the Genbank nomenclature: a = Clostridia; b = Erysipelotrichi, Negativicutes; c = Bacilli; d = Firmicutes; e = Chlamydia; f = Verrucomicrobia, Planctomycete; g = Spirochaete; h = Gemmatimonadetes, Synergisteles, Elusimicrobia, Dyctyoglomi, Nitrospirae; i = Actinobacteria; j = Fibrobacter, Chlorobi; k = Bacteroidetes; l = Fusobacteria; Thermatogae, Aquificae, Chloroflexi; m = Deinococcus-Thermus; n = Cyanobacteria; o = Acidobacteria; δ,ε,α,β,γ = Delta, Epsilon, Alpha, Beta and Gamma proteobacteria; p = Thermosulfurobateria, Caldiserica, Chysiogenete, Ignavibacteria. Bacterial genome size in number of proteins is indicated at top.
Extended Data Figure 2
Extended Data Figure 2. Presence absence patterns of archaeal genes with sparse distribution among bacteria sampled
Archaeal export families are sorted according to the reference tree on the left. The figure shows the 391 cases of archaea to bacteria export (≥2 archaea and ≥2 bacteria from one phylum only), 662 cases of bacterial singleton trees (≥3 archaea, one bacterium). The 25,762 clusters were classified into the following categories (Supplementary Table 2): 16,983 archaeal specific, 3,315 imports, 391 exports, 662 cases of bacterial singletons with ≥3 archaea in the tree, 308 cases with three sequences (a bacterial singleton and 2 archaea) in the cluster, 4,074 trees in which archaea were non-monophyletic, and 29 ambiguous cases among trees showing archaeal monophyly. The bacterial taxonomic distribution shown in the lower panel. Gene identifiers and trees are given in Supplemental Table 3.
Extended Data Figure 3
Comparison of sets of trees for single-copy genes in 11 archaeal groups. Cumulative distribution functions for scores of tree compatibility with the recipient dataset. Values are P-values of the two-sided Kolmogorov–Smirnov two-sample goodness-of-fit in the comparison of the Recipient (blue) datasets against the Imports (green) dataset and three synthetic datasets, One-LGT (red), Two-LGT (pink) and Random (cyan). a, Thermoproteales b, Desulfurococcales c, Sulfolobales, d, Thermococcales e, Methanobacteriales f, Methanococcales g, Thermoplasmatales h, Archaeoglobales i, Methanococcales j, Methanosarcinales k, Halobacteriales.
Extended Data Figure 4
Extended Data Figure 4. Presence absence patterns of all archaeal non-monophyletic genes
Archaeal families that did not generate monophyly for archaeal sequences in ML trees are plotted according the reference tree on left, the distribution across bacterial genomes groups is shown in the lower panel. These trees include 693 cases in which archaea showed non-monophyly by the misplacement of a single archaeal branch. Gene identifiers and trees are given in Supplemental Table 4-5.
Extended Data Figure 5
Extended Data Figure 5. Sorting by bacterial presence absence patterns for archaeal imports, exports and archaeal non-monophyletic families
Archaeal families and their homologue distribution in 1,847 bacterial genomes are sorted by archaeal (top) and bacterial (bottom) gene distributions for direct comparison. Distributions of archaeal imports sorted by archaeal groups (a) and by bacterial groups (b); distributions of archaeal exports sorted by archaeal groups (c) and by bacterial groups (d); distributions of archaeal non-monophyletic gene families sorted by archaeal groups (e) and by bacterial groups (f).
Extended Data Figure 6
Extended Data Figure 6. Testing for evidence of higher order archaeal relationships using a permutation tail probability (PTP) test
Comparison of pairwise Euclidian distance distributions between archaeal real and conditional random gene family patterns. a, Archaeal specific families: Distribution of 2,471 archaeal specific families present in at least 2 and less than 11 groups (top), Comparison between real data and conditional random patterns generated by shuffling the entries within Crenarchaeota and Euryarchaeota separately, Comparison between real data and conditional random patterns generated by including Nanoarchaea and Thaumarchaea into Crenarchaeota (middle) or into Euryarchaeota (bottom). b, Archaeal import families: Distribution of 989 archaeal import families present in at least 2 and less than 11 groups (top). Comparison between real data and conditional random patterns generated by shuffling the entries within Crenarchaeota and Euryarchaeota separately by including Nanoarchaea and Thaumarchaea into Crenarchaeota (middle), iii) Comparison between real data and random patterns generated by including Nanoarchaea and Thaumarchaea into Euryarchaeota (bottom).
Extended Data Figure 7
Extended Data Figure 7. Archaeal specific and import gene counts on a reference tree
Number of archaeal specific and import families corresponding to each node in the reference tree are shown in the order of ‘specific/imports’. Numbers at internal nodes indicate the number of archaeal-specific families and families with bacterial homologues that correspond to the reference tree topology. Values at the left indicate the number of archaeal-specific families and families with bacterial homologues that are present in all archaeal groups.
Extended Data Figure 8
Extended Data Figure 8. Non tree-like structure of archaeal protein families
Proportion of archaeal families whose distributions are congruent with the reference tree and with all possible trees. Filled circles indicate the proportion of archaeal families that are congruent to the reference tree allowing no losses (with a single origin) and different increments of losses allowed. Red, blue, green, magenta and black circles represent the proportion of families that can be explained using a single origin (849, 11.5%), single origin + 1 loss (22.4%), single origin + 2 losses (15%), single origin + 3 losses (13%) and single origin + ≥ 4 losses (38%) respectively. Lines indicate the proportion of families that can be explained by each of the 60,81,075 possible trees that preserve euryarchaeote and crenarchaeote monophyly. Note that on average, any given tree can explain 569 (8%) of the archaeal families using a single origin event in the tree, and the best tree can explain only 1,180 families (16%). In the present data, 208,019 trees explain the gene distributions better than the archaeal reference tree without loss events, underscoring the discordance between core gene phylogeny and gene distributions in the remainder of the genome.
Figure 1
Figure 1. Distribution of genes in archaea-specific families
Maximum-likelihood (ML) trees were generated for 16,983 archaea-specific clusters. Ticks indicate presence (black) or absence (white) of genes in genomes within groups indicated on the left. The number of trees containing taxa specific to each group is indicated at top. To generate clusters, 134 archaeal and 1,847 bacterial genomes were downloaded from the NCBI website [www.ncbi.nlm.hih.gov, version June 2012]. An all-against-all BLAST26 of archaeal proteins yielded 11,372,438 reciprocal best BLAST hits (rBBH) having an e-value <10−10 and ≥25% local amino acid identity. These protein pairs were globally aligned using the Needleman-Wunsch algorithm resulting in a total of 10,382,314 protein pairs (267,568 proteins, 86.6%). These 267,568 proteins were clustered into 25,762 families using the standard Markov Chain clustering procedure. There were 41,560 archaeal proteins (13.4% of the total) that did not have archaeal homologs, these were classified as singletons and excluded from further analysis. The 23 bacterial groups were defined using phylum names except for Firmicutes and Proteobacteria. All 25,752 archaeal protein families were aligned using MAFFT (version v6.864b). Archaeal specific gene families were defined as those that lack bacterial homologs at the e-value <10−10 and ≥25% global amino acid identity threshold. For those archaeal clusters having hits in multiple bacterial strains of a species, only the most similar sequence among the strains was considered for the alignment. Maximum likelihood trees were reconstructed using RAxML program for all cases where the alignment had four or more protein sequences. Archaeal species, named in order, are given in Supplementary Table 1. Clusters, including gene identifiers and corresponding COG functional annotations, are given in Supplementary Table 2. The unrooted reference tree at left was constructed as described in Fig. 2.
Figure 2
Figure 2. Bacterial gene acquisitions in archaeal genomes
Upper panel ticks indicate gene presence in the 3,315 ML trees in which archaea are monophyletic. Archaeal genomes listed as in Fig. 1. The lower panel shows the occurrence of homologs among bacterial groups. Gene identifiers including functional annotations are given in Supplementary Table 2. The number of trees containing taxa specific to each archaeal group (or groups) is indicated at top. The Methanopyrus kandleri branch (dot) subtends all methanogens in the tree. The 56 genes at right occur in all 13 groups and were likely present in the prokaryote common ancestor. Bacterial homologs of archaeal protein families were identified as described in Figure 1 (rBBH and ≥25% global identity), yielding 8,779 archaeal families having one or more bacterial homologs. An archaeal reference tree was constructed from a weighted concatenation alignment of 70 archaeal single copy genes using RAxML. The 70 genes used to construct the unrooted reference tree are rpsJ, rpsK, rps15p, rpsQ, rps19e, rpsB, rps28e, rpsD, rps4e, rpsE, rps7, rpsH, rpl, rpl15, rpsC, rplP, rpl18p, rplR, rplK, rplU, rl22, rpl24, rplW, rpl30P, rplC, rpl4lp, rplE, rpl7ae, rplB, rpsM, rpsH, rplF, rpsS, rpsI, rimM, gsp-3, rli, rpoE, rpoA, rpoB, dnaG, recA, drg, yyaF, gcp, hisS, map, metG, trm, pheS, pheT, rio1, ansA, flpA, gate, glyS, rplA, infB, arf1, pth, SecY, proS, rnhB, rfcL, rnz, cca, eif2A, eif5a, eif2G, valS.
Figure 3
Figure 3. Archaeal gene acquisition network
Vertical edges represent the archaeal reference phylogeny in Fig. 1 based on 70 concatenated genes, gray shading indicates how often the branch was recovered by the 70 genes analyzed individually. The vertical edge weight of each branch in the reference tree (scale bar at left) was calculated as the number of times associated node was present within the single gene trees (see Source Data). Lateral edges indicate 2,264 bacterial acquisitions in archaea. The number of acquisitions per group is indicated in parentheses, the number of times the bacterial taxon appeared within the inferred donor clade is color coded (scale bar at right). The strongest lateral edge links Haloarchaea with Actinobacteria. Archaea were arbitrarily rooted on the Korarchaeota branch (dotted line). Bacterial taxon labels are (from left to right) Chlorobi, Bacteroidetes, Acidobacteria, Chlamydiae, Planctomycetes, Spirochaetes, ε-Proteobacteria, δ-Proteobacteria, β-Proteobacteria, γ-Proteobacteria, α-Proteobacteria, Actinobacteria, Bacilli, Tenericutes, Negativicutes, Clostridia, Cyanobacteria, Chloroflexi, Deinococcus-Thermococcus, Fusobacteria, Aquificae, Thermotogae. The order of archaeal genomes (from left to right) is as in Fig. 1 (from bottom to top).

Comment in

References

    1. Doolittle WF, Papke RT. Genomics and the bacterial species problem. Genome Biol. 2006;7:116. - PMC - PubMed
    1. Retchless AC, Lawrence JG. Temporal fragmentation of speciation in Bacteria. Science. 2007;317:1093–1096. - PubMed
    1. Achtmann M, Wagner M. Microbial diversity and the genetic nature of microbial species. Nat. Rev. Microbiol. 2008;6:431–440. - PubMed
    1. Fraser C, Alm EJ, Polz MF, Spratt BG, Hanage WP. The bacterial species challenge: making sense of genetic and ecological diversity. Science. 2009;323:741–746. - PubMed
    1. Puigbo P, Wolf YI, Koonin EV. The tree and net components of prokaryote genome evolution. Genome Biol. Evol. 2010;2:745–756. - PMC - PubMed

Publication types

Substances