. 2015 Jun;52(6):683-94.
doi: 10.1165/rcmb.2014-0250OC.

Defective innate immunity and hyperinflammation in newborn cystic fibrosis transmembrane conductance regulator-knockout ferret lungs

Affiliations

Defective innate immunity and hyperinflammation in newborn cystic fibrosis transmembrane conductance regulator-knockout ferret lungs

Nicholas W Keiser et al. Am J Respir Cell Mol Biol. 2015 Jun.

Abstract

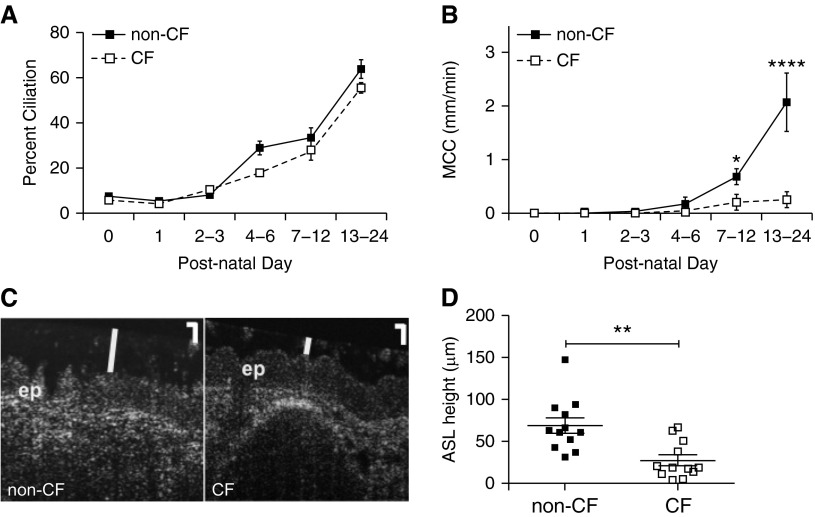
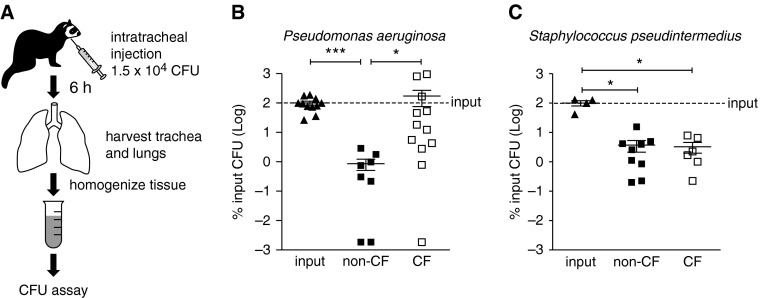
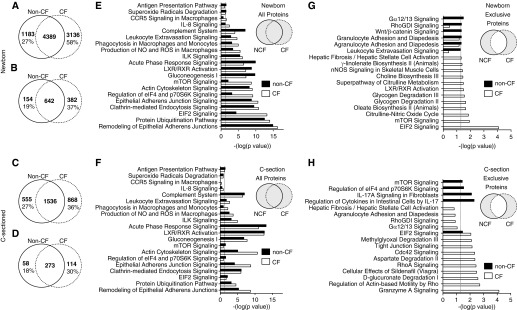
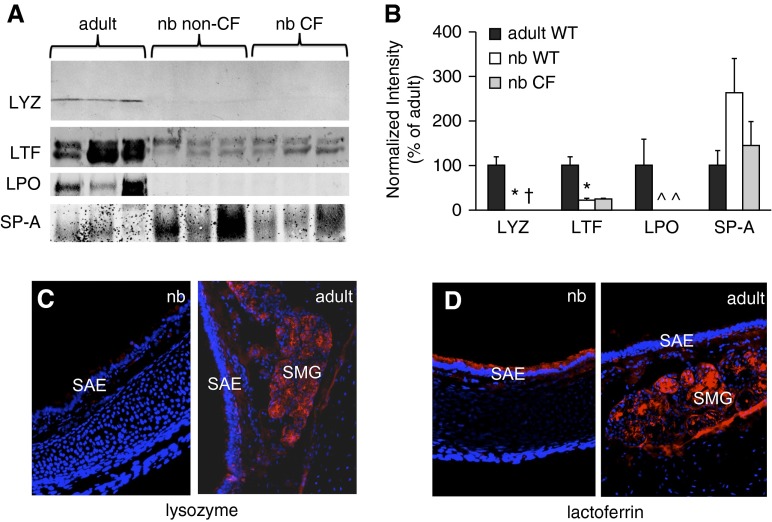
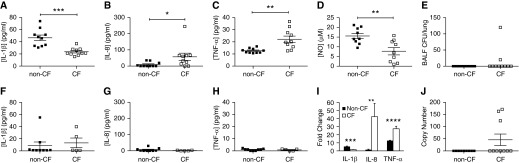
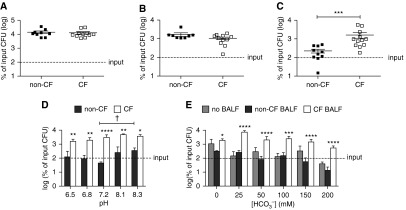
Mucociliary clearance (MCC) and submucosal glands are major components of airway innate immunity that have impaired function in cystic fibrosis (CF). Although both of these defense systems develop postnatally in the ferret, the lungs of newborn ferrets remain sterile in the presence of a functioning cystic fibrosis transmembrane conductance regulator gene. We evaluated several components of airway innate immunity and inflammation in the early CF ferret lung. At birth, the rates of MCC did not differ between CF and non-CF animals, but the height of the airway surface liquid was significantly reduced in CF newborn ferrets. CF ferrets had impaired MCC after 7 days of age, despite normal rates of ciliogenesis. Only non-CF ferrets eradicated Pseudomonas directly introduced into the lung after birth, whereas both genotypes could eradicate Staphylococcus. CF bronchoalveolar lavage fluid (BALF) had significantly lower antimicrobial activity selectively against Pseudomonas than non-CF BALF, which was insensitive to changes in pH and bicarbonate. Liquid chromatography-tandem mass spectrometry and cytokine analysis of BALF from sterile Caesarean-sectioned and nonsterile naturally born animals demonstrated CF-associated disturbances in IL-8, TNF-α, and IL-β, and pathways that control immunity and inflammation, including the complement system, macrophage functions, mammalian target of rapamycin signaling, and eukaryotic initiation factor 2 signaling. Interestingly, during the birth transition, IL-8 was selectively induced in CF BALF, despite no genotypic difference in bacterial load shortly after birth. These results suggest that newborn CF ferrets have defects in both innate immunity and inflammatory signaling that may be important in the early onset and progression of lung disease in these animals.

Keywords: animal model; cystic fibrosis; cystic fibrosis transmembrane conductance regulator; inflammation; innate immunity.


Figures

Figure 1.
Figure 1.
Properties of the developing cystic fibrosis (CF) and non-CF ferret trachea. (A) Ciliogenesis in neonatal ferrets. Sections of non-CF and CF ferret tracheas at different developmental stages were stained for acetylated tubulin to mark cilia, and the percentage of the epithelial surface that was ciliated was determined by fluorescence microscopy. The percentage of the tracheal epithelial surface covered by cilia was calculated for each age group as described. The number of animals in each age group was as follows: Day 0, non-CF = 11, CF = 9; Day 1, non-CF = 9, CF = 14; Days 2–3, non-CF = 7, CF = 4; Days 4–6, non-CF = 3, CF = 3; Days 7–12, non-CF = 5, CF = 5, Days 13–24, non-CF = 5, CF = 4. (B) Tracheal mucociliary clearance (MCC) rates during differentiation. MCC was measured in non-CF and age-matched CF tracheas ex vivo by imaging the movement of fluorescent beads. Animals were divided into groups by age as in (A), and the average MCC rates for animals in each group were calculated. The number of animals in each age group was as follows: Day 0, non-CF = 10, CF = 10; Day 1, non-CF = 10, CF = 10; Days 2–3, non-CF = 3, CF = 4; Days 4–6, non-CF = 3, CF = 3; Days 7–12, non-CF = 10, CF = 10; Days 13–24, non-CF = 5, CF = 7. Error bars represent SEM. *P < 0.05, ****P < 0.0001 by Bonferroni’s multiple comparison post test. (C and D) Airway surface liquid (ASL) height is reduced in newborn CF ferret tracheas. Tracheas from non-CF and CF newborn kits were placed on Dulbecco’s modified Eagle medium–soaked Gelfoam in a humid chamber and allowed to equilibrate for 30 minutes. Microresolution spectral domain optical coherence tomography (μOCT) imaging was then performed in the longitudinal direction, and the height of the ASL in the tracheal lumen was measured. (C) Representative μOCT images from non-CF and CF tracheas, depicting the epithelial layer (ep) and ASL height (white vertical line). Scale bars in the upper right corner, 20 μm. (D) Plot of ASL height in non-CF and CF newborn tracheas. Error bars represent SEM. **P = 0.0014 by Mann-Whitney U test; n = 12 independent tracheas for each genotype.
Figure 2.
Figure 2.
CF newborn ferret lungs fail to irradiate Pseudomonas aeruginosa. (A) Schematic of bacterial challenge assays. Newborn non-CF and CF kits (6–24 h old) were challenged via intratracheal injection with 1.5 × 10⁴ CFU of ampicillin-resistant P. aeruginosa (PA01) or erythromycin-resistant Staphylococcus pseudintermedius into the airways for 6 hours. The lung and tracheal tissue was then harvested and homogenized. The total number of CFU was determined by plating serial dilutions of lung homogenate on Luria-Bertani agar plates containing the appropriate antibiotic and counting colonies the next day. (B and C) Plot of results of in vivo bacterial challenge after intratracheal injection. For each experiment, input CFU was determined as well to control for variation on different days, and the total lung CFU was calculated as a percentage of the input CFU. Average input CFU (100%) is denoted with a line on each graph. Error bars represent SEM. *P < 0.05, ***P < 0.001, using the nonparametric Kruskal-Wallis test with Dunn’s multiple comparison post test. (B) n = 8 non-CF, 12 CF animals; (C) n = 9 non-CF, 6 CF animals.
Figure 3.
Figure 3.
Proteomics and pathway analysis of newborn and Caesarean-sectioned (C-sectioned) ferret bronchoalveolar lavage fluid (BALF). Liquid chromatography–tandem mass spectrometry (LC-MS/MS) was performed on strong cation exchange fractions of newborn (A, B, E, and G) or C-sectioned (C, D, F, and H) non-CF and CF BALF. Peptides and proteins were identified using Mascot, and the results of three separate runs on pooled samples from three animals of each genotype (n = 9 non-CF animals; n = 9 CF animals in total) were compiled in Scaffold software. (AD) Venn diagrams summarize total number of exclusive and nonexclusive peptides (A and C) and proteins (B and D) in each genotype. The bolded numbers in each Venn diagram are the number of peptides or proteins identified in each category. The percent values given in the Venn diagrams represent the percentage of unique peptides or proteins observed within a given genotype. (EH) Lists of proteins from each genotype were subjected to Integrated Pathway Analysis (Qiagen) for canonical pathways, using (E and F) all proteins found in each genotype and (G and H) proteins exclusively identified in only one genotype. The schematic insert in each panel denotes the protein groups interrogated. Positive pathway identification was set at a threshold of P < 0.05 (depicted by the dashed line in EH; Fisher’s exact test). The results from selected pathways graphed against −log(P value) are shown. The data used to generate E and G, and F and H can be found in Tables E2B and E2C and Tables E3B and E3C, respectively. CCR5, chemokine (C-C motif) receptor 5; Cdc42, cell division control protein 42; eIF2, eukaryotic initiation factor 2; ILK, integrin-linked kinase; LXR, liver X receptor; mTOR, mammalian target of rapamycin; NCF, non-CF; nNOS, nitric oxide synthase 1; NO, nitric oxide; ROS, reactive oxygen species; RXR, retinoid X receptor.
Figure 4.
Figure 4.
Immunoblot and immunofluorescence analysis of BALF antimicrobial proteins. (A) Western blotting demonstrating the expression of BALF components in adult non-CF, newborn non-CF, and newborn CF BALF animals. Samples were collected, and 15 μg of total BALF protein from three animals per group was separated using SDS-PAGE. Antibodies used in Western blotting were against the following: lysozyme (LYZ), lactoferrin (LTF), lactoperoxidase (LPO), and pulmonary surfactant-associated protein (SP)-A. Shown are images of several representative Western blot experiments. (B) Quantification of immunoblotting data. Densitometry was performed on bands for each protein using Metamorph software. Values were normalized to the average value for the adult samples (set at 100%). Owing to lack of normality, these values were rank transformed before analysis by one-way ANOVA, and the Bonferroni correction was applied for pairwise comparisons (SPSS version 18; SPSS, Chicago, IL). Error bars represent SEM. Significant differences between adult and newborn level are marked as: *P < 0.05, P < 0.01, ^P < 0.001. (C and D) Localization of lysozyme (C) and lactoferrin (D) in the ferret trachea. Cyrosections of non-CF newborn and adult ferret trachea were stained by immunofluorescence (red), and images were captured using a fluorescence microscope at 200× total magnification. Samples were counterstained with 4′,6-diamidino-2-phenylindole to mark nuclei (blue). nb, newborn; SAE, surface airway epithelium; SMG, submucosal gland(s).
Figure 5.
Figure 5.
Inflammatory markers dynamically change in CF BALF at birth during the transition from a sterile to nonsterile environment. (AC) Concentrations of (A) IL-1β, (B) IL-8, and (C) TNF-α in BALF from newborn ferrets were determined by ELISA. (D) Concentration of NO in BALF from newborn ferrets measured using a Siever 280i Nitric Oxide Analyzer. (E) Bacterial CFU counts in non-CF and CF newborn ferret BALF determined by growth on blood agar plates. *P < 0.05, **P < 0.01, ***P < 0.001 by Mann-Whitney U test. (FH) Concentrations of (F) IL-1β, (G) IL-8, and (H) TNF-α in BALF from breathing, C-sectioned ferrets were determined by ELISA. (I) Fold changes in cytokine levels between C-section and newborn for each genotype. Cytokine concentrations shown (AC) were divided by the average C-section cytokine concentrations (FH) to obtain the fold changes for each genotype, and the averages of these values were plotted on the same axis. Mann-Whitney U tests were performed between the data sets in AC and FH to determine whether the induction by natural birth was significant for each genotype; the results were as follows: IL-1β, non-CF, P = 0.0014, CF, P = 0.2954; IL-8, non-CF, P = 0.9664, CF, P = 0.036; TNF-α, non-CF, P < 0.0001, CF, P = 0.0007. Genotypic comparisons for the fold change in cytokines between C-section and newborn animals shown in I used the Mann Whitney U test: **P < 0.01, ***P < 0.001, ****P < 0.0001. (J) Bacterial load in newborn ferret BALF was assessed by quantitative PCR for bacterial 16S ribosomal DNA. The limits of sensitivity for this assay were set to zero. Error bars represent SEM throughout.
Figure 6.
Figure 6.
Antimicrobial activity against P. aeruginosa is reduced in BALF from newborn CF ferrets in a pH- and bicarbonate-independent manner. (AC) Proliferation of various strains of bacteria in BALF from non-CF and CF newborn ferrets. BALF from non-CF and CF newborn ferrets was concentrated to 2–5 μg/μl by centrifugation as described in Materials and Methods. A 15-μg sample of the BALF was inoculated with 5,000 CFU of Escherichia coli (EC838) (A), S. pseudintermedius (clinical isolate from an adult CF ferret lung) (B), or P. aeruginosa (PA01) (C) and incubated at 37°C for 3 hours. The surviving bacteria were then quantified by CFU assay. (D) Proliferation of PA01 bacteria in BALF at various pH levels. Concentrated non-CF or CF BALF (15 μg; prepared as in AC) was inoculated with 5,000 CFU PA01 in sodium phosphate buffer at the indicated pH, at 37°C for 3 hours, before CFU quantification. (E) Proliferation of PA01 in the presence or absence of BALF at various bicarbonate concentrations. Concentrated non-CF or CF BALF (15 μg) in sodium phosphate buffer (prepared as in AC) was supplemented with a vehicle or a concentrated bicarbonate solution to the indicated final concentration. Mock samples (no BALF) were also carried along as controls. These samples were then inoculated with 5,000 CFU PA01 at 37°C for 3 hours before CFU quantification. The data in D and E were log transformed before being plotted. Average input CFU (100%) is denoted with a dashed line on each graph. Error bars represent SEM. ***P < 0.001 by Mann-Whitney test (C); significant differences between genotypes at each pH or bicarbonate concentration are marked as: *P < 0.05, **P < 0.01, ***P < 0.001, and ****P < 0.0001 by Sidak’s multiple comparison posttest (D and E); a significant difference (P < 0.05) between non-CF pH 7.2 and non-CF pH 8.3 was also observed (one-way ANOVA, Sidak’s multiple comparison posttest).

Similar articles

Cited by

References

    1. Rowe SM, Miller S, Sorscher EJ. Cystic fibrosis. N Engl J Med. 2005;352:1992–2001. - PubMed
    1. Boucher RC. Airway surface dehydration in cystic fibrosis: pathogenesis and therapy. Annu Rev Med. 2007;58:157–170. - PubMed
    1. Matsui H, Wagner VE, Hill DB, Schwab UE, Rogers TD, Button B, Taylor RM, Superfine R, Rubinstein M, Iglewski BH, et al. A physical linkage between cystic fibrosis airway surface dehydration and Pseudomonas aeruginosa biofilms. Proc Natl Acad Sci USA. 2006;103:18131–18136. - PMC - PubMed
    1. Knowles MR, Boucher RC. Mucus clearance as a primary innate defense mechanism for mammalian airways. J Clin Invest. 2002;109:571–577. - PMC - PubMed
    1. Smith JJ, Travis SM, Greenberg EP, Welsh MJ. Cystic fibrosis airway epithelia fail to kill bacteria because of abnormal airway surface fluid. Cell. 1996;85:229–236. - PubMed

Publication types

MeSH terms