. 2014 Oct 15:3:e03695.
doi: 10.7554/eLife.03695.

Oscillatory phase separation in giant lipid vesicles induced by transmembrane osmotic differentials

Affiliations

Oscillatory phase separation in giant lipid vesicles induced by transmembrane osmotic differentials

Kamila Oglęcka et al. Elife. .

Abstract

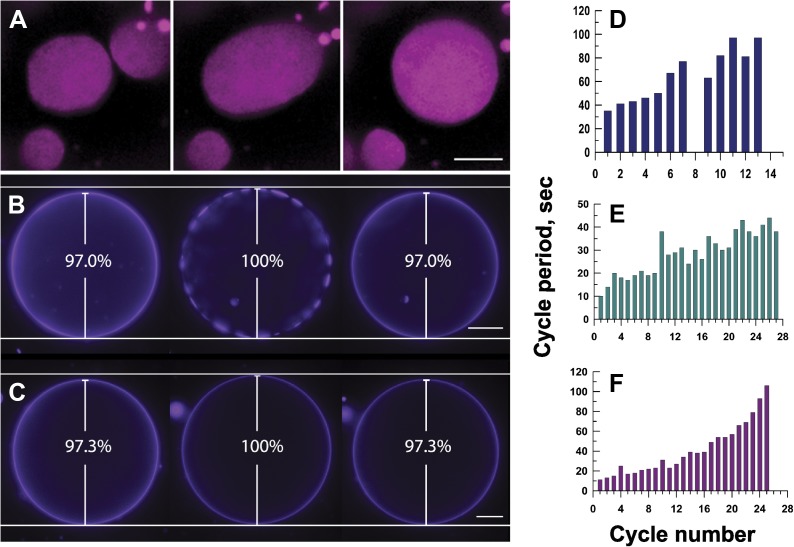
Giant lipid vesicles are closed compartments consisting of semi-permeable shells, which isolate femto- to pico-liter quantities of aqueous core from the bulk. Although water permeates readily across vesicular walls, passive permeation of solutes is hindered. In this study, we show that, when subject to a hypotonic bath, giant vesicles consisting of phase separating lipid mixtures undergo osmotic relaxation exhibiting damped oscillations in phase behavior, which is synchronized with swell-burst lytic cycles: in the swelled state, osmotic pressure and elevated membrane tension due to the influx of water promote domain formation. During bursting, solute leakage through transient pores relaxes the pressure and tension, replacing the domain texture by a uniform one. This isothermal phase transition--resulting from a well-coordinated sequence of mechanochemical events--suggests a complex emergent behavior allowing synthetic vesicles produced from simple components, namely, water, osmolytes, and lipids to sense and regulate their micro-environment.

Keywords: biophysics; cell biology; compartmentalization; giant phospholipid vesicles; lipid rafts; phase separation; primitive osmoregulation; structural biology.


Conflict of interest statement

The authors declare that no competing interests exist.

Figures

Figure 1.
Figure 1.. Subjecting giant unilamellar lipid vesicles to an osmotic differential.
(AB), Schematic of a GUV immersed in an osmotically balanced isotonic bath (A). Dilution of the extra-vesicular dispersion medium by water subjects the GUV to a hypotonic bath producing an osmotic differential (B), which renders initially flaccid vesicles stiff and replaces the initially optically uniform membrane surface by one characterized by a domain pattern of co-existing Ld and Lo phases at microscopic length scales. Solute is rendered as white particles, membrane, pink, and domain pattern in pink and purple. (C–D) The process in (A–B) exemplified by wide-field fluorescence (C) and deconvolved (D) images of a solution of GUVs consisting of POPC:SM:Ch (1:1:1) labeled with 0.5 mol% Rho-DPPE at 25°C containing 200 mM sucrose concentration, osmotically balanced by 200 mM glucose in (C), and under an osmotic differential of ∼200 mM in (D) at 25°C. Scale bars: 15 μm. DOI: http://dx.doi.org/10.7554/eLife.03695.003
Figure 1—figure supplement 1.
Figure 1—figure supplement 1.. Undulating boundary of isotonic vesicles.
Selected time-lapse fluorescence images from Video 1 revealing out-of-plane membrane fluctuations typical for non-tense GUVs in the absence of osmotic gradient. Panels correspond to (A) 0 s, (B) 3 s, (C) 5 s, (D) 11 s, (E) 16 s, (F) 27 s. The GUV is composed of POPC:SM:Ch (1:1:1), labeled with 0.5% Rho-DPPE (pseudo-colored magenta), and imaged at 25°C. Scale bar: 5 µm. DOI: http://dx.doi.org/10.7554/eLife.03695.004
Figure 2.
Figure 2.. Oscillatory phase separation in hypertonic giant unilamellar vesicles subject to an osmotic imbalance.
(A), Selected frames from a video of time-lapse fluorescence images (Video 2) illustrating stages of domain dynamics during two consecutive cycles of oscillatory phase separation (t = 0 s, 9 s, 12 s, 15 s, 25 s, 27 s, 29 s, 188 s, 191 s, 193 s, 246 s, and 247 s). The GUVs imaged consist of POPC:SM:Ch (1:1:1) labeled with 0.5% Rho-DPPE, encapsulating 1 M sucrose, diluted in deionized water, at room temperature. Scale bar: 10 μm. (B) Selected images from time-lapse fluorescence images (Video 3) showing asynchronous cycling in a population of GUVs (t = 0 s, 98 s, 148 s, 294 s, and 448 s). The images are projections of Z-stacks of the lower hemispheres of GUVs consisting of POPC:SM:Ch (1:1:1) labeled with 0.5 mol% Rho-DPPE, encapsulating 200 mM sucrose, diluted in deionized water at 25°C (n = 5). Scale bar: 15 μm. DOI: http://dx.doi.org/10.7554/eLife.03695.006
Figure 3.
Figure 3.. Interrupted imaging of oscillatory phase separation.
Z-stack projections of height-resolved fluorescence images of the lower hemisphere of a GUV consisting of POPC:SM:Ch (1:1:1) labeled with 0.5% Rho-DPPE (pseudo-colored red). The GUV encapsulates 200 mM sucrose, and the external dispersion medium is diluted in MilliQ water. Images are acquired at 25°C at arbitrary time points; (A) 0 s, (B) 99 s, (C) 148 s, (D) 299 s, (E) 550 s, and (F) 692 s. The first image was taken ∼2 hr after imposing the osmotic gradient. Scale bar: 5 µm. DOI: http://dx.doi.org/10.7554/eLife.03695.009
Figure 3—figure supplement 1.
Figure 3—figure supplement 1.. Oscillatory phase separation in complex GUVs prepared by hydration.
Arbitrarily selected micrographs from a time-lapse sequence of fluorescence images from Video 4 for GUVs prepared by ‘gentle hydration’. GUVs consist of POPC:SM:Ch (1:1:1) labeled with 0.5% Rho-DPPE (pseudo-colored blue), encapsulate 200 mM sucrose, and are subject to hypotonic conditions by dilution in MilliQ water at 25°C. Panels correspond to (A) 0 s, (B) 3 s, (C) 6 s, (D) 11 s, (E) 14 s, (F) 22 s, starting about 2 min after establishing the osmotic differential. Daughter vesicles identified as 1 and 2 illustrate clear oscillatory phase separation behavior over the experimental time scale captured by the images displayed. Scale bar: 10 µm. DOI: http://dx.doi.org/10.7554/eLife.03695.010
Figure 4.
Figure 4.. Mechanisms responsible for oscillatory phase separation in GUVs subject to osmotic differentials.
(A) Domain coarsening. Selected frames from Video 4 illustrating collision and coalescence of domains during a swell segment of the GUV oscillations (Ld phase, pseudo-colored magenta). Images are 1 s apart focused on a region of interest located at the bottom of a GUV. Scale bar: 5 μm. (BC) Relationship between vesicle swelling and phase-separation. Fluorescence images revealing (B) that largest domains are observed under conditions of maximal swelling (t = 0 s, 8 s, and 106 s). Scale bar: 10 μm. (C) Control experiment using single component POPC GUVs, labeled with 0.5% Rho-DPPE, encapsulating 200 mM sucrose, diluted in deionized water at 25°C, confirm that the GUV swelling does not require domain formation and/or reorganization. Scale bar: 10 μm. (DF) Increase of cycle period during oscillatory domain dynamics. A bar chart showing successively increasing periods of domain growth/dispersion cycles in GUVs (D) 42.0 μm, (E) 26.3 μm, and (F) 10.7 μm in diameter. A cycle period is defined as the time elapsed between two consecutive instances of appearance of uniform fluorescence. Except for control in (C), all data were collected using POPC:SM:Ch (1:1:1) GUVs, labeled with 0.5% Rho-DPPE, encapsulating 200 mM sucrose, diluted in deionized water at 25°C. DOI: http://dx.doi.org/10.7554/eLife.03695.012
Figure 5.
Figure 5.. Evidence for the formation of microscopic pores during each individual cycle of oscillatory phase separation.
(AL) Wide-field fluorescence images of microscopic pore formation (∼5–15 µm in diameter; indicated by arrows) observed in three consecutive swell–burst cycles of a phase-separating GUV. A single pore appears during each phase separation cycle and reseals within 1 s. The POPC:SM:Ch (1:1:1) GUV labeled with 0.5% Rho-DPPE (pseudo-colored yellow), encapsulates 200 mM sucrose, and is immersed in deionized water at 25°C. Images collected 20 min after imposition of the osmotic differential. Height-resolved (increment, 0.5 µm) images shown at arbitrary time intervals following the first frame. (AL) 0 s, 0.3 s, 0.6 s, 0.9 s, 9.3 s, 9.6 s, 9.9 s, 10.1 s, 15.3 s, 15.6 s, 15.9 s, and 16.1 s. Scale bar: 15 µm. Cascades of pores have been observed more than five times. DOI: http://dx.doi.org/10.7554/eLife.03695.015
Figure 5—figure supplement 1.
Figure 5—figure supplement 1.. Evidence for pore-formation.
Selected frames from Video 7 showing the equatorial view of a POPC:SM:Ch (1:1:1) GUV labeled with 0.5% Rho-DPPE (pseudo-colored green), encapsulating 50 vol % glycerol, diluted in MilliQ water at 25°C. (A) The GUV is in a tense state exhibiting distinct domains. (B) Pore formation (indicated by the arrow) coincides with the onset of domain dispersion. (C) Further domain dispersion. (D) The GUV is returned to an optically homogenous state. Panels are taken with 0.5 s intervals. Scale bar: 5 μm. DOI: http://dx.doi.org/10.7554/eLife.03695.016
Figure 6.
Figure 6.. Osmotic gradients sensed by the membrane and visualized by oscillatory phase separation in nested vesosomes.
Selected frames from Video 7 showing hierarchical membrane structures of POPC:SM:Ch (2:2:1) GUVs labeled with 0.5% SM-Atto647N (pseudo-colored green), encapsulating 1 M sucrose, submerged in MilliQ water at 25°C. In panel (A), we define the entrapping mother vesicle as M and daughter vesicle of interest as D. Both M and D initially exhibit homogenous fluorescence from their membranes, but store different amounts of tension (M is flaccid, while D appears tense). (B) The homogeneous fluorescence from D is replaced by the appearance of optically resolved domains. In the meantime, M becomes more spherical. (C) The domains of D have increased in size, and M has now reached an almost spherical shape. (D) Expulsion of the tense D vesicle. This image acquired during a transient pore formation suggests that the intravesicular pressure and/or crowding is reduced via preferential expulsion of daughter. This event, we surmise, also delays the onset of domain formation by reducing the swelling of the M vesicle. (E) M is returned to a flaccid state, remaining homogenously fluorescent, consistent with the reduction in swelling and a reduction of osmotic pressure. At the same time, D experiencing a new hypotonic medium gets engaged in swell–burst cycles. (F) Further inflation of GUVs leads to M adopting a tense spherical configuration, while yet retaining homogenously fluorescent state, while D's domain sizes continue to grow. (G) The continued swelling of M finally leads to phase separation. (H) Domains in M disappear producing homogeneous state, consistent with the oscillatory phase separation under osmotically generated tension. Panels correspond to (AH) 0 s, 6 s, 14 s, 18 s, 20 s, 62 s, 103 s, and 118 s. Scale bar: 10 µm. DOI: http://dx.doi.org/10.7554/eLife.03695.019
Figure 7.
Figure 7.. Schematic representations of physical mechanisms and changes in membrane properties during vesicular osmoregulation.
(Left panel) (A) GUV in isotonic medium exhibiting a flaccid morphology. (BC) Immersion in a hypotonic bath initiates an osmotically triggered influx of water rendering the GUV tense. (DF) The optically uniform vesicular surface breaks up into a pattern of microscopic domains, which grow by collision and coalescence. (G) Transient appearance of a microscopic pore (∼0.3–0.5 s lifetime), enabling solute efflux and tension relaxation, which drives pore closure, producing closed GUVs with a reduced osmotic differential and homogenous surface. Steps (BG) repeat until the sub-lytic solute concentration differential is reached and the Laplace tension in the membrane is able to compensate for the residual osmotic pressure. (Right panel) Temporal cascades of osmotic pressure (H) and oscillations in membrane tension (I) during osmotic relaxation of giant vesicles subject to hypotonic bath. Note that the relative rates implied in the schematic are only best-guess estimates. DOI: http://dx.doi.org/10.7554/eLife.03695.020

Similar articles

Cited by

References

    1. Akimov SA, Kuzmin PI, Zimmerberg J, Cohen FS. 2007. Lateral tension increases the line tension between two domains in a lipid bilayer membrane. Physical Review E, Statistical, Nonlinear, and Soft Matter Physics 75:011919. doi: 10.1103/PhysRevE.75.011919 - DOI - PubMed
    1. Angelova MI, Soléau S, Méléard P, Faucon JE, Bothorel P. 1992. Preparation of giant vesicles by external AC electric fields. Kinetics and applications. Progress in Colloid and Polymer Science 89:127–131. doi: 10.1007/BFb0116295 - DOI
    1. Ayuyan AG, Cohen FS. 2006. Lipid peroxides promote large rafts: effects of excitation of probes in fluorescence microscopy and electrochemical reactions during vesicle formation. Biophysical Journal 91:2172–2183. doi: 10.1529/biophysj.106.087387 - DOI - PMC - PubMed
    1. Ayuyan AG, Cohen FS. 2008. Raft composition at physiological temperature and pH in the absence of detergents. Biophysical Journal 94:2654–2666. doi: 10.1529/biophysj.107.118596 - DOI - PMC - PubMed
    1. Barziv R, Frisch T, Moses E. 1995. Entropic expulsion in vesicles. Physical Review Letters 75:3481–3484. doi: 10.1103/PhysRevLett.75.3481 - DOI - PubMed

Publication types