Comparative Study
. 2014 Oct 16:11:48.
doi: 10.1186/s12989-014-0048-2.

Inhalation of rod-like carbon nanotubes causes unconventional allergic airway inflammation

Affiliations
Comparative Study

Inhalation of rod-like carbon nanotubes causes unconventional allergic airway inflammation

Elina M Rydman et al. Part Fibre Toxicol. .

Abstract

Background: Carbon nanotubes (CNT) represent a great promise for technological and industrial development but serious concerns on their health effects have also emerged. Rod-shaped CNT are, in fact, able to induce asbestos-like pathogenicity in mice including granuloma formation in abdominal cavity and sub-pleural fibrosis. Exposure to CNT, especially in the occupational context, happens mainly by inhalation. However, little is known about the possible effects of CNT on pulmonary allergic diseases, such as asthma.

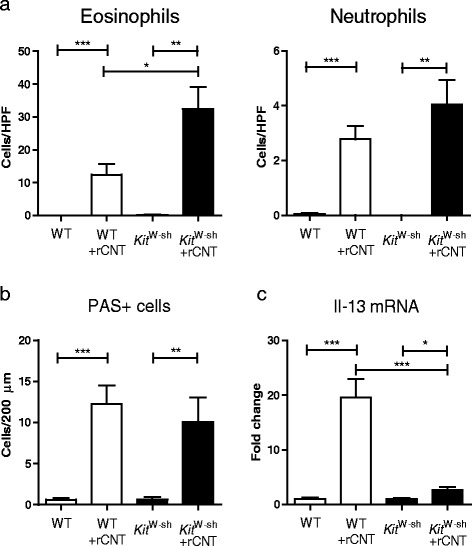
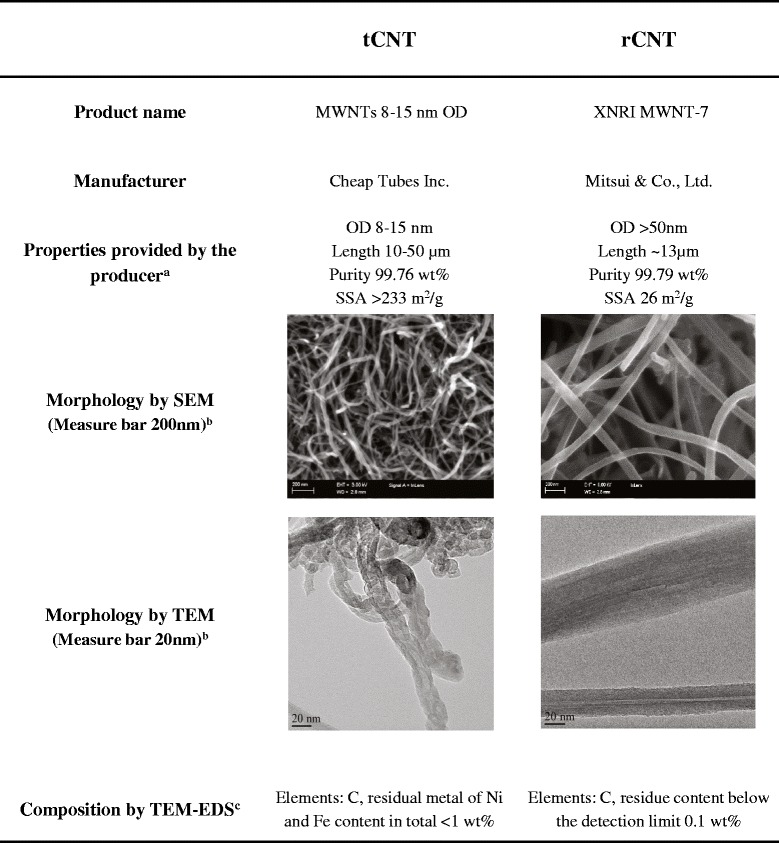
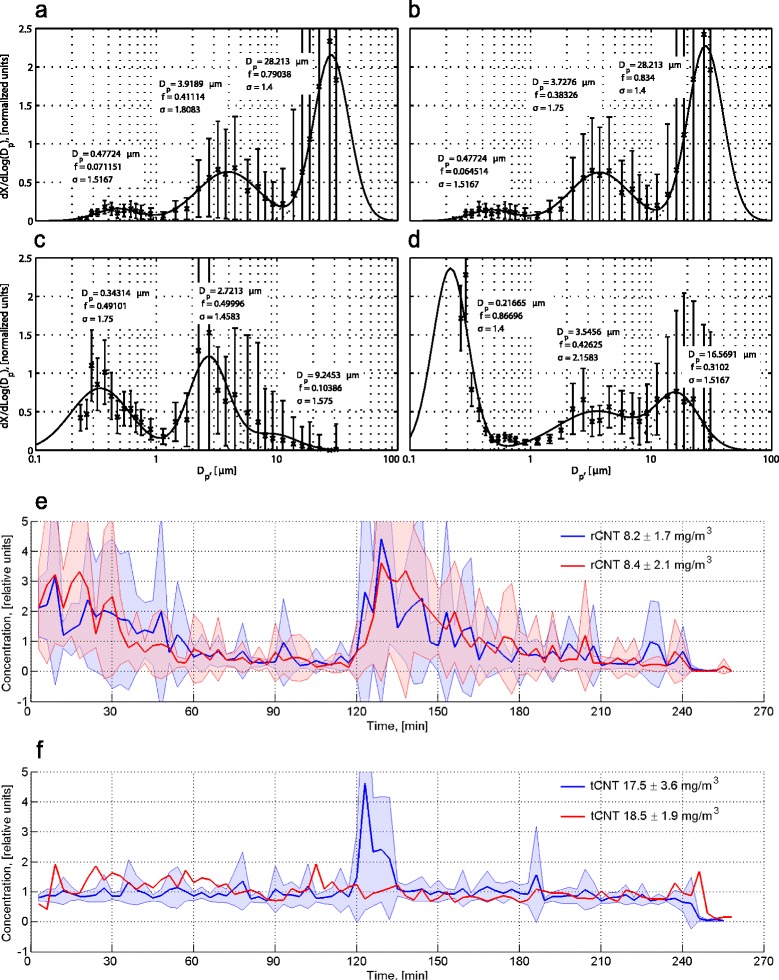
Methods: We exposed mice by inhalation to two types of multi-walled CNT, rigid rod-like and flexible tangled CNT, for four hours a day once or on four consecutive days. Early events were monitored immediately and 24 hours after the single inhalation exposure and the four day exposure mimicked an occupational work week. Mast cell deficient mice were used to evaluate the role of mast cells in the occurring inflammation.

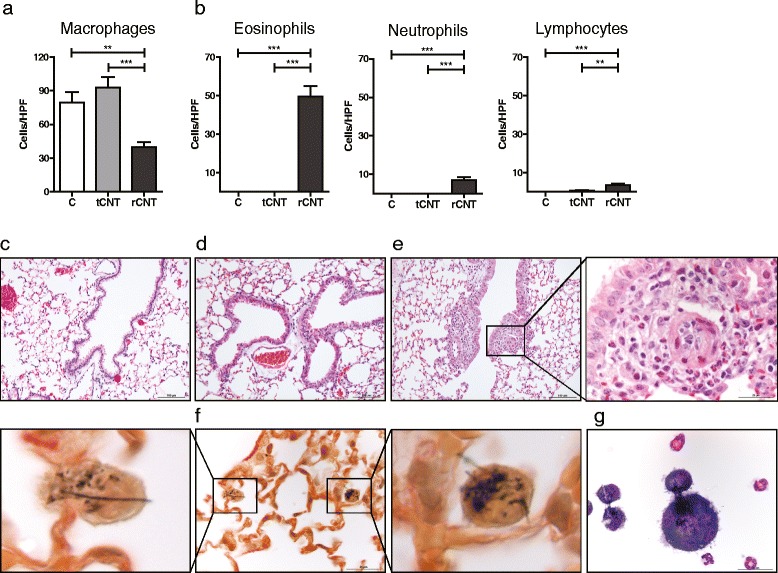
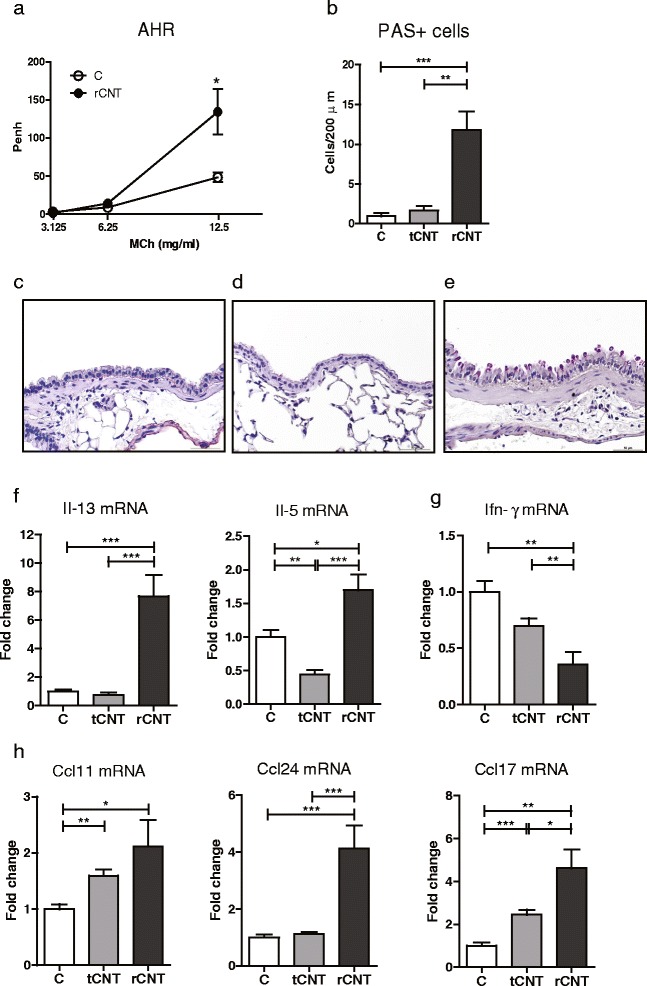
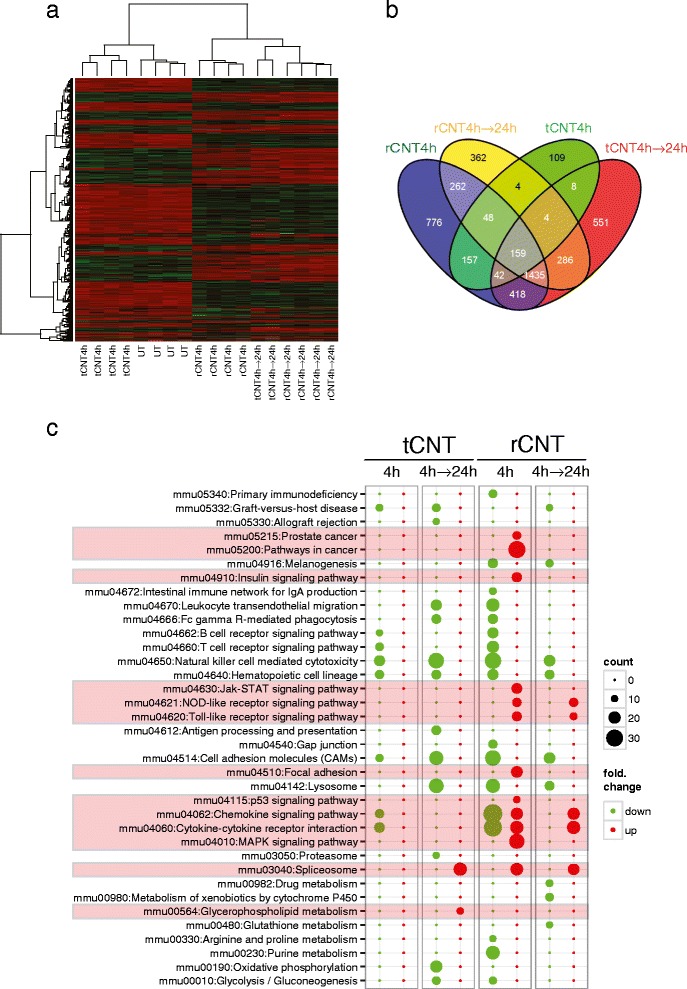
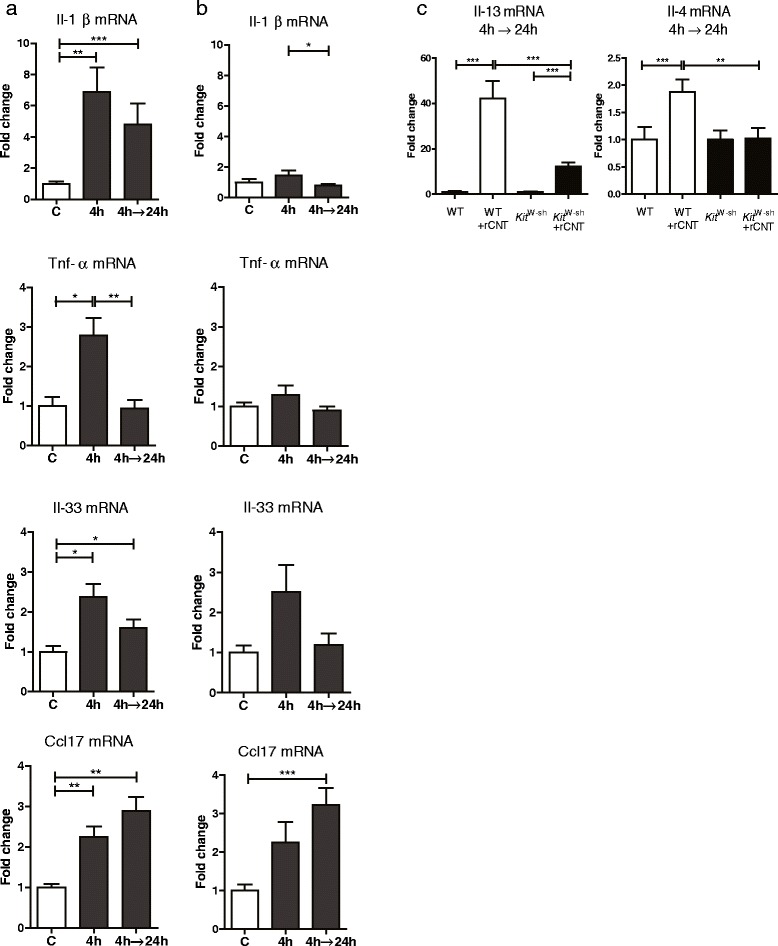
Results: Here we show that even a short-term inhalation of the rod-like CNT induces novel innate immunity-mediated allergic-like airway inflammation in healthy mice. Marked eosinophilia was accompanied by mucus hypersecretion, AHR and the expression of Th2-type cytokines. Exploration of the early events by transcriptomics analysis reveals that a single 4-h exposure to rod-shaped CNT, but not to tangled CNT, causes a radical up-regulation of genes involved in innate immunity and cytokine/chemokine pathways. Mast cells were found to partially regulate the inflammation caused by rod-like CNT, but also alveaolar macrophages play an important role in the early stages.

Conclusions: These observations emphasize the diverse abilities of CNT to impact the immune system, and they should be taken into account for hazard assessment.


Figures

Figure 1
Figure 1
Inhaled rCNTs induce strong pulmonary eosinophilia in mice after exposure for 4 consecutive days. C57BL/6 mice were exposed to rCNT or tCNT for 4 h/day for 4 consecutive days and the samples were collected 24 h after the last treatment. a,b: BAL cell counts showed the ability of rCNT to cause a decrease in the number of alveolar macrophages (a) and induce recruitment of inflammatory cells, especially eosinophils (b). c-e: H&E-stained lung sections of untreated (c), tCNT-treated (d) and a rCNT-treated (e) mouse exhibiting that eosinophilia was specific to rCNT (e, see inset for eosinophils). f: internalized rCNT fibers in alveolar macrophages were detected in interstitial areas in Picrosirius red-stained lung sections. g: an image of BAL cells showing a foreign-body giant cell containing rCNT, macrophages undergoing “frustrated phagocytosis”, eosinophils and a neutrophil. Columns and error bars in a and b represent mean values ± standard error of mean (SEM; n = 9-20). Images c and d are shown with a 100 μm scale bar, f-g and the inset is shown with a 25 μm scale bar. **P < 0.01; ***P < 0.001. C, untreated control group; HPF, high power field.
Figure 2
Figure 2
Inhalation to rCNT induces AHR, mucus secretion and induction of Th2 type cytokines in the lungs. a: BALB/c mice exposed to rCNT for 4 h/day on 4 consecutive days showed enhanced AHR to metacholine on day 5. b-h: using the same exposure schedule, C57BL/6 mice were exposed to tCNT or rCNT and sacrificed on the following day. b: PAS-stained lung sections were used to determine the numbers of mucin-producing goblet cells. c-e: representative images of PAS-stained lung tissue of an untreated mouse (c) and mice exposed to tCNT (d) and rCNT (e) that show markable activation of mucin-producing cells in lungs of rCNT-exposed but not in tCNT-exposed mice. f, g: the mRNA expression levels measured in lung tissue revealed an upregulation of Th2 type cytokines Il-13 and Il-5 (f) and downregulation of Th1 cytokine Ifn-γ (g) after exposure to rCNT. h: furthermore, mRNA expression of eosinophil-attracting chemokines Ccl11, Ccl24 and Ccl17 was triggered in lungs by rCNT. Results of AHR measurements (a) are expressed as mean enhanced pause values (Penh) ± SEM (n = 9-11). PAS + cell counts (b) represent the average of positive cells per 200 μm of bronchus surface counted from three bronchi per mouse in control group and six bronchi per mouse in CNT-exposed groups (n = 10-20). Images c-e are shown at x400 magnification with a 50 μm scale bar. mRNA expression levels measured by qRT-PCR are presented as fold changes compared to untreated control mice (n = 10-20). *P < 0.05; **P < 0.01; ***P < 0.001. MCh, metacoline; C, control group.
Figure 3
Figure 3
Mast cells play a partial role in the development of rCNT-triggered asthma. Wild type (WT) C57BL/6 mice and mast cell deficient Kit W-sh mice in C57BL/6 background were exposed to rCNT for 4 h/day on 4 consecutive days and were sacrificed on day 5. a: BAL cell counts showed that mast cells affect the migration of eosinophils but not neutrophils into the lungs. b: the numbers of PAS+ cells did not differ in WT and Kit W-sh mice indicating that mast cells do not regulate the activation of goblet cells. c: the mRNA expression levels measured in lung tissue revealed a significant down-regulation of Th2 type cytokine Il-13 in Kit W-sh mice compared with WT mice. PAS+ cell counts (b) represent the average of positive cells per 200 μm of bronchus surface counted from three bronchi per mouse in control group and six bronchi per mouse in CNT-exposed groups (n = 7-9). mRNA expression levels in c are presented as fold changes relative to untreated control mice of the corresponding strain (n = 7-9). *P < 0.05; **P < 0.01; ***P < 0.001.
Figure 4
Figure 4
Transcriptome analysis of lung tissue reveals rapid activation of innate immune system in response to inhaled rCNT. a: heatmap of differentially expressed genes (linear FC > |1.5|, post hoc adjusted P-value = 0.01) in lungs of mice exposed to rCNT or tCNT for 4 h and sacrificed either immediately after exposure or on the following day. Genes are arranged by hierarchical clustering analysis. Untreated (UT) and tCNT-exposed lung samples share similar expression patterns shortly after 4-h exposure. Red color indicates higher expression while green denotes lower expression. b: Venn diagram of the microarray results summarizing the numbers of differentially expressed genes (linear FC > |1.5|, post hoc adjusted P-value = 0.01) in lung tissue after 4 h exposure to CNT. The diagram shows that rCNT cause a markable expression of multiple distinct genes already after 4-h exposure (776 genes) while the number of genes specific to tCNT is notably lower (109 genes). c: pathway bubble-plot shows that inhalation of rCNT activates several innate immunity-associated pathways after the 4 h exposure. The diameter of each circle represents the number of genes annotated in each pathway (legend “count”). Red color indicates up-regulated pathways and green color down-regulated pathways compared to untreated controls.
Figure 5
Figure 5
Alveolar macrophages and mast cells mediate the early inflammatory and pro-allergic responses induced by rCNT. a,b: BAL and lung tissue were collected from C57BL/6 mice exposed to rCNT for 4 h and sacrificed either immediately or on the following day. Comparison of mRNA expression levels of cytokines/chemokines in BAL cells (a) and lung tissue (b) showing that pro-inflammatory cytokines Il-1β and Tnf-α are produced by alveolar macrophages which are the major cell type in BAL at early time points (data not shown) while Th2-promoting cytokine Il-33, and eosinophil-attracting chemokine Ccl17 are expressed in BAL cells as well as in other cells types present in lung tissue. c: levels of Th2 type cytokines Il-13 and Il-4 in lungs were dependent on the presence of mast cells as the expression of these cytokines was significantly lower in Kit W-sh mice exposed to rCNT for 4 h and sacrificed on the next day. mRNA expression levels in a and b are presented as fold changes relative to untreated control mice (n = 5-8). In c, values indicate fold changes compared with control mice of the corresponding strain (n = 7-9). *P < 0.05; **P < 0.01; ***P < 0.001. C, untreated control group.
Figure 6
Figure 6
Table of characteristics of the used multi-walled carbon nanotubes. aSize, purity and specific surface area are reported in the table, as provided by the vendor. bMorphology of the materials is pictured by electron microscopy (SEM and TEM). cElemental composition shown is the average of three separate analyses. CNT, carbon nanotubes; EDS, energy dispersive X-ray spectroscopy; OD, outside diameter; SEM, scanning electron microscopy; SSA, specific surface area; TEM, transmission electron microscopy; wt%, weight percent.
Figure 7
Figure 7
Concentrations and size distributions of CNT aerosols. a-d: normalized particle size distributions for rCNT experiments with the average concentration of 8.2 mg/m3 (a) and 8.4 mg/m3 (b). Control material (tCNT), with the average particle concentration of 17.5 mg/m3 (c) and 18.5 mg/m3 (d), was used to confirm that rCNT induced inflammatory reaction are truly rCNT-specific and biologically relevant. Parameters of individual log-normal fits: Dp, the mean diameter in relative units; f, the distribution frequency; σ, the geometric standard deviation. e,f: Particle concentration time series of two representative rCNT (e) and tCNT (f) experiments. Increase of the concentrations at 120 min is due to refilling of the FBAG reservoir. Bold lines represent means of four 4 h exposures performed on 4 consecutive days and colored areas present standard deviation (SD). In f, the red line represents a single 4 h experiment and hence SD is not shown.

Similar articles

Cited by

References

    1. Lloyd CM, Hessel EM. Functions of T cells in asthma: more than just T(H)2 cells. Nat Rev Immunol. 2010;10:838–848. doi: 10.1038/nri2870. - DOI - PMC - PubMed
    1. Galli SJ, Tsai M, Piliponsky AM. The development of allergic inflammation. Nature. 2008;454:445–454. doi: 10.1038/nature07204. - DOI - PMC - PubMed
    1. Reuter S, Stassen M, Taube C. Mast cells in allergic asthma and beyond. Yonsei Med J. 2010;51:797–807. doi: 10.3349/ymj.2010.51.6.797. - DOI - PMC - PubMed
    1. Fanta CH. Asthma. N Engl J Med. 2009;360:1002–1014. doi: 10.1056/NEJMra0804579. - DOI - PubMed
    1. Holtzman MJ. Asthma as a chronic disease of the innate and adaptive immune systems responding to viruses and allergens. J Clin Invest. 2012;122:2741–2748. doi: 10.1172/JCI60325. - DOI - PMC - PubMed

Publication types

MeSH terms