

Systematic shifts in the balance of excitation and inhibition coordinate the activity of axial motor pools at different speeds of locomotion
- PMID: 25319701
- PMCID: PMC4198544
- DOI: 10.1523/JNEUROSCI.0514-14.2014
Systematic shifts in the balance of excitation and inhibition coordinate the activity of axial motor pools at different speeds of locomotion
Abstract
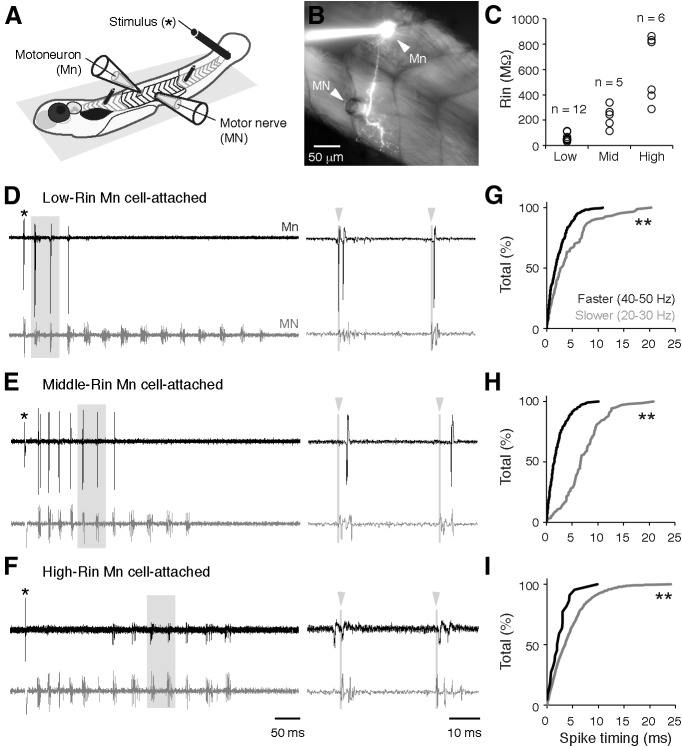
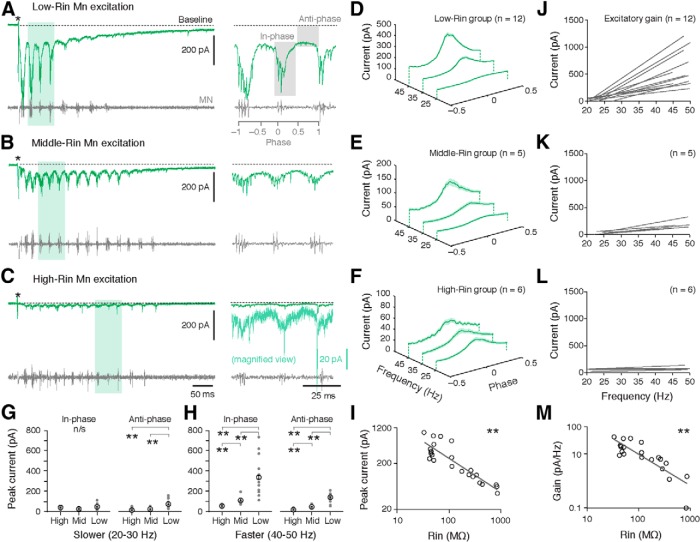
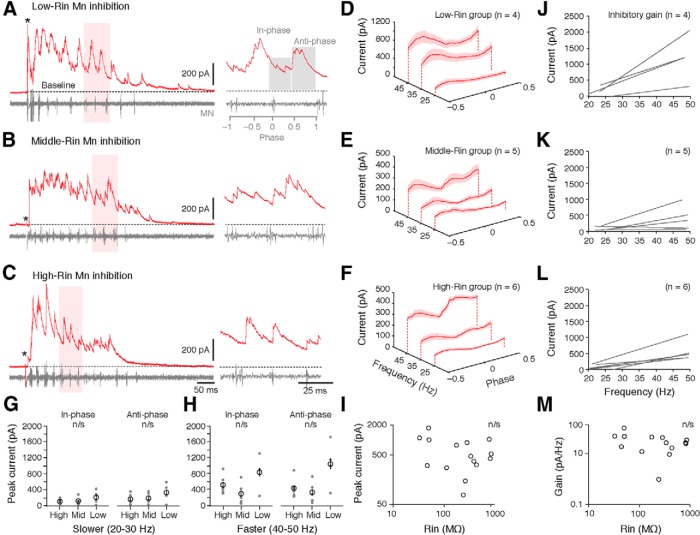
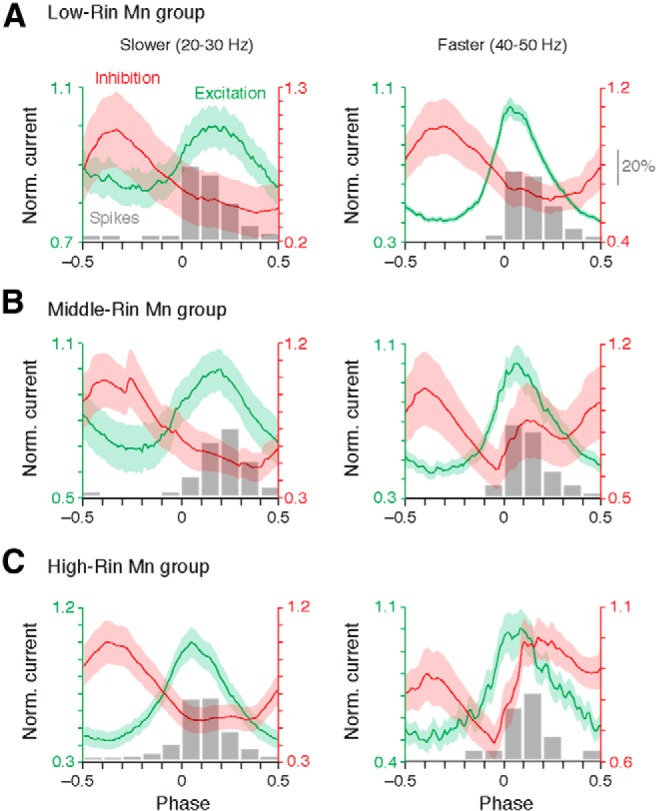
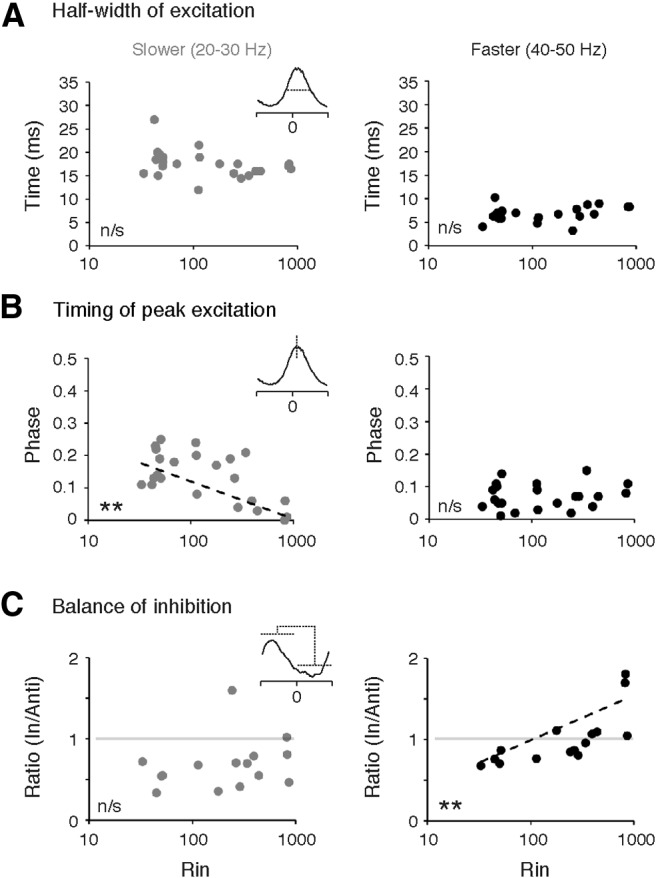
An emerging consensus from studies of axial and limb networks is that different premotor populations are required for different speeds of locomotion. An important but unresolved issue is why this occurs. Here, we perform voltage-clamp recordings from axial motoneurons in larval zebrafish during "fictive" swimming to test the idea that systematic differences in the biophysical properties of axial motoneurons are associated with differential tuning in the weight and timing of synaptic drive, which would help explain premotor population shifts. We find that increases in swimming speed are accompanied by increases in excitation preferentially to lower input resistance (Rin) motoneurons, whereas inhibition uniformly increases with speed to all motoneurons regardless of Rin. Additionally, while the timing of rhythmic excitatory drive sharpens within the pool as speed increases, there are shifts in the dominant source of inhibition related to Rin. At slow speeds, anti-phase inhibition is larger throughout the pool. However, as swimming speeds up, inhibition arriving in-phase with local motor activity increases, particularly in higher Rin motoneurons. Thus, in addition to systematic differences in the weight and timing of excitation related to Rin and speed, there are also speed-dependent shifts in the balance of different sources of inhibition, which is most obvious in more excitable motor pools. We conclude that synaptic drive is differentially tuned to the biophysical properties of motoneurons and argue that differences in premotor circuits exist to simplify the coordination of activity within spinal motor pools during changes in locomotor speed.
Keywords: excitation; inhibition; locomotion; motoneurons; recruitment; spinal cord.
Copyright © 2014 the authors 0270-6474/14/3414046-09$15.00/0.
Figures
Similar articles
-
Synaptic drive to motoneurons during fictive swimming in the developing zebrafish.J Neurophysiol. 2001 Jul;86(1):197-210. doi: 10.1152/jn.2001.86.1.197. J Neurophysiol. 2001. PMID: 11431502
-
Spinal Basis of Direction Control during Locomotion in Larval Zebrafish.J Neurosci. 2023 May 31;43(22):4062-4074. doi: 10.1523/JNEUROSCI.0703-22.2023. Epub 2023 May 1. J Neurosci. 2023. PMID: 37127363 Free PMC article.
-
A gradient in endogenous rhythmicity and oscillatory drive matches recruitment order in an axial motor pool.J Neurosci. 2012 Aug 8;32(32):10925-39. doi: 10.1523/JNEUROSCI.1809-12.2012. J Neurosci. 2012. PMID: 22875927 Free PMC article.
-
Positive feedback as a general mechanism for sustaining rhythmic and non-rhythmic activity.J Physiol Paris. 1995;89(4-6):241-8. doi: 10.1016/0928-4257(96)83640-0. J Physiol Paris. 1995. PMID: 8861822 Review.
-
Flexibility in the patterning and control of axial locomotor networks in lamprey.Integr Comp Biol. 2011 Dec;51(6):869-78. doi: 10.1093/icb/icr077. Epub 2011 Jul 9. Integr Comp Biol. 2011. PMID: 21743089 Free PMC article. Review.
Cited by
-
Central and peripheral innervation patterns of defined axial motor units in larval zebrafish.J Comp Neurol. 2019 Oct 15;527(15):2557-2572. doi: 10.1002/cne.24689. Epub 2019 Apr 11. J Comp Neurol. 2019. PMID: 30919953 Free PMC article.
-
Peeling back the layers of locomotor control in the spinal cord.Curr Opin Neurobiol. 2015 Aug;33:63-70. doi: 10.1016/j.conb.2015.03.001. Epub 2015 Mar 25. Curr Opin Neurobiol. 2015. PMID: 25820136 Free PMC article. Review.
-
Neuromodulatory Selection of Motor Neuron Recruitment Patterns in a Visuomotor Behavior Increases Speed.Curr Biol. 2020 Mar 9;30(5):788-801.e3. doi: 10.1016/j.cub.2019.12.064. Epub 2020 Feb 20. Curr Biol. 2020. PMID: 32084402 Free PMC article.
-
Cell-type-specific origins of locomotor rhythmicity at different speeds in larval zebrafish.Elife. 2024 Sep 17;13:RP94349. doi: 10.7554/eLife.94349. Elife. 2024. PMID: 39287613 Free PMC article.
-
Mixed synapses reconcile violations of the size principle in zebrafish spinal cord.Elife. 2022 Sep 27;11:e64063. doi: 10.7554/eLife.64063. Elife. 2022. PMID: 36166290 Free PMC article.
References
Publication types
MeSH terms
Grants and funding
LinkOut - more resources
Full Text Sources
Other Literature Sources