. 2014 Dec;24(12):1945-62.
doi: 10.1101/gr.164830.113. Epub 2014 Oct 15.

Dynamic shifts in occupancy by TAL1 are guided by GATA factors and drive large-scale reprogramming of gene expression during hematopoiesis

Affiliations

Dynamic shifts in occupancy by TAL1 are guided by GATA factors and drive large-scale reprogramming of gene expression during hematopoiesis

Weisheng Wu et al. Genome Res. 2014 Dec.

Abstract

We used mouse ENCODE data along with complementary data from other laboratories to study the dynamics of occupancy and the role in gene regulation of the transcription factor TAL1, a critical regulator of hematopoiesis, at multiple stages of hematopoietic differentiation. We combined ChIP-seq and RNA-seq data in six mouse cell types representing a progression from multilineage precursors to differentiated erythroblasts and megakaryocytes. We found that sites of occupancy shift dramatically during commitment to the erythroid lineage, vary further during terminal maturation, and are strongly associated with changes in gene expression. In multilineage progenitors, the likely target genes are enriched for hematopoietic growth and functions associated with the mature cells of specific daughter lineages (such as megakaryocytes). In contrast, target genes in erythroblasts are specifically enriched for red cell functions. Furthermore, shifts in TAL1 occupancy during erythroid differentiation are associated with gene repression (dissociation) and induction (co-occupancy with GATA1). Based on both enrichment for transcription factor binding site motifs and co-occupancy determined by ChIP-seq, recruitment by GATA transcription factors appears to be a stronger determinant of TAL1 binding to chromatin than the canonical E-box binding site motif. Studies of additional proteins lead to the model that TAL1 regulates expression after being directed to a distinct subset of genomic binding sites in each cell type via its association with different complexes containing master regulators such as GATA2, ERG, and RUNX1 in multilineage cells and the lineage-specific master regulator GATA1 in erythroblasts.


Figures

Figure 1.
Figure 1.
Erythropoiesis, megakaryopoiesis, and relocation of TAL1 occupancy. (A) The diagram shows differentiation from hematopoietic precursors to erythroblasts and megakaryocytes, including the corresponding cell types or lines used in this study. (B) The numbers of merged TAL1 OSs that are occupied by TAL1 in one to six of the assayed cell types or lines. (C) Venn diagram showing cell type–specific and shared TAL1 OSs in G1E and G1E-ER4 + E2 (ER4) cell lines. (D) Scatter plot showing the normalized ChIP-seq read counts of TAL1 on the TAL1 OSs in G1E versus ER4 cells. The TAL1 OSs identified only in G1E, only in ER4, or both are represented by green, red, or brown dots, respectively.
Figure 2.
Figure 2.
Comparison of TAL1 OSs among multiple cell types. TAL1 peaks were called individually from ChIP-seq reads in each cell type and then concatenated and merged into a union set. (A) The segments were clustered (k-means) based on the TAL1 occupancy signals in the six cell types. The clusters are dominated by binding in the following cell types: 1, HPC-7; 2, Epro (Ter119 erythroid progenitors); 3 and 4, G1E; 5, ER4; 6, Ebl (Ter119+ erythroblasts); 7, Meg (megakaryocytes); 8, HPC-7 + Epro; 9 and 10, HPC-7 + Meg; 11, Epro + ER4 + Ebl; 12–14, all erythroid cells, Epro + G1E + ER4 + Ebl; 15, all six cell types; 16, HPC-7 + Epro + ER4 + Meg. The numbers of segments in each cluster are given in parentheses. (B) The correlation coefficients of the TAL1 binding signals between cell types were computed and clustered by hierarchical clustering, shown as a dendrogram.
Figure 3.
Figure 3.
Loci illustrating shifts in patterns of TAL1 occupancy and co-occupancy by other transcription factors among the six differentiation stages. Each panel shows on the left the signal track for each indicated transcription factor binding in the designated cell type. Signal for TAL1 binding is blue; for GATA factors, red; and those for other factors, green. Peak calls for KLF1 in erythroblasts are shown from two different sources; the upper boxes are from Tallack et al. (2010), and the lower boxes are from Pilon et al. (2011). Direction of transcription for each gene is left to right. The graphs on the right show levels of expression in hematopoietic stem progenitor cells (HSPCs), which are a proxy for expression in HPC-7 cells, erythroblasts, and megakaryocytes (Pimkin et al. 2014). (A) The Pf4 gene (encoding platelet factor 4) illustrates TAL1 binding in megakaryocytes and in HPC-7, not in erythroid cells. (B) The Cpox gene (encoding coproporphyrinogen oxidase) is bound almost exclusively in erythroid cells. (C) The Cbfa2t3 gene is bound at multiple locations, which show a diversity of patterns across differentiation.
Figure 4.
Figure 4.
Histone modifications and chromatin states on TAL1 OSs. (A) Levels of five histone modification ChIP-seq signals (shown by box plots) in G1E, G1E-ER4 + E2, Ter119+ erythroblasts, and megakaryocytes were computed on the DNA segments occupied by TAL1 OSs in each cell type. (B) Chromatin states were determined using chromHMM (Ernst and Kellis 2010; Ernst et al. 2011) after learning the model from the five histone modifications in multiple cell types (Cheng et al. 2014). The pie chart shows the number of HPC-7-only TAL1 OSs that carry the designated pattern of chromatin states in the three erythroid cell types.
Figure 5.
Figure 5.
Comparison of enrichment of transcription factor binding site motifs and co-occupancy on TAL1 OSs in six hematopoietic cell types. (A) The locations of five motifs (logos at the top of the panel) on 1-kb intervals (only 800 bp is displayed here) centered on TAL1 OS peak centers were found by FIMO in each of the six cell types. The distribution of the locations is plotted by both histograms (colored bars) and density plots (black curves on top of histograms). (B) Enrichment or depletion of each motif in the TAL1 OSs for each cell type. (C) Fraction of TAL1 OSs (cell types indicated by color key) bound by the transcription factor indicated on the x-axis. Cell types for the transcription factor binding are abbreviated: h, HPC-7; g, G1E; r, G1E-ER4 + E2; b, erythroblast; m, megakaryocytes.
Figure 6.
Figure 6.
Changes of TAL1 occupancy in GATA1-induced erythroid differentiation. (A) Venn diagram showing TF-occupied DNA segments partitioned by occupancy by TAL1 in G1E and ER4 cells and by GATA1 in ER4 cells. (B) Expression response of presumptive target genes. Genes were associated with TAL1 OSs based on their colocalization in EPUs. For each of the six TAL1 occupancy patterns, the percentages of the differentially expressed (DE) presumptive targets that are induced or repressed are shown as bar plots. The average percentages obtained after 1000 shufflings of the TAL1 OS category (groups a–f) within the matrix are shown by the dotted lines in the bar plot (left for repressed, right for induced). For each of the 1000 permutations, the true percentage of DE genes was divided by the percentage from the shuffled data set. The distributions of the log2 (true percentage/shuffled percentage), shown as box plots, give an estimate of the relative enrichment or depletion for induction or repression of the presumptive gene targets in each TAL1 OS category. (C) Role of GATA2 in TAL1 occupancy. For the subset of TAL1 OSs that is also bound by GATA2 in G1E cells, the percentages that fall into each of the TAL1 OS partitions defined in panel A are plotted. The DNA segments bound by both TAL1 and GATA2 in groups a, c, and e in panel A are GATA2 loss sites, whereas those in groups b, d, and f are GATA switch sites.
Figure 7.
Figure 7.
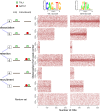
Distribution of GATA and TAL1 binding site motif instances in different categories of TAL1OSs. The location of DNA sequences matching the binding site motif for GATA factors or TAL1 within 500 bp from the center of each OS is indicated by a red dot. TAL1 OSs were separated into six categories based on the cell types in which they are bound and their co-occupancy by GATA1, shown by diagrams on the left, with green and red disks representing TAL1 and GATA1 occupancy, respectively. In each panel, the OSs were sorted from left to right by increasing occupancy level of TAL1 in the corresponding cell line.
Figure 8.
Figure 8.
Model for differential occupancy by TAL1 in multilineage versus erythroid cells. The groups of proteins that co-occupy DNA in the two cell types are shown, along with cognate binding site motifs (yellow boxes, identity of each motif is listed at the bottom) along the DNA (long brown rectangle). The different arrangements of motifs signify the diversity of motifs seen in TAL1-occupied segments and emphasize the predominance of the GATA motif. The proteins TAL1:TCF3, LMO2, LDB1, and GATA1 form a multiprotein complex (Rodriguez et al. 2005); the other proteins shown are in proximity when bound to DNA. Additional proteins recognizing the same motif as other members of the TF family and bound at some sites (e.g., GATA2 and ERG in megakaryocytes) are also shown. Specific binding by TFs occurs within accessible DNA in chromatin that itself has histone modifications associated with gene activity (green and yellow circles representing methylation of lysines on H3 and acetylation of H4). The complex of proteins including TAL1 can exert positive effects on expression (curved arrow as shown) on recruitment and release of RNA polymerase for active transcription on induced genes. Other TAL1-containing complexes can exert negative effects (not shown). Cell-specific binding of TAL1 and associated proteins target different cohorts of genes.

References

    1. Achim K, Peltopuro P, Lahti L, Tsai HH, Zachariah A, Astrand M, Salminen M, Rowitch D, Partanen J. 2013. The role of Tal2 and Tal1 in the differentiation of midbrain GABAergic neuron precursors. Biol Open 2: 990–997. - PMC - PubMed
    1. Anguita E, Hughes J, Heyworth C, Blobel GA, Wood WG, Higgs DR. 2004. Globin gene activation during haemopoiesis is driven by protein complexes nucleated by GATA-1 and GATA-2. EMBO J 23: 2841–2852. - PMC - PubMed
    1. Aplan PD, Nakahara K, Orkin SH, Kirsch IR. 1992. The SCL gene product: a positive regulator of erythroid differentiation. EMBO J 11: 4073–4081. - PMC - PubMed
    1. Arvey A, Agius P, Noble WS, Leslie C. 2012. Sequence and chromatin determinants of cell-type-specific transcription factor binding. Genome Res 22: 1723–1734. - PMC - PubMed
    1. Blobel GA, Nakajima T, Eckner R, Montminy M, Orkin SH. 1998. CREB-binding protein cooperates with transcription factor GATA-1 and is required for erythroid differentiation. Proc Natl Acad Sci 95: 2061–2066. - PMC - PubMed

Publication types

MeSH terms

Associated data