. 2014 Dec;24(12):1932-44.
doi: 10.1101/gr.164178.113. Epub 2014 Oct 15.

Divergent functions of hematopoietic transcription factors in lineage priming and differentiation during erythro-megakaryopoiesis

Affiliations

Divergent functions of hematopoietic transcription factors in lineage priming and differentiation during erythro-megakaryopoiesis

Maxim Pimkin et al. Genome Res. 2014 Dec.

Abstract

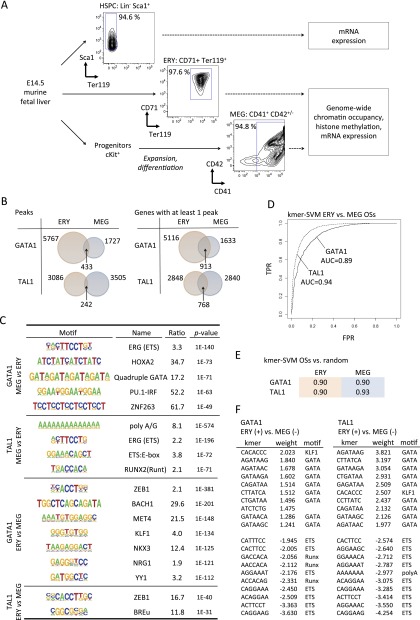
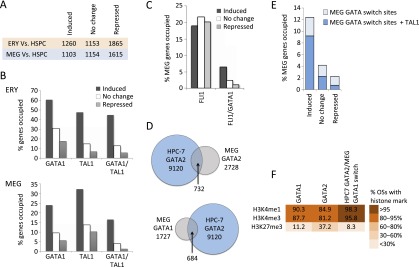
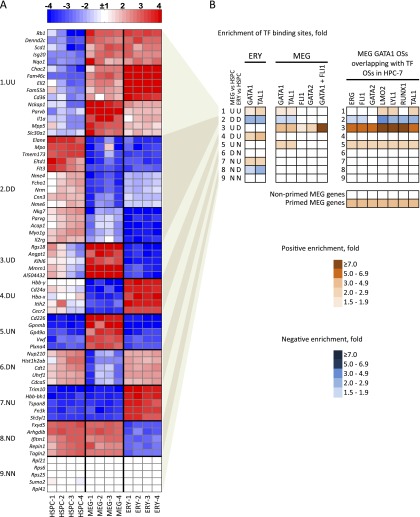
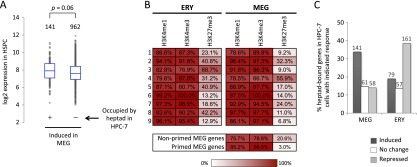
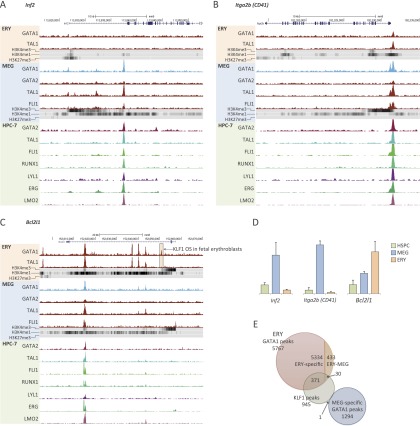
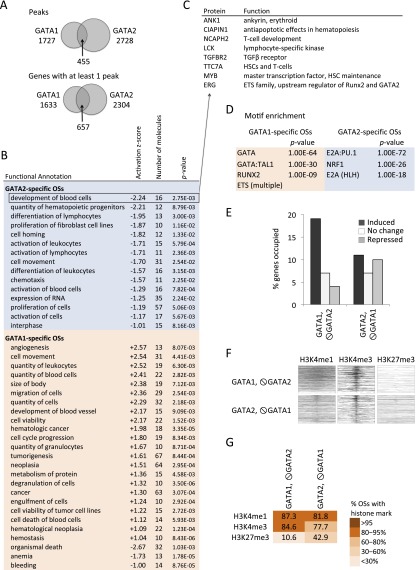
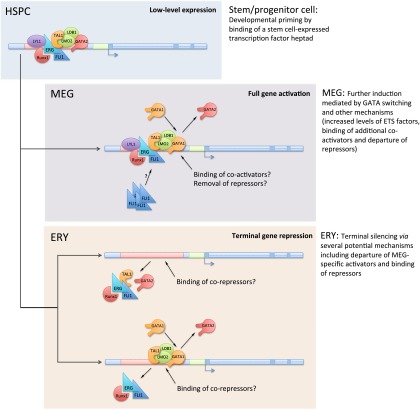
Combinatorial actions of relatively few transcription factors control hematopoietic differentiation. To investigate this process in erythro-megakaryopoiesis, we correlated the genome-wide chromatin occupancy signatures of four master hematopoietic transcription factors (GATA1, GATA2, TAL1, and FLI1) and three diagnostic histone modification marks with the gene expression changes that occur during development of primary cultured megakaryocytes (MEG) and primary erythroblasts (ERY) from murine fetal liver hematopoietic stem/progenitor cells. We identified a robust, genome-wide mechanism of MEG-specific lineage priming by a previously described stem/progenitor cell-expressed transcription factor heptad (GATA2, LYL1, TAL1, FLI1, ERG, RUNX1, LMO2) binding to MEG-associated cis-regulatory modules (CRMs) in multipotential progenitors. This is followed by genome-wide GATA factor switching that mediates further induction of MEG-specific genes following lineage commitment. Interaction between GATA and ETS factors appears to be a key determinant of these processes. In contrast, ERY-specific lineage priming is biased toward GATA2-independent mechanisms. In addition to its role in MEG lineage priming, GATA2 plays an extensive role in late megakaryopoiesis as a transcriptional repressor at loci defined by a specific DNA signature. Our findings reveal important new insights into how ERY and MEG lineages arise from a common bipotential progenitor via overlapping and divergent functions of shared hematopoietic transcription factors.


Figures

Figure 1.
Figure 1.
Context-specific functions for GATA1 and TAL1 in erythro-megakaryopoiesis. (A) Experimental scheme for deriving and analyzing hematopoietic stem cell and progenitor cells (HSPCs), erythroblasts (ERY), and megakaryocytes (MEG) from murine fetal liver. (B) Venn diagrams showing the intersection between ERY and MEG of transcription factor occupancy site (OS) peaks (Peaks) and transcription factor-bound genes (Genes). The latter is defined as a gene with at least one OS peak mapping between 10 kb upstream of the TSS and 3 kb downstream from the polyadenylation signal (Cheng et al. 2009; Wu et al. 2011). Genes containing multiple OSs were counted only once. (C) Motifs overrepresented in the 200-bp sequences surrounding the GATA1 peak center in ERY versus MEG, and vice versa. (D) ROC curves for kmer-SVM on GATA1 OSs in ERY versus MEG and TAL1 OSs in ERY versus MEG. (TPR) True positive rate; (FPR) false positive rate. (E) kmer-SVM results (AUC) for GATA1 and TAL1 OSs trained against random sequences. (F) High weight k-mers correspond to known cofactor binding sites. In ERY, KLF1 motifs predict GATA1 binding and GATA motifs predict TAL1 binding. In MEG, ETS and RUNX motifs are positive predictors of GATA1 and/or TAL1 binding.
Figure 2.
Figure 2.
Functional annotation of GATA1, GATA2, and FLI1 occupancy in megakaryopoiesis. (A) Numbers of up-regulated (induced), unchanged, and down-regulated (repressed) genes in ERY and MEG compared to HSPCs, used as a reference point. (B) Fractions of up-regulated, unchanged, and down-regulated genes (versus HSPC) occupied by GATA1 or TAL1 (irrespective of co-occupancy by other transcription factors) and genes co-occupied by GATA1 and TAL1 in ERY and MEG. (C) Fraction of up-regulated, unchanged, and down-regulated genes occupied by FLI1 in MEG (all FLI1 OSs and those co-occupied by GATA1 and FLI1). (D) Intersection of transcription factor occupancy peaks between MEG and the multipotent hematopoietic cell line HPC-7 (Wilson et al. 2010). (E) Fractions of up-regulated, unchanged, and down-regulated genes containing a GATA switch site (replacement of GATA2 with GATA1) in MEG development, with or without concurrent TAL1 binding. (F) Color-coded fractions of transcription factor binding sites associated with H3K4me3, H3K4me1, and H3K27me3 histone methylation patterns in MEG.
Figure 3.
Figure 3.
Mechanisms of transcriptional regulation correlate with patterns of erythro-megakaryocytic gene expression. (A) Heatmap of mRNA expression in HSPCs, MEG, and ERY with top changed genes clustered into nine groups according to patterns of expression relative to that of HSPCs. Data from four biological replicates are shown for each lineage. In each cluster, a nonbiased selection of top changed genes is shown: (U) up-regulated; (D) down-regulated; (N) no change. For example, cluster 3, labeled “UD,” represents genes that are up-regulated in MEG and down-regulated in ERY versus HSPCs. Total numbers of genes in each cluster, as well as gene function enrichments, are shown in Supplemental Figure 10A. (B) Over- or underrepresentation of transcription factor occupancy within ERY and MEG genes across the nine expression pattern clusters described in A. The enrichment value is a ratio of the fraction of genes in a given cluster occupied by a given transcription factor versus the fraction of occupied genes in the global expressed gene set of 7513 genes. The color-coding shows positive or negative enrichment of transcription factor binding in each gene cluster relative to the genome-wide average of binding probability (indicated by white color). All enrichments shown have P-values < 0.001 by Fisher’s exact test. The right panel shows enrichments of overlapping of MEG GATA1 OSs with indicated transcription factor OSs in HPC-7 hematopoietic progenitor cells (see Fig. 2; Wilson et al. 2010). The bottom panel shows enrichment of transcription factor binding in primed versus nonprimed MEG genes.
Figure 4.
Figure 4.
Characteristics of MEG lineage-primed genes. (A) Box-and-whisker plots of baseline expression levels in HSPCs of MEG-induced genes that are bound by the GATA2/LYL1/TAL1/FLI1/ERG/RUNX1/LMO2 transcription factor heptad in HPC-7 cells (Wilson et al. 2010) versus MEG-induced genes with no heptad occupancy in HPC-7 cells. (B) Color-coded distribution of histone methylation marks in the gene clusters defined in Figure 3A. Numbers indicate percentage of genes with H3K4me3, H3K4me1, and H3K27me3 methylation marks within 0.5 kb surrounding the TSS. (C) Fractions of GATA2/LYL1/TAL1/FLI1/ERG/RUNX1/LMO2 heptad-occupied genes in HPC-7 that are induced, unchanged, or repressed in MEG and ERY development, respectively. The numbers of genes in each group are indicated above the bars.
Figure 5.
Figure 5.
Developmentally regulated loci in erythro-megakaryopoiesis. (A–C) Selected genes are shown with the direction of transcription indicated by arrows and exons represented by black rectangles. ChIP-seq data showing transcription factor occupancy and histone marks in ERY, MEG, and HPC-7 cells are indicated below (Wilson et al. 2010). A GATA1 OS (boxed) in the Bcl2l1 gene (C) overlaps with a KLF1 OS identified previously in murine fetal liver erythroblasts (Tallack et al. 2010). (D) Graphs showing relative expression of Inf2, Itga2b, and Bcl2l1 in HSPCs, MEG, and ERY. (E) Genome-wide intersection of GATA1 OSs from our study with a published genome-wide map of KLF1 OSs in E14.5 mouse fetal liver erythroblasts (Tallack et al. 2010).
Figure 6.
Figure 6.
Distinct properties of GATA1 and GATA2 in late megakaryopoiesis. (A) Venn diagram showing the intersection of GATA1 and GATA2 occupancy peaks (Peaks) and bound genes (Genes) in MEG. (B) Ingenuity Pathway Analysis (IPA) showing predicted functions of genes associated with GATA1- or GATA2-specific chromatin OSs. A negative Z-score predicts mean repression of gene expression in the group, whereas a positive score predicts gene induction. Significantly enriched functional categories with ≥10 proteins and absolute Z-scores > 1, are shown. (C) Examples of GATA2-repressed genes in late megakaryopoiesis. (D) Motif enrichment in the 200-bp sequence centered on the transcription factor peaks at the GATA1- and GATA2-specific OSs, with those of the alternate GATA factor used reciprocally as background. (E) Fraction of up-regulated, unchanged, and down-regulated genes containing GATA1-selective and GATA2-selective OSs. (F) Heatmaps of H3K4me3, H3K4me1, and H3K27me3 histone modification marks centered around the transcription factor binding peaks at GATA1- and GATA2- specific OSs ordered from top to bottom by transcription factor peak significance. (G) Color-coded fractions of GATA1- and GATA2-specific transcription factor binding sites associated with H3K4me3, H3K4me1, and H3K27me3 histone methylation patterns in MEG.
Figure 7.
Figure 7.
A model for developmental regulation of gene expression during erythro-megakaryopoiesis. A stem/progenitor cell-expressed transcription factor “heptad” (GATA2, LYL1, TAL1, ERG, FLI1, RUNX1, and LMO2) binds and transcriptionally primes MEG-specific genes in hematopoietic stem/progenitor cells (HSPCs) (top). Events that occur upon subsequent differentiation of these cells into MEG and ERY are indicated in the middle and bottom panels. Further transcriptional activation of the primed genes in MEG is mediated by GATA switching (replacement of GATA2 by GATA1), ETS factors, and other mechanisms. In most cases, terminal silencing of primed MEG-specific genes in ERY depends on the departure of GATA proteins and MEG-specific transcriptional activators, such as ETS factors, and possible binding of ERY-specific transcriptional repressors. In some instances, terminal repression of MEG-specific genes in ERY appears to be associated with GATA switching and likely relies on recruitment of ERY-specific transcriptional repressors. In addition to the heptad of factors identified in HPC-7 cells (Wilson et al. 2010), the lineage priming “heptad” also likely includes the protein LDB1, which mediates interactions among several of the proteins.

References

    1. Blobel GA, Simon MC, Orkin SH. 1995. Rescue of GATA-1-deficient embryonic stem cells by heterologous GATA-binding proteins. Mol Cell Biol 15: 626–633. - PMC - PubMed
    1. Bouilloux F, Juban G, Cohet N, Buet D, Guyot B, Vainchenker W, Louache F, Morlé F. 2008. EKLF restricts megakaryocytic differentiation at the benefit of erythrocytic differentiation. Blood 112: 576–584. - PubMed
    1. Bresnick EH, Lee HY, Fujiwara T, Johnson KD, Keles S. 2010. GATA switches as developmental drivers. J Biol Chem 285: 31087–31093. - PMC - PubMed
    1. Cheng Y, Wu W, Kumar SA, Yu D, Deng W, Tripic T, King DC, Chen KB, Zhang Y, Drautz D, et al. . 2009. Erythroid GATA1 function revealed by genome-wide analysis of transcription factor occupancy, histone modifications, and mRNA expression. Genome Res 19: 2172–2184. - PMC - PubMed
    1. Chou ST, Khandros E, Bailey LC, Nichols KE, Vakoc CR, Yao Y, Huang Z, Crispino JD, Hardison RC, Blobel GA, et al. . 2009. Graded repression of PU.1/Sfpi1 gene transcription by GATA factors regulates hematopoietic cell fate. Blood 114: 983–994. - PMC - PubMed

Publication types

MeSH terms

Associated data