. 2014 Dec 15;74(24):7205-16.
doi: 10.1158/0008-5472.CAN-14-1913. Epub 2014 Oct 15.

Chemoradiotherapy-induced upregulation of PD-1 antagonizes immunity to HPV-related oropharyngeal cancer

Affiliations

Chemoradiotherapy-induced upregulation of PD-1 antagonizes immunity to HPV-related oropharyngeal cancer

Falguni Parikh et al. Cancer Res. .

Abstract

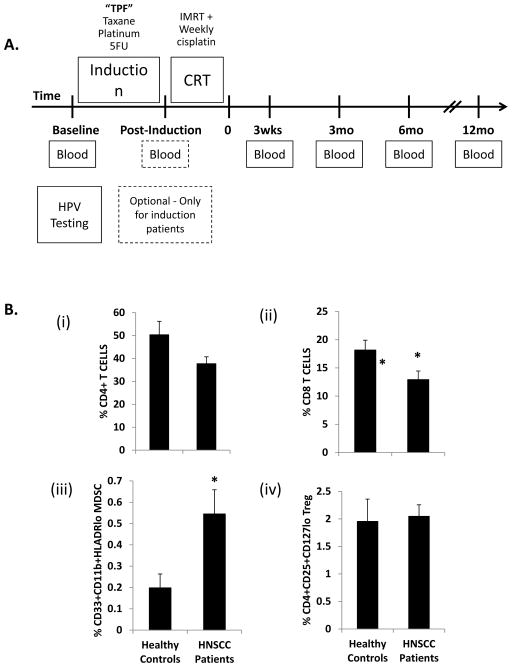
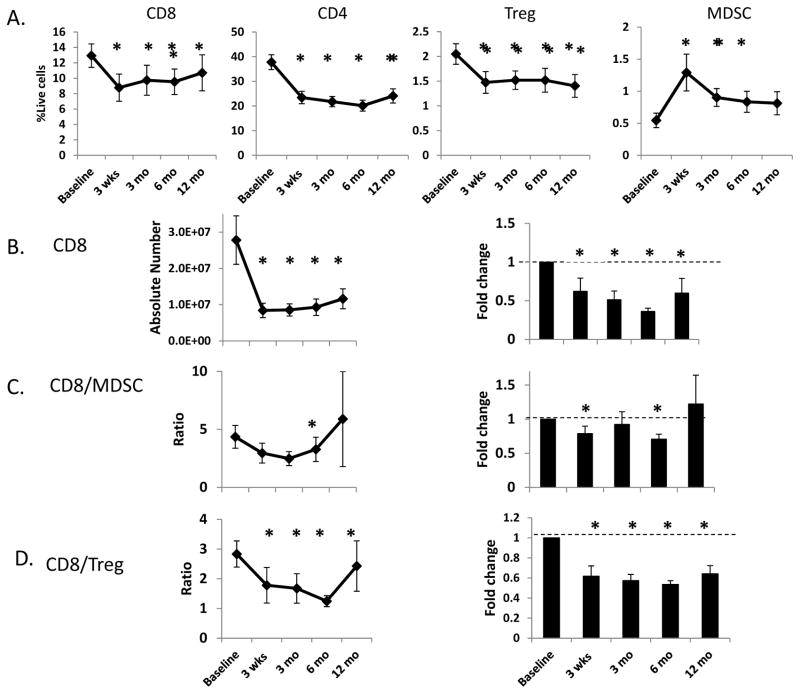
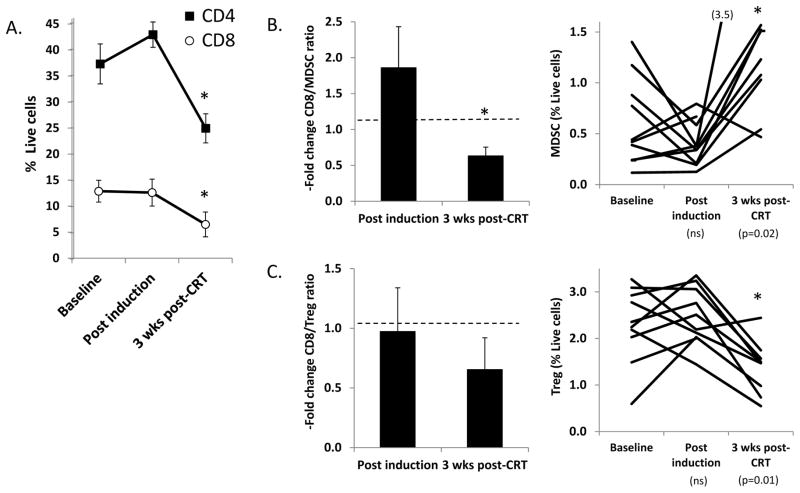
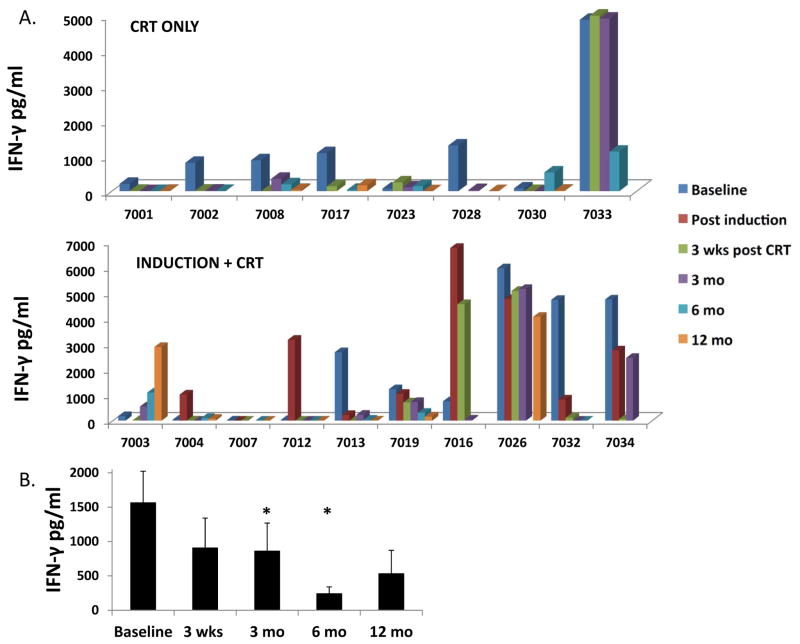
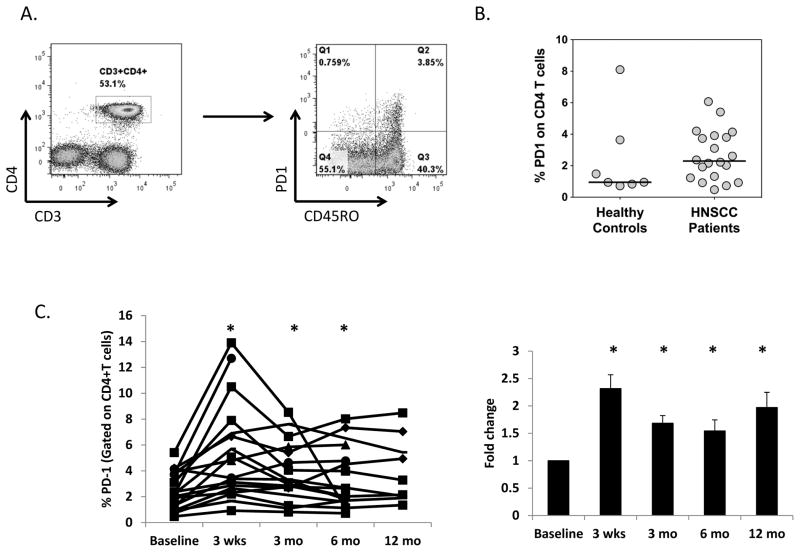
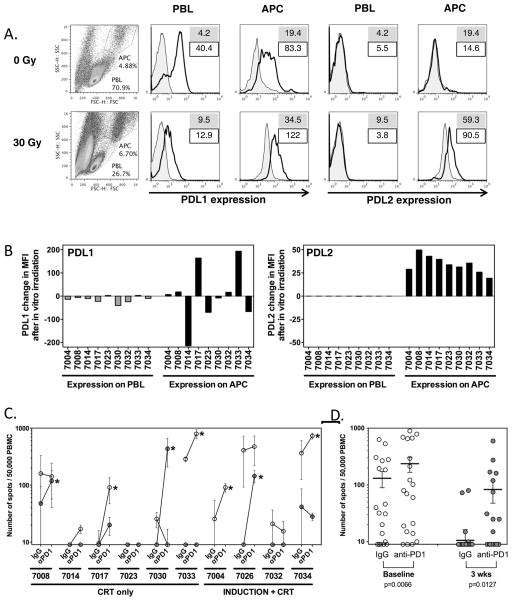
While viral antigens in human papillomavirus (HPV)-related oropharyngeal cancer (HPVOPC) are attractive targets for immunotherapy, the effects of existing standard-of-care therapies on immune responses to HPV are poorly understood. We serially sampled blood from patients with stage III-IV oropharyngeal cancer undergoing concomitant chemoradiotherapy with or without induction chemotherapy. Circulating immunocytes including CD4(+) and CD8(+) T cells, regulatory T cells (Treg), and myeloid-derived suppressor cells (MDSC) were profiled by flow cytometry. Antigen-specific T-cell responses were measured in response to HPV16 E6 and E7 peptide pools. The role of PD-1 signaling in treatment-related immunosuppression was functionally defined by performing HPV-specific T-cell assays in the presence of blocking antibody. While HPV-specific T-cell responses were present in 13 of 18 patients before treatment, 10 of 13 patients lost these responses within 3 months after chemoradiotherapy. Chemoradiotherapy decreased circulating T cells and markedly elevated MDSCs. PD-1 expression on CD4(+) T cells increased by nearly 2.5-fold after chemoradiotherapy, and ex vivo culture with PD-1-blocking antibody enhanced HPV-specific T-cell responses in 8 of 18 samples tested. Chemoradiotherapy suppresses circulating immune responses in patients with HPVOPC by unfavorably altering effector:suppressor immunocyte ratios and upregulating PD-1 expression on CD4(+) T cells. These data strongly support testing of PD-1-blocking agents in combination with standard-of-care chemoradiotherapy for HPVOPC.


Conflict of interest statement

CONFLICT OF INTEREST DISCLOSURE STATEMENT:

The corresponding author is the recipient of an unrestricted industry grant from Advaxis Pharmaceuticals for an investigator-initiated immunotherapy trial for HPV-positive oropharyngeal cancer.

Figures

FIGURE 1
FIGURE 1. Comparison of effector and regulatory immunocyte populations in healthy control and HPV+ HNSCC patients at baseline
(A) Outline of study design. Patients with biopsy-proven HPV+ squamous cell cancer of the oropharynx underwent blood sampling at baseline prior to treatment and at multiple time points after the completion of induction chemotherapy and/or chemoradiation therapy. Patients treated with induction chemotherapy received 3 cycles of TPF (taxane, cisplatin, 5-fluorouracil) prior to concomitant chemoradiation. All patients received a standard course of 7 weeks of concomitant chemoradiation therapy with intensity-modulated radiation therapy (IMRT) and platinum-based chemotherapy. (B) PBMC were harvested from healthy donors (N=7) or study patients (N=19), and flow cytometry performed to determine the relative number of circulating: (i). CD4+ T cells; (ii). CD8+ T cells; (iii). CD33+CD11b+HLADRlo myeloid derived suppressor cells (MDSC); and (iv). CD4+CD25+CD127lo regulatory T cells (Treg). Cancer patients had a significant increase in circulating MDSC, and significant decrease in CD8+ T cells compared to healthy controls. * = p<0.05.
FIGURE 2
FIGURE 2. Effect of chemoradiation on circulating immunocytes
A. Time course of changes in the relative number (expressed as % of all live cells) of effector (CD4+ and CD8+ T cells) and suppressor (CD11b+CD33+MHClo MDSC and CD4+CD127lo Treg) immunocytes before and after treatment. B.–D. Treatment-induced changes in the absolute number CD8+ T cells (B.), and the CD8+/MDSC (C.) and CD8+/Treg (D.) ratios based on absolute numbers (left column) and expressed as the -fold change of these ratios with respect to baseline (right column). * = p<0.05 with respect to baseline.
FIGURE 3
FIGURE 3. Comparison of circulating immunocytes in patients treated with induction chemotherapy
Changes in the circulating immunocytes after induction and completion of CRT. A. Relative number (expressed as % live cells) of CD4+ and CD8+ T cells B. Fold changes in CD8+/MDSC ratio (left) and relative MDSC number (right). C. Fold changes in the CD8+/Treg (left) and relative Treg number (right).
FIGURE 4
FIGURE 4. Effect of chemoradiation on circulating HPV-specific T cell responses
A. Batched analysis of cryopreserved PBMC was performed to determine the level of IFN-γ production after in vitro stimulation with pooled HPV16 E6/E7 peptides at baseline and post-treatment time points. A. Values are shown for patients who received chemoradiation only (upper panel) and from patients who received induction chemotherapy followed by chemoradiation (lower panel). In these graphs, very low or zero values are represented by a flat colored square, whereas missing time points are represented by a blank. All values reflect IFN-γ production from HPV peptide-stimulated PBMC minus the value of PBMC stimulated with irrelevant control peptide. B. Aggregated IFN-γ release data representing averaged data from all patients. * = p<0.05 with respect to baseline.
FIGURE 5
FIGURE 5. Effect of chemoradiotherapy on PD-1 expression on CD4+ T cells
A. Representative FACS plots showing gating scheme of PD-1 and CD45RO expression on CD4+ T cells, gated on all live cells. B. Expression of PD-1 on CD4+ T cells from healthy control donors (N=7) and HPVOPC patients (N=19). C. Percent PD-1+ expressing CD4+ T cells for individual patients (left) and aggregated -fold change with respect to baseline (right). * = p<0.05 with respect to baseline.
FIGURE 6
FIGURE 6. Modulation of PD1 ligand expression and effect of PD1 blockade. A–B. Effect of ex-vivo irradiation on PD-L1 and PD-L2 levels on patient PBMC
A. Representative flow cytometry of PBMC for PD-L1 and PD-L2. Cells were gated independently for lymphocytes and APC based on forward and side scatter. Numbers on histogram plots indicate MFI of isotype control (filled) and PD-L1/PD-L2 mAb (line), respectively. B. Changes in PD-L1 and PD-L2 expression on lymphocytes (PBL) and antigen-presenting cells (APC) from PBMC of patients following in vitro irradiation. The changes in mean fluorescence intensity (MFI) were calculated based on MFI of PDL1 and PDL2 by flow cytometry after subtraction of MFI from respective isotype control, and results were expressed as the differences of these control-adjusted MFI levels before and after in vitro irradiation. Gating of lymphocytes and monocytic/granulocytic populations as above. While radiation increased the overall number of dead cells, viability of PBMC in the APC and PBL gates was >90%. Decrease in PDL1 on PBL and increase in PDL2 on APC after in vitro irradiation were found significant by paired Wilcoxon t test (p=0.0185 and <0.0001 respectively). C. Effect of PD1 blockade on HPV-specific T cell responses. HPV-specific T cell responses measured by ELISPOT in ten patients at baseline and 3 weeks after treatment, in the presence or absence of PD1 blockade. PBMC from individual time points were sensitized with a pool of overlapping long peptides from HPV E6 and E7, cultured in the presence of anti-PD1 mAb or control IgG for 11 days, and assayed for reactivity against the same HPV peptide pool by ELISPOT. Spot numbers indicate HPV-specific IFN-γ secreting T cells out of 50,000 cells tested, following removal of non-specific responses (DMSO control, typically <20 spots). Open and grey symbols indicate responses from samples at baseline and 3 weeks after treatment, respectively. Asterisks indicate samples with a greater than 2x increase in response following PD1 blockade. D. Dot plots showing mean (bar), and standard error of individual replicates from samples of all patients cultured with IgG vs anti-PD1. There were significantly more spots following PD1 blockade both at baseline and 3 weeks after treatment, as shown by paired Wilcoxon t test (p=0.0066 and 0.0127 respectively).

References

    1. Näsman A, Attner P, Hammarstedt L, Du J, Eriksson M, Giraud G, et al. Incidence of human papillomavirus (HPV) positive tonsillar carcinoma in Stockholm, Sweden: an epidemic of viral-induced carcinoma? Int J Cancer J Int Cancer. 2009;125:362–6. - PubMed
    1. Ang KK, Harris J, Wheeler R, Weber R, Rosenthal DI, Nguyen-Tân PF, et al. Human papillomavirus and survival of patients with oropharyngeal cancer. N Engl J Med. 2010;363:24–35. - PMC - PubMed
    1. Fakhry C, Westra WH, Li S, Cmelak A, Ridge JA, Pinto H, et al. Improved survival of patients with human papillomavirus-positive head and neck squamous cell carcinoma in a prospective clinical trial. J Natl Cancer Inst. 2008;100:261–9. - PubMed
    1. Posner MR, Lorch JH, Goloubeva O, Tan M, Schumaker LM, Sarlis NJ, et al. Survival and human papillomavirus in oropharynx cancer in TAX 324: a subset analysis from an international phase III trial. Ann Oncol Off J Eur Soc Med Oncol ESMO. 2011;22:1071–7. - PMC - PubMed
    1. Münger K, Scheffner M, Huibregtse JM, Howley PM. Interactions of HPV E6 and E7 oncoproteins with tumour suppressor gene products. Cancer Surv. 1992;12:197–217. - PubMed

Publication types

MeSH terms

Substances