. 2014 Dec 6;11(101):20140645.
doi: 10.1098/rsif.2014.0645.

Wing tucks are a response to atmospheric turbulence in the soaring flight of the steppe eagle Aquila nipalensis

Affiliations

Wing tucks are a response to atmospheric turbulence in the soaring flight of the steppe eagle Aquila nipalensis

Kate V Reynolds et al. J R Soc Interface. .

Abstract

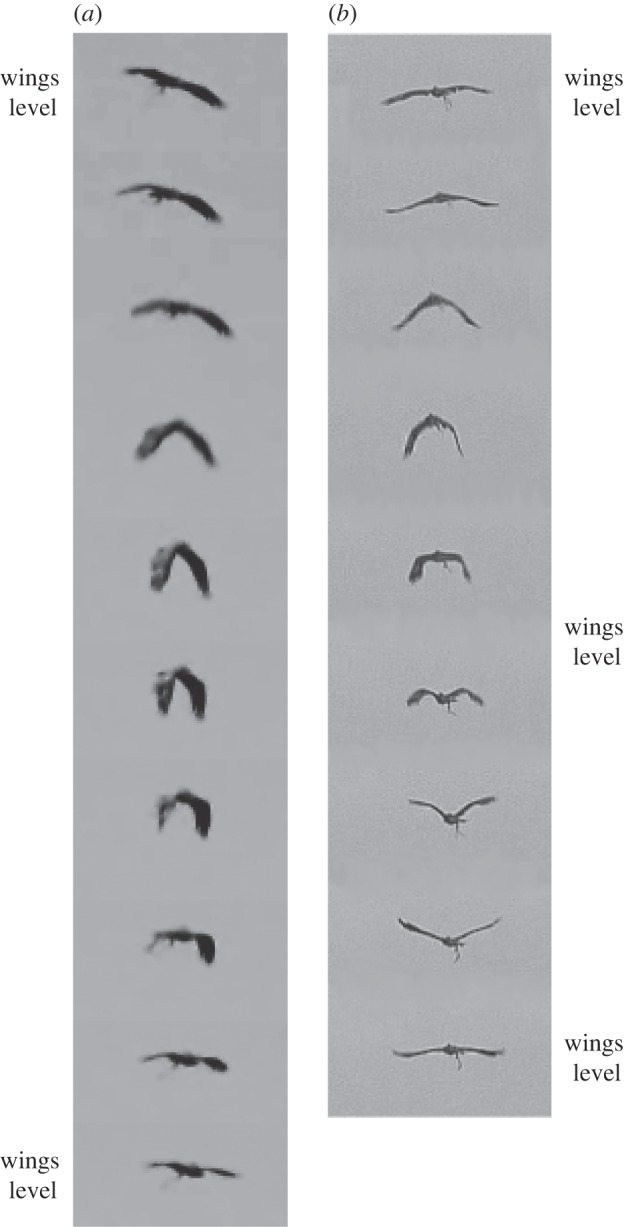
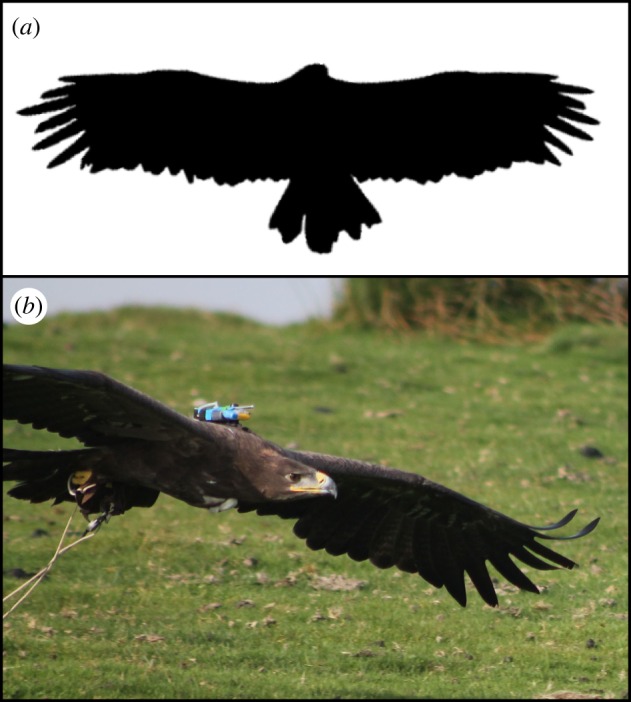
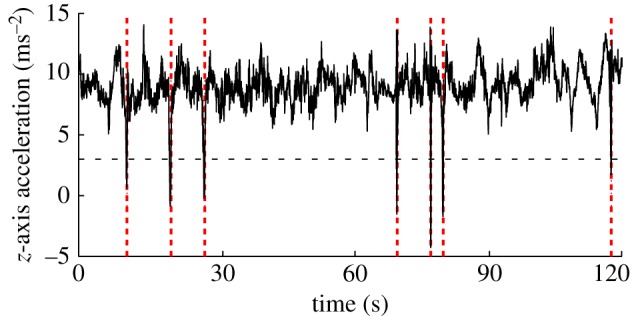
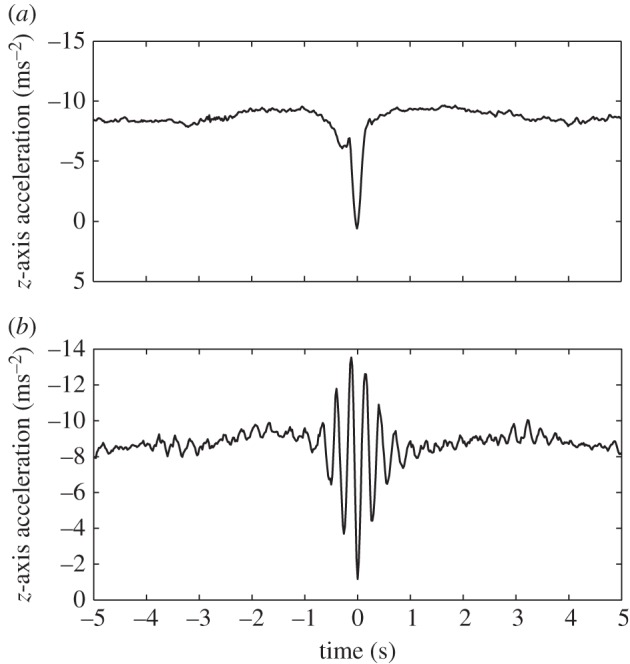
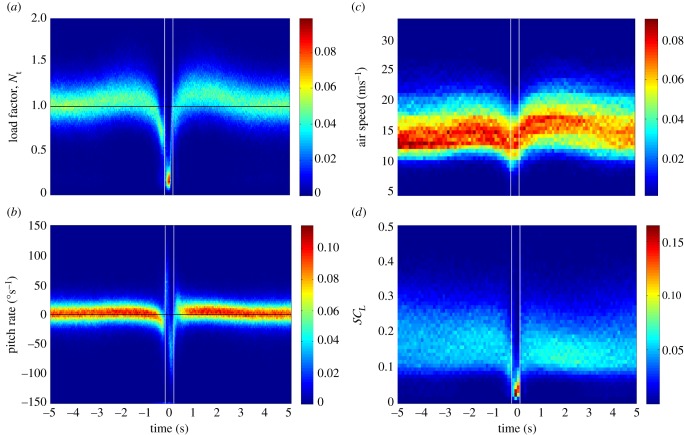
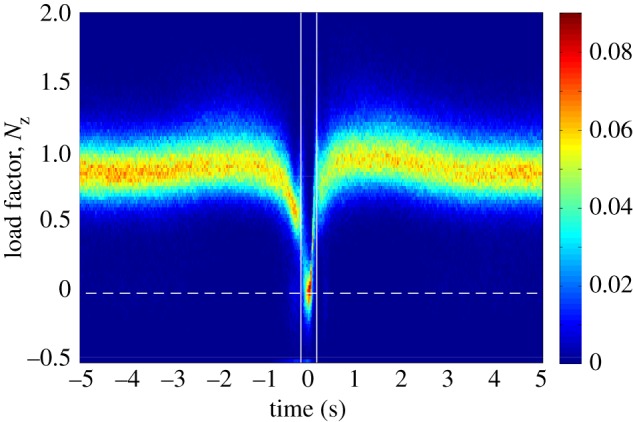
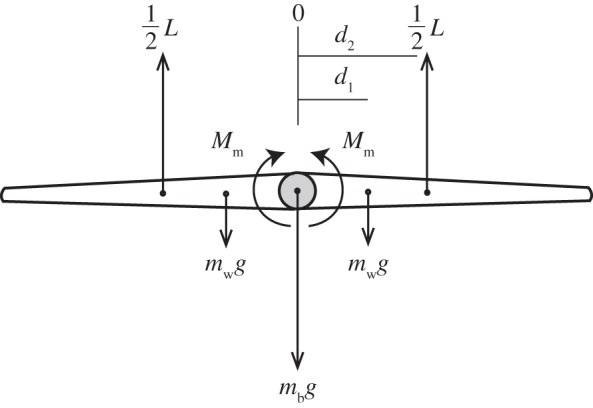
Turbulent atmospheric conditions represent a challenge to stable flight in soaring birds, which are often seen to drop their wings in a transient motion that we call a tuck. Here, we investigate the mechanics, occurrence and causation of wing tucking in a captive steppe eagle Aquila nipalensis, using ground-based video and onboard inertial instrumentation. Statistical analysis of 2594 tucks, identified automatically from 45 flights, reveals that wing tucks occur more frequently under conditions of higher atmospheric turbulence. Furthermore, wing tucks are usually preceded by transient increases in airspeed, load factor and pitch rate, consistent with the bird encountering a headwind gust. The tuck itself immediately follows a rapid drop in angle of attack, caused by a downdraft or nose-down pitch motion, which produces a rapid drop in load factor. Positive aerodynamic loading acts to elevate the wings, and the resulting aerodynamic moment must therefore be balanced in soaring by an opposing musculoskeletal moment. Wing tucking presumably occurs when the reduction in the aerodynamic moment caused by a drop in load factor is not met by an equivalent reduction in the applied musculoskeletal moment. We conclude that wing tucks represent a gust response precipitated by a transient drop in aerodynamic loading.

Keywords: atmospheric turbulence; bird flight; gust alleviation; gust response; soaring; wing tuck.


Figures

Figure 1.
Figure 1.
(a) Sequence of video frames showing a typical wing tuck. (b) Sequence of video frames showing a typical wingbeat, which is easily distinguishable from a tuck on account of its shorter period, and the fact that the wings are raised above the body before being returned to a level configuration. Time interval between frames: 0.033 s. Complete animations of these video sequences are provided in the electronic supplementary material, videos S1 and S2.
Figure 2.
Figure 2.
(a) Thresholded digital photograph of the bird's planform taken from directly below when the bird was gliding in a typical soaring posture with its wings fully outstretched (wing span = 1.9 m, from tip to tip). The irregular outline of the wings and tail reflects the state of the feathers, some of which were recently moulted. (b) Photograph of bird showing instrumentation unit mounted dorsally.
Figure 3.
Figure 3.
Plot of measured z-acceleration against time for one randomly chosen section of flight lasting 2 min. The seven wing tucks (vertical dashed lines) occurring in this sequence were identified automatically as sections of flight for which the correlation with the tuck template (figure 4) was >0.45, and during which the magnitude of the z-acceleration dropped below 3 ms−2 (horizontal dashed line). (Online version in colour.)
Figure 4.
Figure 4.
(a) Tuck template, defined as the time history of the z-acceleration (αz), averaged over the 80 tucks which we manually identified from the ground-based video, aligned with respect to the peak in αz at t = 0 s. (b) Flapping template, defined as the time history of αz, averaged over 69 manually identified wingbeats and aligned similarly. Because wingbeats rarely occur singly, the template shows multiple peaks, each representing a single wing beat; the attenuation of the wingbeats to either side of the middle wingbeat is an effect of the averaging method used to construct the template, but has no adverse effect upon wingbeat identification. Wingbeat frequency is approximately 3 Hz. Note that, in contrast to the tuck template, the wingbeat template shows approximately symmetric, rather than one-sided, changes in αz.
Figure 5.
Figure 5.
Two-dimensional histograms for all 2594 automatically identified tucks showing the temporal variation in the frequency density of (a) instantaneous total load factor, Nt; (b) pitch rate q, signed positive in a nose-up direction; (c) airspeed, U; and (d) SCL, representing the product of wing area (S) and lift coefficient (CL). All times are referenced to the point of minimum load factor Nz = −αz/g for each tuck at t = 0 s, as calculated from the z-component of acceleration (αz). The colour bars to the right of each histogram relate the colour of each point on the histogram to the proportion of the sampled tucks at that time to which it corresponds. The data were binned into 100 bins for load factor and pitch rate, which were sampled at 50 Hz; 50 bins were used for airspeed and SCL, which were sampled at a lower rate of 10 Hz. The approximate beginning and end of the tucking movement of the wings, inferred from the discontinuities in the distributions for load factor and SCL, are denoted by the vertical white lines.
Figure 6.
Figure 6.
Data for five individual tucks randomly selected from the 2594 automatically identified tucks, showing (a) instantaneous total load factor, Nt; (b) pitch rate q, signed positive in a nose-up direction; (c) airspeed, U; and (d) SCL, representing the product of wing area (S) and lift coefficient (CL).
Figure 7.
Figure 7.
Two-dimensional histogram for all 2594 automatically identified tucks, with 100 bins showing the temporal variation in the frequency density of the instantaneous load factor Nz = −αz/g as calculated from the z-component of acceleration (αz). All times are referenced to the point of minimum load factor Nz for each tuck at t = 0 s. The colour bar relates the colour of each point on the histogram to the proportion of the sampled tucks at that time to which it corresponds. The approximate beginning and end of the tucking movement are denoted by the vertical white lines, as in figure 5. The dashed horizontal white line denotes zero load factor.
Figure 8.
Figure 8.
Model of the forces and moments acting on the bird's wings and body. Two rigid wings of mass mw are assumed to be connected to the body at a single pivot point at which the mass of the body mb is concentrated. Each wing generates half of the total lift L, which acts at the centre of pressure. The lengths d1 and d2 measure the distance from the wing's pivot to the wing's centre of mass and to the wing's centre of pressure, respectively. Mm is an applied musculoskeletal moment, signed positive in the direction of wing elevation.

References

    1. Thomas ALR, Taylor GK. 2001. Animal flight dynamics I. Stability in gliding flight. J. Theor. Biol. 212, 399–424. (10.1006/jtbi.2001.2387) - DOI - PubMed
    1. Taylor GK, Thomas ALR. 2002. Animal flight dynamics II. Longitudinal stability in flapping flight. J. Theor. Biol. 214, 351–370. (10.1006/jtbi.2001.2470) - DOI - PubMed
    1. Sachs G. 2005. Yaw stability in gliding birds. J. Ornithol. 146, 191–199. (10.1007/s10336-005-0078-5) - DOI
    1. Sachs G. 2005. Aerodynamic yawing moment characteristics of bird wings. J. Theor. Biol. 234, 471–478. (10.1016/j.jtbi.2004.12.001) - DOI - PubMed
    1. Sachs G. 2007. Tail effects on yaw stability in birds. J. Theor. Biol. 249, 464–472. (10.1016/j.jtbi.2007.07.014) - DOI - PubMed

Publication types

LinkOut - more resources