. 2014 Nov 28;289(48):33364-77.
doi: 10.1074/jbc.M114.590125. Epub 2014 Oct 15.

Oligomerization, membrane association, and in vivo phosphorylation of sugarcane UDP-glucose pyrophosphorylase

Affiliations

Oligomerization, membrane association, and in vivo phosphorylation of sugarcane UDP-glucose pyrophosphorylase

Jose Sergio M Soares et al. J Biol Chem. .

Abstract

Sugarcane is a monocot plant that accumulates sucrose to levels of up to 50% of dry weight in the stalk. The mechanisms that are involved in sucrose accumulation in sugarcane are not well understood, and little is known with regard to factors that control the extent of sucrose storage in the stalks. UDP-glucose pyrophosphorylase (UGPase; EC 2.7.7.9) is an enzyme that produces UDP-glucose, a key precursor for sucrose metabolism and cell wall biosynthesis. The objective of this work was to gain insights into the ScUGPase-1 expression pattern and regulatory mechanisms that control protein activity. ScUGPase-1 expression was negatively correlated with the sucrose content in the internodes during development, and only slight differences in the expression patterns were observed between two cultivars that differ in sucrose content. The intracellular localization of ScUGPase-1 indicated partial membrane association of this soluble protein in both the leaves and internodes. Using a phospho-specific antibody, we observed that ScUGPase-1 was phosphorylated in vivo at the Ser-419 site in the soluble and membrane fractions from the leaves but not from the internodes. The purified recombinant enzyme was kinetically characterized in the direction of UDP-glucose formation, and the enzyme activity was affected by redox modification. Preincubation with H2O2 strongly inhibited this activity, which could be reversed by DTT. Small angle x-ray scattering analysis indicated that the dimer interface is located at the C terminus and provided the first structural model of the dimer of sugarcane UGPase in solution.

Keywords: Gene Expression; Kinetics; Protein Phosphorylation; Redox Regulation; Small Angle X-ray Scattering (SAXS); Sucrose.


Figures

FIGURE 1.
FIGURE 1.
Relative expression of ScUGPase-1 as determined by RT-qPCR from two sugarcane cultivars contrasting in sucrose content. A, real-time PCR results for the sugarcane cultivar RB855156 with a high sucrose content. B, real-time PCR results for the sugarcane cultivar RB 935744 with a low sucrose content. The reactions were performed in triplicate. *, p < 0.05. Error bars, S.D.
FIGURE 2.
FIGURE 2.
Immunoblotting analysis of the membrane and soluble fraction of ScUGPase-1 in the internodes and leaves. Shown are immunoblots of the internodes (A) and leaves (B) using an anti-HvUGPase antibody. The numbers indicate the proteins of the microsomal fraction (1), the proteins of the soluble fraction (2), and the ScUGPase-1 recombinant protein (3). M, molecular mass standard.
FIGURE 3.
FIGURE 3.
Multiple-sequence alignment of UGPases from different plant species. Shown are accession number KF278717 (Saccharum spp. UGPase), accession number ACG32096 (Zea mays UGPase), accession number ACA50487 (Oryza sativa UGPase), accession number CAA62689 (Hordeum vulgare UGPase), accession number XP_002453185 (Sorghum bicolor UGPase), and accession number P19595 (A. thaliana UGPase). The blue triangle indicates the serine that is predicted to be phosphorylated at the 14-3-3 binding site.
FIGURE 4.
FIGURE 4.
Phosphorylation analysis of the membrane and soluble fraction of ScUGPase-1 in the internodes and leaves. Shown are immunoblots of the internodes (A) and leaves (B) using an anti-pS419 antibody. The numbers indicate the proteins of the microsomal fraction (1), the proteins of the soluble fraction (2), and the ScUGPase-1 recombinant protein (3). M, molecular mass standard.
FIGURE 5.
FIGURE 5.
Subcellular localization of GFP-ScUGPase-1. A, pRT104::ScUGPase-1-GFP construction map. B, confocal microscopy of an onion epidermis cell expressing the GFP-ScUGPase-1. Bars, 100 μm.
FIGURE 6.
FIGURE 6.
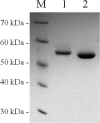
SDS-PAGE of the recombinant ScUGPase-1. Shown are the His6-tagged ScUGPase-1 (1) and recombinant ScUGPase-1 (2) after cleavage with the rTEV protease. M, molecular mass standard. After electrophoresis, the gel was stained with Coomassie Blue.
FIGURE 7.
FIGURE 7.
Saturation curves for the recombinant ScUGPase-1. A, Glc-1-P concentration ranging from 0 to 2.5 mm. B, UTP concentration ranging from 0 to 3.5 mm. C, Mg2+ concentration ranging from 0 to 20 mm. When each substrate was analyzed, the other two substrates were maintained at a fixed saturation concentration.
FIGURE 8.
FIGURE 8.
Redox regulation of the recombinant ScUGPase-1 activity. A, inactivation of ScUGPase-1 by different concentrations of H2O2. B, effect of the reducing agent DTT on oxidized ScUGPase-1. Error bars, S.E.
FIGURE 9.
FIGURE 9.
SAXS analysis of the ScUGPase-1 constructs in solution. A, final monomer scattering curve (open squares) with an inset showing the linear fitting in the Guinier region. The solid line corresponds to the fitting of the theoretical curve that was calculated for the ScUGPase-1 monomer that was obtained by computational methods. A χ value of 2.55 was obtained with CRYSOL (36) up to a qmax = 0.25, as shown in the plot. Values as low as 1.44 were obtained, limiting the range to 0.20 Å−1 and indicating a correspondence of the gross low resolution features of the scattering particle in solution and the monomer rigid model. B, solution scattering profile (open circles) of the ScUGPase-1 dimer in the q range that was limited after data processing. Inset, linear fitting that was obtained from the Guinier analysis. The solid line corresponds to the fitting of the theoretical curve as calculated for the computational dimer model in the same range that was automatically refined by PRIMUS/AUTOGNOM (24) during the indirect Fourier transform procedure. The discrepancy between the experimental data and the theoretical curve was calculated by CRYSOL, resulting in a χ value of 1.45. C, Kratky plot that was derived from the experimental curves that were normalized for I(0) = 1 for proper visualization. After buffer scattering subtraction, a few negative intensity points were obtained for the dimer curve at higher q values due to the very low sample concentration. The plot is limited to the region Iq2 > 0. D, distance distribution function as calculated from the experimental curve that was used for the ab initio envelope reconstruction. The monomer P(r) (open squares) exhibits a nearly centered peak, indicating a globular scattering particle. For the second sample, a typical profile with two clearly distinct maxima indicates the presence of a dimer in solution, as anticipated by the molecular mass estimates; the higher peak to the left of the center of the range indicates that the dimer exhibits a prolate shape.
FIGURE 10.
FIGURE 10.
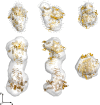
PyMOL surface representations of the monomer (top row) and dimer (bottom row) as recovered from the experimental SAXS data that were superposed onto the respective computational models, represented as a schematic drawing and viewed nearly along the point group P2 dimer symmetry. The solvent layer sparsely distributed over the protein surface, as calculated by GASBOR (31), is shown as spheres. For the dimer, each monomer chain is shown in different hues of yellow; the N terminus containing the His6 tag, disordered in solution as indicated by the computational analysis, was omitted for clarity. The scale and perspectives are the same in both rows. The middle and right columns are rotated clockwise by 90° around the y and x axes, respectively. The figures were prepared with PyMOL and edited using GIMP under Slackware Linux.

Similar articles

Cited by

References

    1. Waclawovsky A. J., Sato P. M., Lembke C. G., Moore P. H., Souza G. M. (2010) Sugarcane for bioenergy production: an assessment of yield and regulation of sucrose content. Plant Biotechnol. J. 8, 263–276 - PubMed
    1. Matsuoka S., Ferro J., Arruda P. (2009) The Brazilian experience of sugarcane ethanol industry. Vitr. Cell. Dev. Biol. Plant 45, 372–381
    1. Arruda P. (2012) Genetically modified sugarcane for bioenergy generation. Curr. Opin. Biotechnol. 23, 315–322 - PubMed
    1. Botha F. C., Black K. G. (2000) Sucrose phosphate synthase and sucrose synthase activity during maturation of internodal tissue in sugarcane. Funct. Plant Biol. 27, 81–85
    1. Chen R., Zhao X., Shao Z., Wei Z., Wang Y., Zhu L., Zhao J., Sun M., He R., He G. (2007) Rice UDP-glucose pyrophosphorylase1 is essential for pollen callose deposition. Plant Cell 19, 847–861 - PMC - PubMed

Publication types

MeSH terms

Substances

LinkOut - more resources