Clinical Trial
. 2014 Nov 28;289(48):33215-30.
doi: 10.1074/jbc.M114.608927. Epub 2014 Oct 15.

A single mechanism can explain network-wide insulin resistance in adipocytes from obese patients with type 2 diabetes

Affiliations
Clinical Trial

A single mechanism can explain network-wide insulin resistance in adipocytes from obese patients with type 2 diabetes

Elin Nyman et al. J Biol Chem. .

Abstract

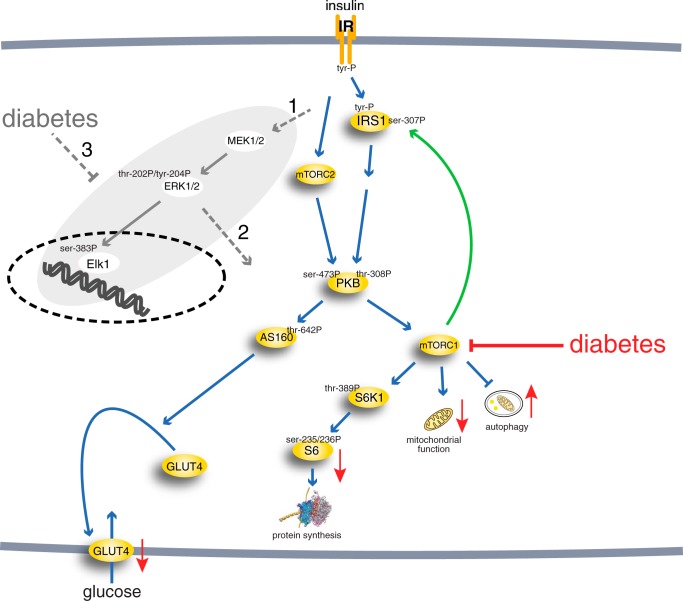
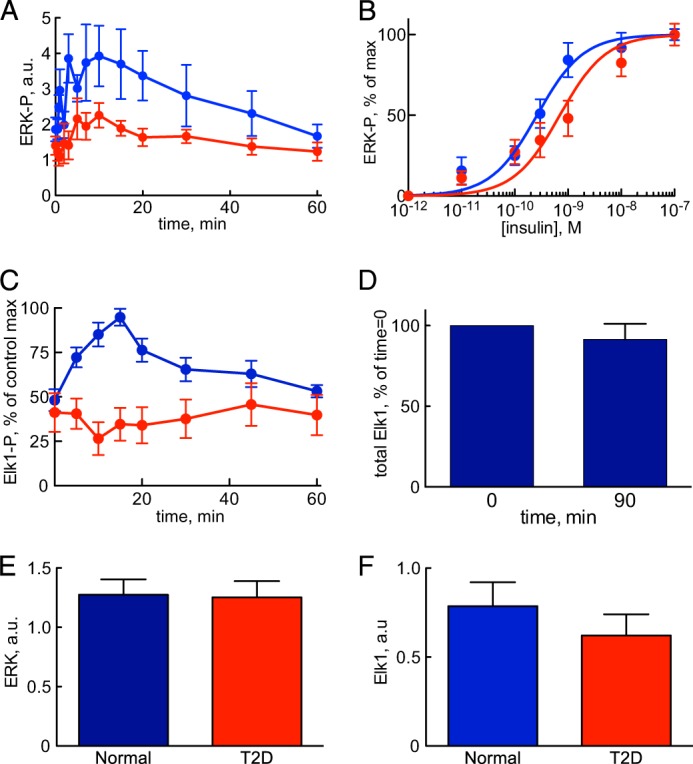
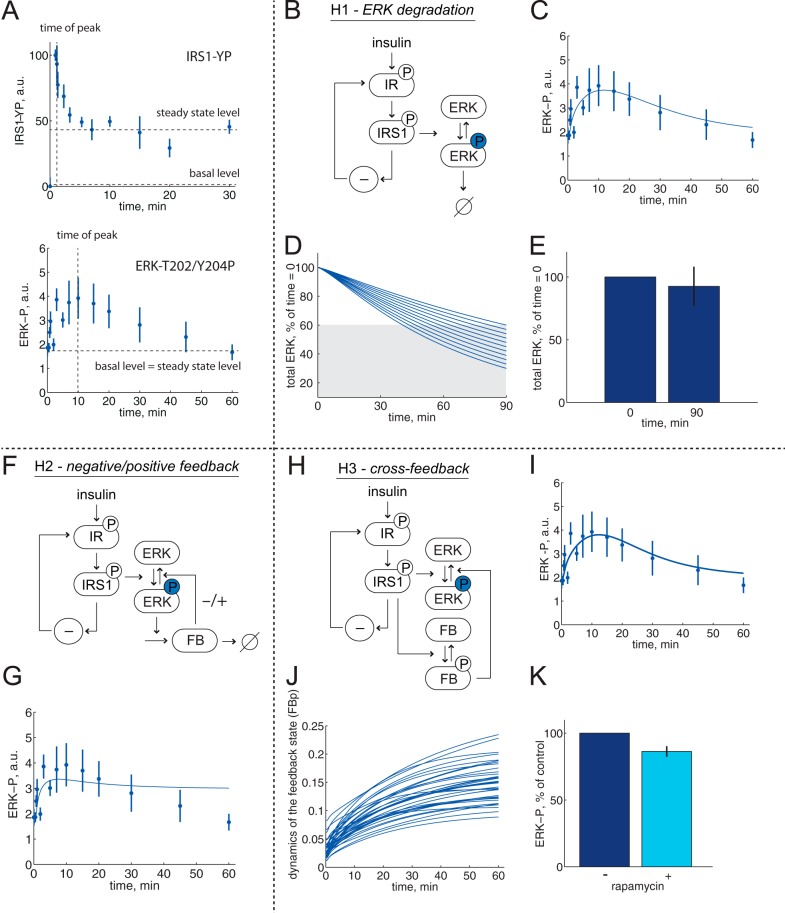
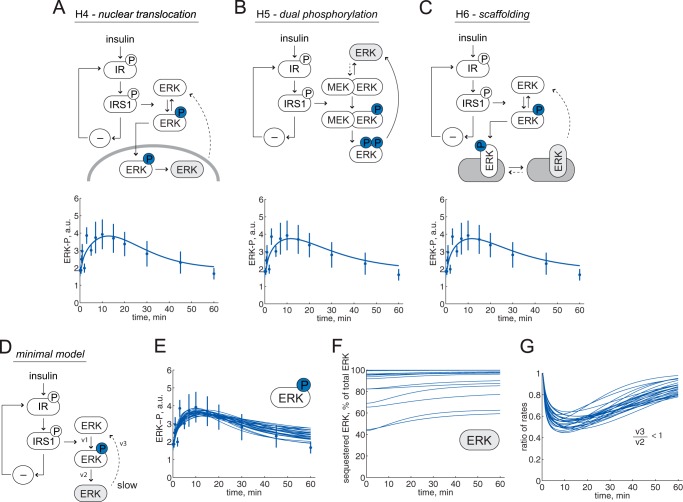
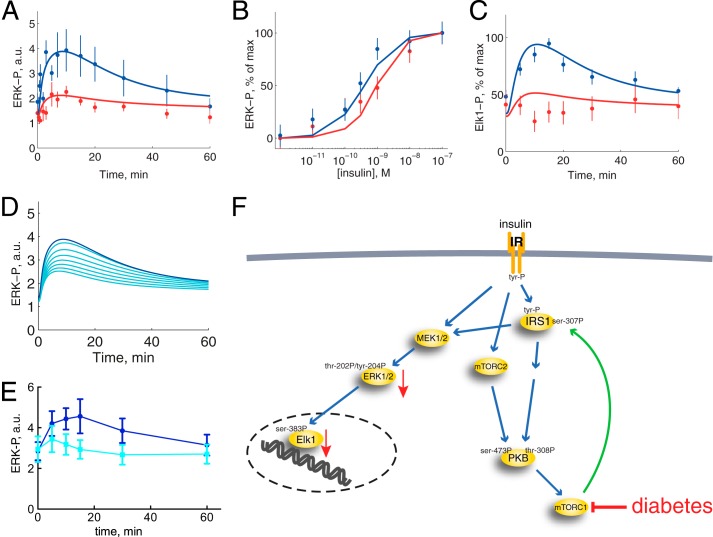
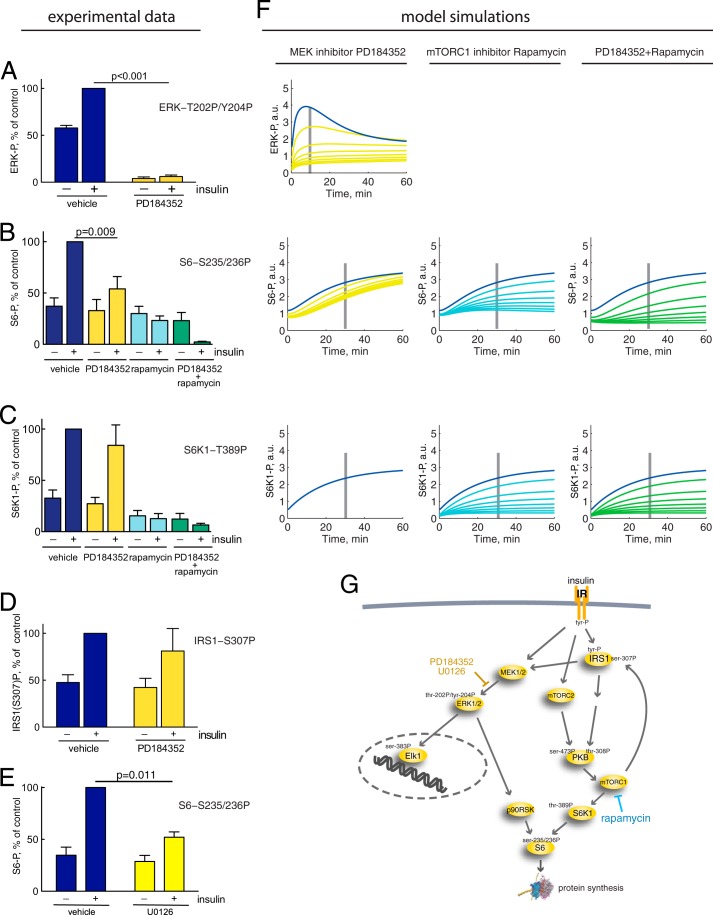
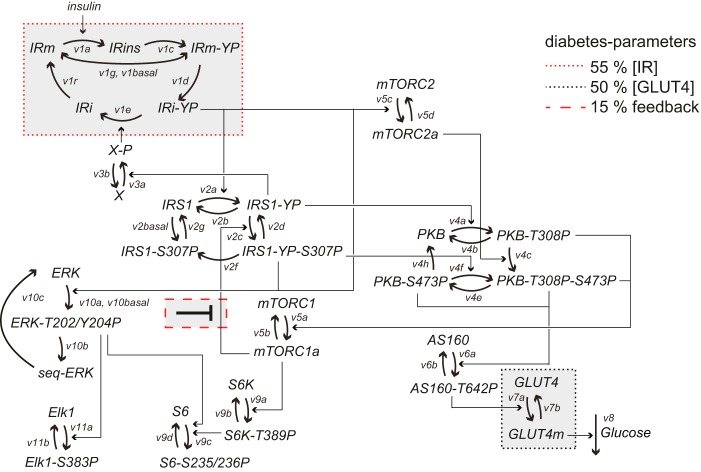
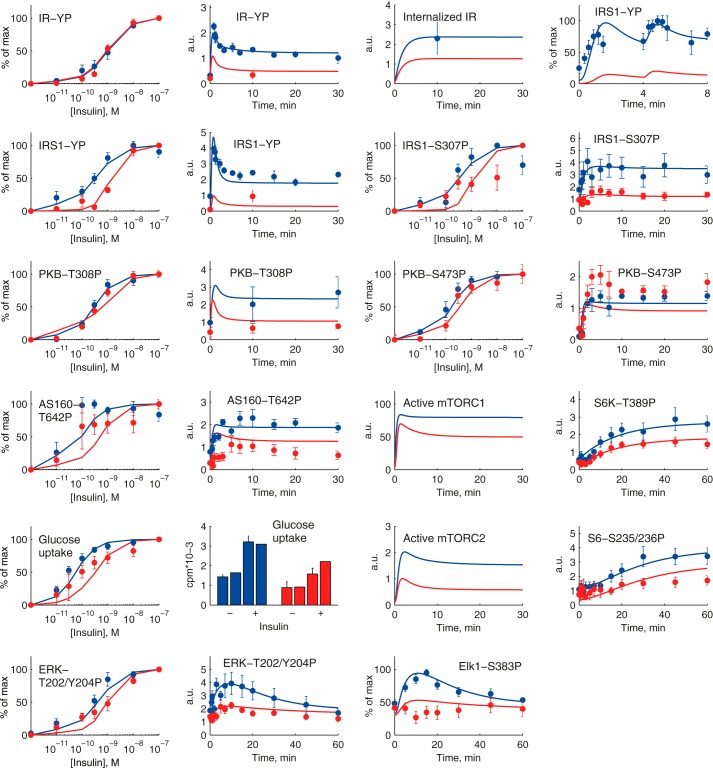
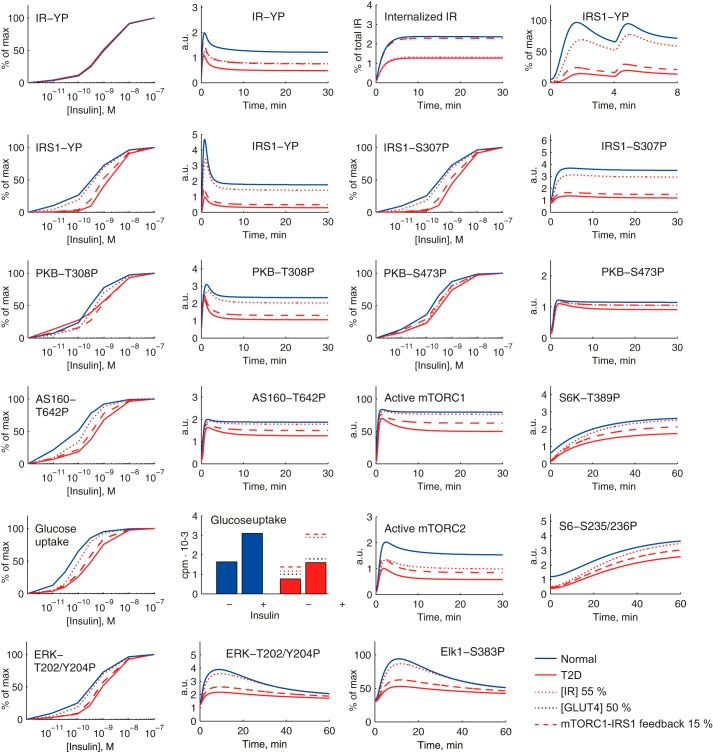
The response to insulin is impaired in type 2 diabetes. Much information is available about insulin signaling, but understanding of the cellular mechanisms causing impaired signaling and insulin resistance is hampered by fragmented data, mainly obtained from different cell lines and animals. We have collected quantitative and systems-wide dynamic data on insulin signaling in primary adipocytes and compared cells isolated from healthy and diabetic individuals. Mathematical modeling and experimental verification identified mechanisms of insulin control of the MAPKs ERK1/2. We found that in human adipocytes, insulin stimulates phosphorylation of the ribosomal protein S6 and hence protein synthesis about equally via ERK1/2 and mTORC1. Using mathematical modeling, we examined the signaling network as a whole and show that a single mechanism can explain the insulin resistance of type 2 diabetes throughout the network, involving signaling both through IRS1, PKB, and mTOR and via ERK1/2 to the nuclear transcription factor Elk1. The most important part of the insulin resistance mechanism is an attenuated feedback from the protein kinase mTORC1 to IRS1, which spreads signal attenuation to all parts of the insulin signaling network. Experimental inhibition of mTORC1 using rapamycin in adipocytes from non-diabetic individuals induced and thus confirmed the predicted network-wide insulin resistance.

Keywords: Adipocyte; Elk1; Extracellular Signal-regulated Kinase (ERK); Human; Insulin Resistance; MAPK; Mathematical Modeling; Protein Phosphorylation; Signal Transduction; Type 2 Diabetes.


Figures

FIGURE 1.
FIGURE 1.
The insulin signaling network. Examined phosphorylation sites in signaling intermediaries are indicated (-P). mTORC2, mammalian target of rapamycin in complex with rictor and Elk1 (ETS domain-containing protein). The green arrow indicates positive feedback signal. Red arrows indicate functional effects of insulin-resistant insulin signaling in T2D. The gray area indicates the focus of this investigation, with dashed gray arrows indicating outstanding questions answered herein: whether the MAPK pathway is controlled via IRS1, another adapter protein or both (1); whether ERK1/2 signaling cross-talks with the other branches of the insulin signaling network (2); and to what extent ERK1/2 signaling is affected in T2D and whether the same mechanisms are involved as in the rest of the signaling network (3).
FIGURE 2.
FIGURE 2.
Insulin control of phosphorylation of ERK1/2 and Elk1 normally and in T2D. Shown are results from adipocytes obtained from non-diabetic controls (blue) and from patients with T2D (red). Shown are the average ± S.E. (error bars) of cell preparations from the indicated number of subjects. Examined phosphorylation sites are shown in Fig. 1. A, time course for phosphorylation of ERK1/2-Thr202/Tyr204-P in response to 10 nm insulin for the indicated times. Adipocytes from seven non-diabetic control subjects (age 31–72, average 54 years; BMI 24–47, average 30 kg/m2) and seven patients with type 2 diabetes (age 27–79, average 61 years; BMI 28–60, average 39 kg/m2) were analyzed. B, dose response for phosphorylation of ERK1/2-Thr202/Tyr204-P in response to indicated concentration of insulin for 10 min. Adipocytes from 12 non-diabetic control subjects (age 29–77, average 58 years; BMI 22–39, average 27 kg/m2) and 13 patients with type 2 diabetes (age 48–76, average 61 years; BMI 28–48, average 36 kg/m2) were analyzed (59). C, time course for phosphorylation of Elk1-Ser383-P in response to 10 nm insulin for the indicated times. Adipocytes from five non-diabetic control subjects (age 51–61, average 58 years; BMI 25–28, average 26 kg/m2) and five patients with type 2 diabetes (age 44–82, average 67 years; BMI 29–52, average 40 kg/m2) were analyzed. D, total amount of Elk1 protein in adipocytes before and after incubation with insulin. Adipocytes were incubated without or with insulin for 90 min, when the total amount of Elk1 protein was determined by SDS-PAGE and immunoblotting. Results expressed as a percentage of time 0 ± S.E., n = 3 cell preparations from different subjects. E, total amount of ERK1/2 protein. Adipocytes from 11 non-diabetic control subjects (age 33–91, average 63 years; BMI 19–30, average 25 kg/m2) and 10 patients with type 2 diabetes (age 28–81, average 54 years; BMI 27–49, average 36 kg/m2) were analyzed. F, total amount of Elk1 protein. Adipocytes from 10 non-diabetic control subjects (age 33–91, average 61 years; BMI 19–30, average 25 kg/m2) and 10 patients with type 2 diabetes (age 28–81, average 54 years; BMI 27–49, average 36 kg/m2) were analyzed. a.u., arbitrary units.
FIGURE 3.
FIGURE 3.
Minimal model analysis of ERK1/2 dynamics; rejected hypotheses. Model structures with insulin signal input to control of ERK1/2, via IR and IRS1 (1). Reactions of ERK1/2 are shown with arrows; phosphorylated ERK1/2 is shown with a circled P. A, different dynamics of phosphorylation of IRS1 and of ERK1/2 in response to insulin. Experimental observations after the addition of 10 nm insulin reveal a late time of maximal ERK1/2-Thr202/Tyr204-P and a return to basal level (bottom; data from Fig. 2), compared with IRS1-YP (from Ref. 1), which exhibits an elevated steady-state level of ∼50% of the maximal level (top). B–E, hypothesis H1(ERK1/2 degradation). B, model structure. φ, ERK1/2 degradation. C, model simulation (line) for ERK1/2 phosphorylation dynamics. The best agreement with data (dots ± S.E.) is shown. D, total amount of ERK1/2 must be reduced to 60% at 90 min if the degradation hypothesis shall describe the dynamics of ERK1/2 phosphorylation. The different lines correspond to different simulations with stepwise reduction of total amount of ERK1/2 at 90 min while also fitting with ERK1/2 phosphorylation dynamics. E, experimental test of the prediction; the total amount of ERK1/2 was not significantly reduced at 90 min incubation with insulin, average ± S.E. in cells from three subjects. F and G, hypothesis H2 (negative/positive feedback). F, model structure. FB, the dynamic state that governs the negative or positive feedback. G, negative feedback mechanisms cannot describe ERK1/2 phosphorylation dynamics. The best agreement between the model (line) and data (dots ± S.E.) is shown. H–K, hypothesis H3 (cross-feedback). H, model structure. FB, the dynamic state that governs the negative cross-feedback. I, model simulation (line) for ERK1/2 phosphorylation dynamics. The best agreement with the data (dots ± S.E.) is shown. J, simulations for an approximation of all acceptable parameters reveal a slow insulin response with maximal activation of the feedback after >60 min. K, rapamycin inhibition of mTORC1 did not significantly increase the ERK1/2-Thr202/Tyr204 phosphorylation at 60 min of incubation with insulin, average ± S.E. in cells from five subjects (for experimental details, see Fig. 6E). a.u., arbitrary units.
FIGURE 4.
FIGURE 4.
Minimal model analysis of ERK1/2 dynamics, an accepted hypothesis. Reactions of ERK1/2 are shown with arrows; phosphorylated ERK1/2 is shown with a circled P. Model structures with insulin signal input to control of ERK1/2, via IR and IRS1 (1). The accumulating ERK1/2 state is shown in light gray, and dashed arrows are shown for reaction rates that have to be slow for the hypotheses to explain ERK1/2 dynamics. A, the model structure of hypothesis H4 (nuclear translocation) and the best fit simulation (line) compared with data (dots ± S.E.). B, the model structure of hypothesis H5 (dual phosphorylation) and the best fit simulation (line) compared with data (dots ± S.E.). C, the model structure of hypothesis H6 (scaffolding) and the best fit simulation (line) compared with data (dots ± S.E.). D–G, a common minimal model. D, the minimal model of ERK1/2 phosphorylation dynamics consists of three states, three rate reactions (v1–v3), and three parameters. E, simulations for an approximation of all acceptable parameters (lines) show the agreement with data (dots ± S.E.). F, simulations that agree with data reveal that the sequestered pool of ERK1/2 has to be >40%. G, simulations that agree with data show that the ratio between ERK1/2 transition (v3) and ERK1/2 dephosphorylation (v2) is always <1 (i.e. the transition is always slower than the dephosphorylation). a.u., arbitrary units.
FIGURE 5.
FIGURE 5.
Localization of ERK1/2 in a human adipocyte. Adipocytes were immunostained with fluorescent antibodies against ERK1 (green fluorescence), stained for nuclei with DAPI (blue fluorescence) (A and C), and examined by fluorescence confocal microscopy. One cell is shown, with a single plane through the nucleus (A and B) and a three-dimensional stack of the perimeter of the cell containing the nucleus (C and D). A scale bar is also shown.
FIGURE 6.
FIGURE 6.
Comparison of model simulations with experimental data for ERK1/2 and Elk1 phosphorylation in the non-diabetic and T2D states. Shown are model simulations (lines) and experimental data (dots with error bars (S.E.); from Fig. 1) for the non-diabetic state (blue) and in T2D (red). A, time course of ERK1/2-Thr202/Tyr204-P in response to 10 nm insulin for the indicated times, scaled with a normalization constant for best fit with experimental data normally. B, dose response of ERK1/2-Thr202/Tyr204-P in response to the indicated concentrations of insulin for 10 min and normalized 0–100%. C, time course of Elk1-Ser383-P in response to 10 nm insulin for the indicated times, scaled with a normalization constant for best fit with experimental data normally. D, simulations of model variable ERK1/2-Thr202/Tyr204-P (blue) when the effect of mTORC1 inhibitor rapamycin is implemented as reduced mTORC1 activation by 50, 75, 83, 88, 90, 92, and 93% (cyan). E, effect of 50 nm rapamycin (cells preincubated 30 min) on the time course for phosphorylation of ERK1/2-Thr202/Tyr204 in response to 10 nm insulin for the indicated times. Adipocytes from five non-diabetic control subjects (age 51–66, average 60 years; BMI 18–27, average 24 kg/m2) were analyzed. F, insulin signaling for control of ERK1/2 and Elk1 phosphorylation, normally and in T2D. For more details, see the legend to Fig. 1. a.u., arbitrary units.
FIGURE 7.
FIGURE 7.
ERK1/2 versus mTORC1 phosphorylation of S6, effects of MEK1/2 inhibitor PD184352/U0126 and mTOR inhibitor rapamycin. Cells were preincubated with DMSO (vehicle), 10 μm U0126, 10 μm PD184352, and/or 50 nm rapamycin for 30 min, as indicated, before incubating with 10 nm insulin for 10 min (ERK1/2 and IRS1) or 30 min (S6 and S6K1). Quantified phosphorylation data are normalized to the effect of insulin in control. Mean ± S.E. (error bars) is shown; n = number of cell preparations from different subjects. Shown is the effect of MEK1/2 inhibitor PD184352 (yellow), mTORC1 inhibitor rapamycin (cyan), or PD184352 + rapamycin (green), compared with vehicle/control (blue), on phosphorylation of ERK1/2 at Thr202/Tyr204 rapamycin (n = 5) compared with control (n = 5) (A) or S6 at Ser235/236, PD184352 (n = 7), rapamycin (n = 3), and PD184352 + rapamycin (n = 3) compared with control (n = 7) (B); or S6K1 at Thr389, PD184352 (n = 6), rapamycin (n = 4), and PD184352 + rapamycin (n = 6) compared with control (n = 6) (C); or IRS1 at Ser307, PD184352 (n = 6) compared with control (n = 6) (D). E, effect of MEK1/2 inhibitor U0126 (yellow) compared with vehicle/control (blue) on phosphorylation of S6 at Ser235/236. F, simulations of model variables ERK1/2-Thr202/Tyr204-P, S6-Ser235/236-P, and S6K-Thr389-P (blue) compared with the effect of MEK1/2 inhibitor PD184352 implemented as reduced activation of ERK1/2 by 50, 75, 83, 88, 90, 92, and 93% (left panels, yellow); mTORC1 inhibitor rapamycin implemented as reduced mTORC1 activation by 50, 75, 83, 88, 90, 92, and 93% (middle panels, cyan); or the combined effect of PD184352 + rapamycin implemented as a combination of the two effects (right panels, green). The time points for corresponding experiments in A–C are indicated with gray bars. G, insulin signaling network with the cross-talk from ERK1/2 to S6. Indicated in yellow text is the inhibition of MEK1/2-catalyzed phosphorylation of ERK1/2 by PD184352/U0126, and shown in blue text is the inhibition of mTORC1 with rapamycin. For more details, see the legend to Fig. 1. a.u., arbitrary units.
FIGURE 8.
FIGURE 8.
Structure of the complete mathematical model for insulin signaling in human adipocytes. Model equations are described in detail in the supplemental material. Indicated are the rate of reactions (v1a–v11b) and phosphorylation sites (YP, S307P, etc.). Heavy arrows represent transitions between states of the same protein, and arrows represent activation/deactivation. The three diabetes parameters are indicated.
FIGURE 9.
FIGURE 9.
A comprehensive dynamic model of insulin signaling. Shown are model simulations (lines) for insulin signaling normally (blue) and in T2D (red) and comparison with the corresponding experimental data (dots and error bars (S.E.)) for the indicated signaling intermediaries. The experimental data are explained in the legend to Fig. 2 and in Ref. . T2D is simulated with the three diabetes parameters: 45% reduced concentration of IR, 50% reduced concentration of GLUT4, and 85% reduced mTORC1-to-IRS1 feedback. a.u., arbitrary units.
FIGURE 10.
FIGURE 10.
Simulating individual effects of the three diabetes parameters in the comprehensive dynamic insulin signaling model. Shown are model simulations of insulin signaling normally (blue solid lines) and in T2D (red solid lines) for indicated signaling intermediaries. The effect of reducing the IR concentration to 55% of normal is a slight reduction of the activation of most signaling intermediaries (red dotted lines). Reducing the GLUT4 concentration by 50% influences solely the total level of glucose uptake (black dotted lines, shown only in the graph of total glucose uptake). The main contribution to the T2D state is the reduction of the mTORC1-IRS1 feedback to 15% (red dashed lines) of normal, which affects both maximal activation and insulin sensitivity for all signaling intermediaries that are affected in the T2D state. a.u., arbitrary units.

Similar articles

Cited by

References

    1. Brännmark C., Palmér R., Glad S. T., Cedersund G., Strålfors P. (2010) Mass and information feedbacks through receptor endocytosis govern insulin signaling as revealed using a parameter-free modeling framework. J. Biol. Chem. 285, 20171–20179 - PMC - PubMed
    1. Nyman E., Brännmark C., Palmér R., Brugård J., Nyström F. H., Strålfors P., Cedersund G. (2011) A hierarchical whole body modeling approach elucidates the link between in vitro insulin signaling and in vivo glucose homeostasis. J. Biol. Chem. 286, 26028–26041 - PMC - PubMed
    1. Brännmark C., Nyman E., Fagerholm S., Bergenholm L., Ekstrand E.-M., Cedersund G., Strålfors P. (2013) Insulin signalling in type 2 diabetes: experimental and modeling analyses reveal mechanisms of insulin resistance in human adipocytes. J. Biol. Chem. 288, 9867–9880 - PMC - PubMed
    1. Rajan M. R., Fagerholm S., Jönsson C., Kjølhede P., Turkina M. V., Strålfors P. (2013) Phosphorylation of IRS1 at serine 307 in response to insulin in human adipocytes is not likely to be catalyzed by p70 ribosomal S6 kinase. PLoS One 8, e59725. - PMC - PubMed
    1. Carlson C. J., Koterski S., Sciotti R. J., Poccard G. B., Rondinone C. M. (2003) Enhanced basal activation of mitogen-activated protein kinases in adipocytes from type 2 diabetes. Potential role of p38 in the downregulation of GLUT4 expression. Diabetes 52, 634–641 - PubMed

Publication types

MeSH terms

Substances