

A knockin mouse model of spinocerebellar ataxia type 3 exhibits prominent aggregate pathology and aberrant splicing of the disease gene transcript
- PMID: 25320121
- PMCID: PMC4321438
- DOI: 10.1093/hmg/ddu532
A knockin mouse model of spinocerebellar ataxia type 3 exhibits prominent aggregate pathology and aberrant splicing of the disease gene transcript
Erratum in
-
A knockin mouse model of spinocerebellar ataxia type 3 exhibits prominent aggregate pathology and aberrant splicing of the disease gene transcript.Hum Mol Genet. 2017 Aug 15;26(16):3232-3233. doi: 10.1093/hmg/ddx176. Hum Mol Genet. 2017. PMID: 28605434 Free PMC article. No abstract available.
Abstract
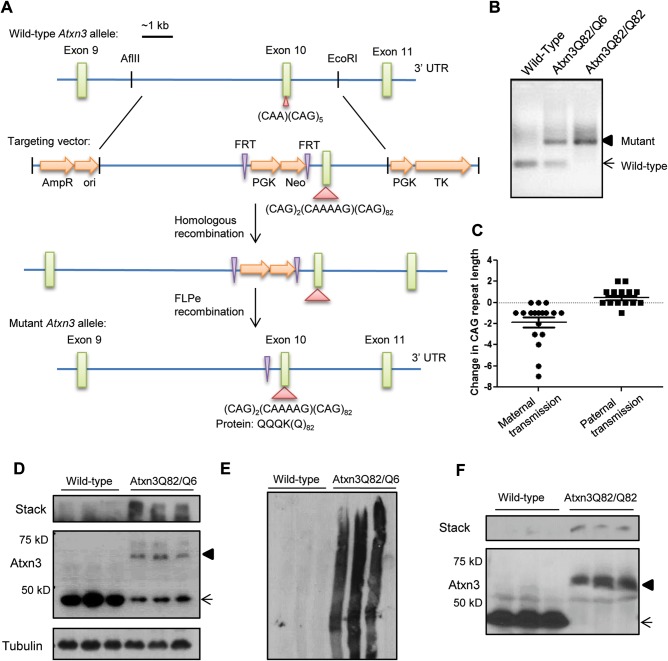
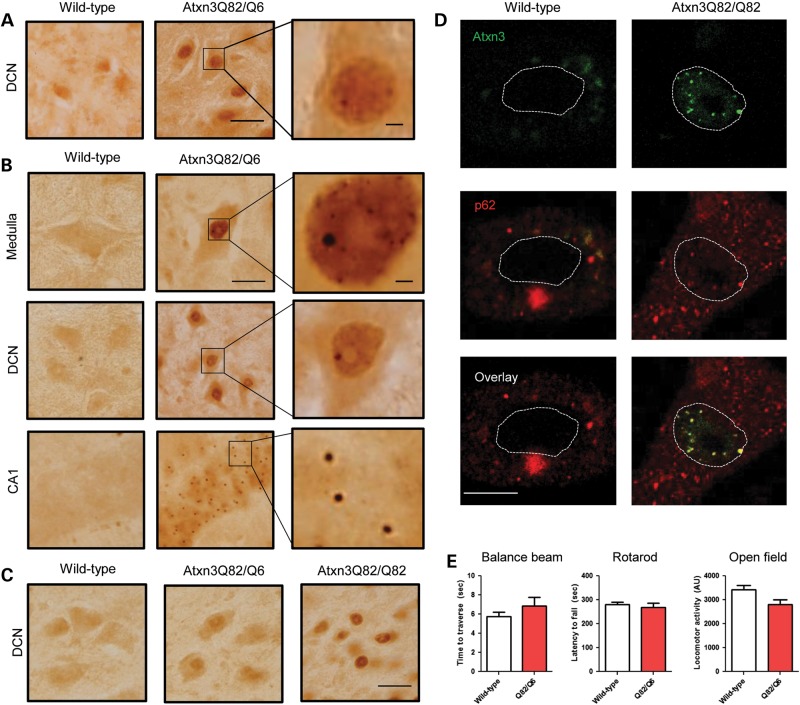
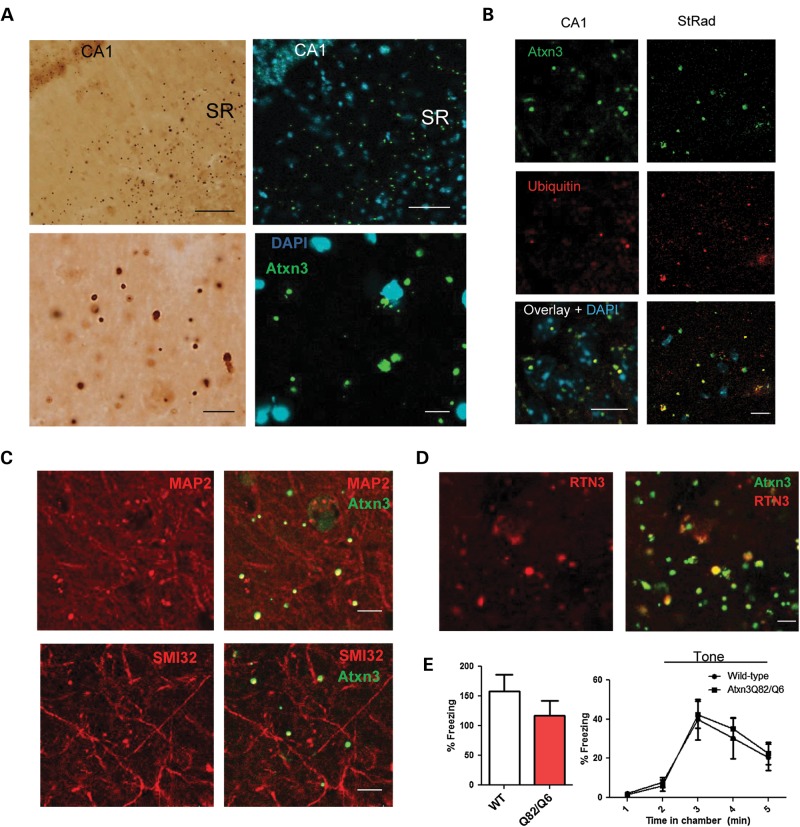
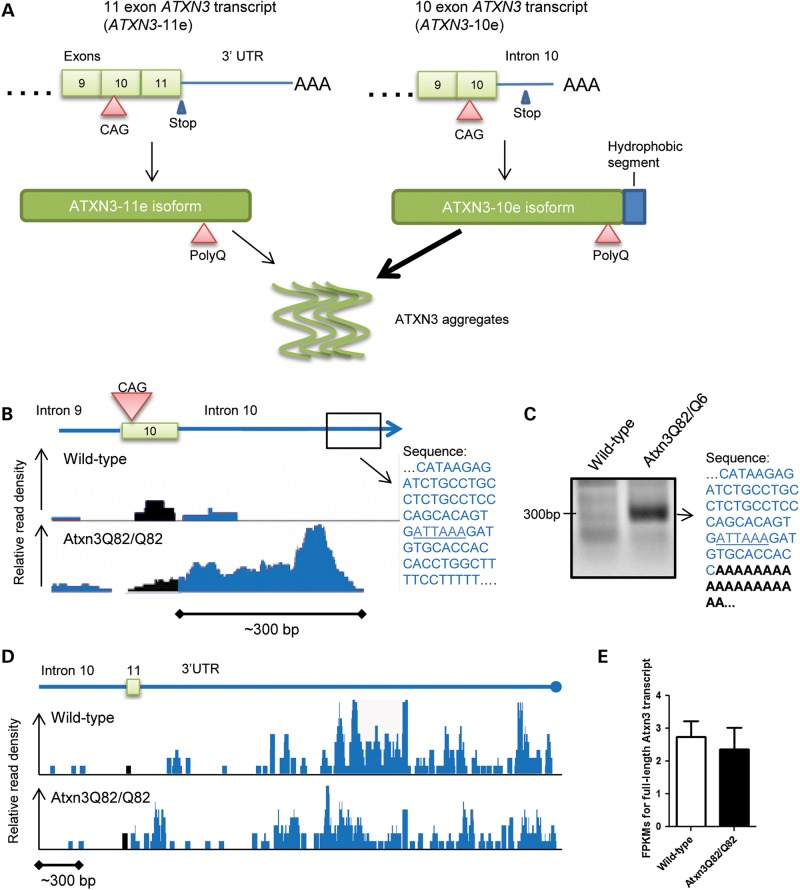
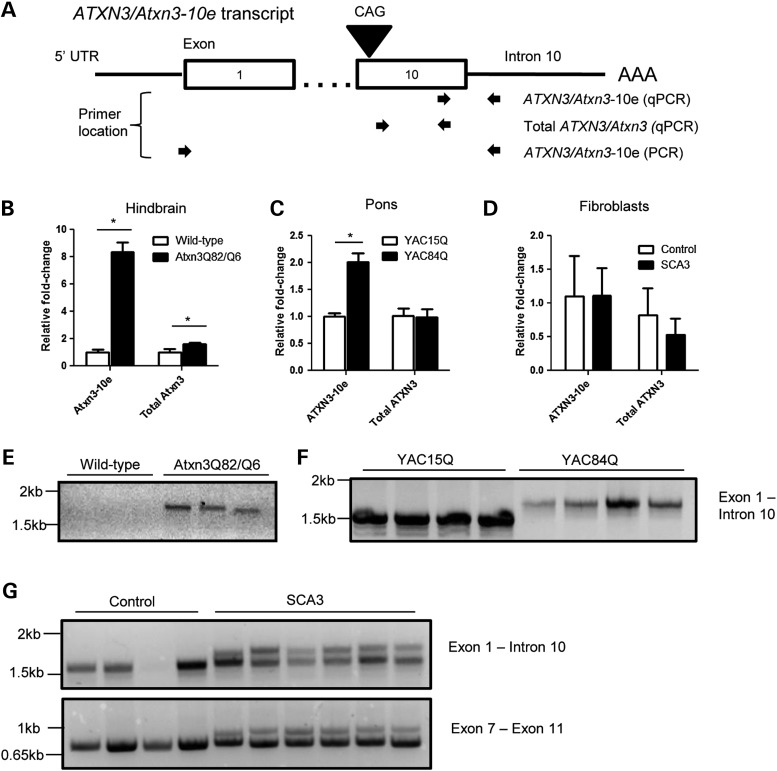
Polyglutamine diseases, including spinocerebellar ataxia type 3 (SCA3), are caused by CAG repeat expansions that encode abnormally long glutamine repeats in the respective disease proteins. While the mechanisms underlying neurodegeneration remain uncertain, evidence supports a proteotoxic role for the mutant protein dictated in part by the specific genetic and protein context. To further define pathogenic mechanisms in SCA3, we generated a mouse model in which a CAG expansion of 82 repeats was inserted into the murine locus by homologous recombination. SCA3 knockin mice exhibit region-specific aggregate pathology marked by intranuclear accumulation of the mutant Atxn3 protein, abundant nuclear inclusions and, in select brain regions, extranuclear aggregates localized to neuritic processes. Knockin mice also display altered splicing of the disease gene, promoting expression of an alternative isoform in which the intron immediately downstream of the CAG repeat is retained. In an independent mouse model expressing the full human ATXN3 disease gene, expression of this alternatively spliced transcript is also enhanced. These results, together with recent findings in other polyglutamine diseases, suggest that CAG repeat expansions can promote aberrant splicing to produce potentially more aggregate-prone isoforms of the disease proteins. This report of a SCA3 knockin mouse expands the repertoire of existing models of SCA3, and underscores the potential contribution of alternative splicing to disease pathogenesis in SCA3 and other polyglutamine disorders.
© The Author 2014. Published by Oxford University Press. All rights reserved. For Permissions, please email: journals.permissions@oup.com.
Figures
Similar articles
-
Mouse ataxin-3 functional knock-out model.Neuromolecular Med. 2011 Mar;13(1):54-65. doi: 10.1007/s12017-010-8137-3. Epub 2010 Oct 14. Neuromolecular Med. 2011. PMID: 20945165 Free PMC article.
-
A new humanized ataxin-3 knock-in mouse model combines the genetic features, pathogenesis of neurons and glia and late disease onset of SCA3/MJD.Neurobiol Dis. 2015 Jan;73:174-88. doi: 10.1016/j.nbd.2014.09.020. Epub 2014 Oct 7. Neurobiol Dis. 2015. PMID: 25301414
-
Ataxin-3 protein modification as a treatment strategy for spinocerebellar ataxia type 3: removal of the CAG containing exon.Neurobiol Dis. 2013 Oct;58:49-56. doi: 10.1016/j.nbd.2013.04.019. Epub 2013 May 6. Neurobiol Dis. 2013. PMID: 23659897
-
Machado-Joseph disease/spinocerebellar ataxia type 3.Handb Clin Neurol. 2012;103:437-49. doi: 10.1016/B978-0-444-51892-7.00027-9. Handb Clin Neurol. 2012. PMID: 21827905 Free PMC article. Review.
-
Toward understanding Machado-Joseph disease.Prog Neurobiol. 2012 May;97(2):239-57. doi: 10.1016/j.pneurobio.2011.11.006. Epub 2011 Nov 23. Prog Neurobiol. 2012. PMID: 22133674 Free PMC article. Review.
Cited by
-
Paradigm for disease deconvolution in rare neurodegenerative disorders in Indian population: insights from studies in cerebellar ataxias.J Genet. 2018 Jul;97(3):589-609. J Genet. 2018. PMID: 30027898
-
Comparison of spinocerebellar ataxia type 3 mouse models identifies early gain-of-function, cell-autonomous transcriptional changes in oligodendrocytes.Hum Mol Genet. 2017 Sep 1;26(17):3362-3374. doi: 10.1093/hmg/ddx224. Hum Mol Genet. 2017. PMID: 28854700 Free PMC article.
-
Physiological and pathophysiological characteristics of ataxin-3 isoforms.J Biol Chem. 2019 Jan 11;294(2):644-661. doi: 10.1074/jbc.RA118.005801. Epub 2018 Nov 19. J Biol Chem. 2019. PMID: 30455355 Free PMC article.
-
Glucocorticoid receptor-dependent therapeutic efficacy of tauroursodeoxycholic acid in preclinical models of spinocerebellar ataxia type 3.J Clin Invest. 2024 Mar 1;134(5):e162246. doi: 10.1172/JCI162246. J Clin Invest. 2024. PMID: 38227368 Free PMC article.
-
Consensus Paper: Strengths and Weaknesses of Animal Models of Spinocerebellar Ataxias and Their Clinical Implications.Cerebellum. 2022 Jun;21(3):452-481. doi: 10.1007/s12311-021-01311-1. Epub 2021 Aug 10. Cerebellum. 2022. PMID: 34378174 Free PMC article.
References
-
- Burnett B., Li F., Pittman R.N. The polyglutamine neurodegenerative protein ataxin-3 binds polyubiquitylated proteins and has ubiquitin protease activity. Hum. Mol. Genet. 2003;12:3195–3205. - PubMed
-
- Paulson H.L., Perez M.K., Trottier Y., Trojanowski J.Q., Subramony S.H., Das S.S., Vig P., Mandel J., Fischbeck K.H., Pittman R.N. Intranuclear inclusions of expanded polyglutamine protein in spinocerebellar ataxia type 3. Neuron. 1997;19:333–344. - PubMed
-
- Seidel K., Siswanto S., Brunt E.R.P., den Dunnen W., Korf H.-W., Rüb U. Brain pathology of spinocerebellar ataxias. Acta Neuropathol. 2012;124:1–21. - PubMed
-
- Seidel K., Meister M., Dugbartey G.J., Zijlstra M.P., Vinet J., Brunt E.R.P., van Leeuwen F.W., Rüb U., Kampinga H.H., den Dunnen W.F.A. Cellular protein quality control and the evolution of aggregates in spinocerebellar ataxia type 3 (SCA3) Neuropathol. Appl. Neurobiol. 2012;38:548–558. - PubMed
Publication types
MeSH terms
Substances
Grants and funding
LinkOut - more resources
Full Text Sources
Other Literature Sources
Molecular Biology Databases
