. 2014 Oct 15;6(258):258ra140.
doi: 10.1126/scitranslmed.3010157.

Blocking PirB up-regulates spines and functional synapses to unlock visual cortical plasticity and facilitate recovery from amblyopia

Affiliations

Blocking PirB up-regulates spines and functional synapses to unlock visual cortical plasticity and facilitate recovery from amblyopia

David N Bochner et al. Sci Transl Med. .

Abstract

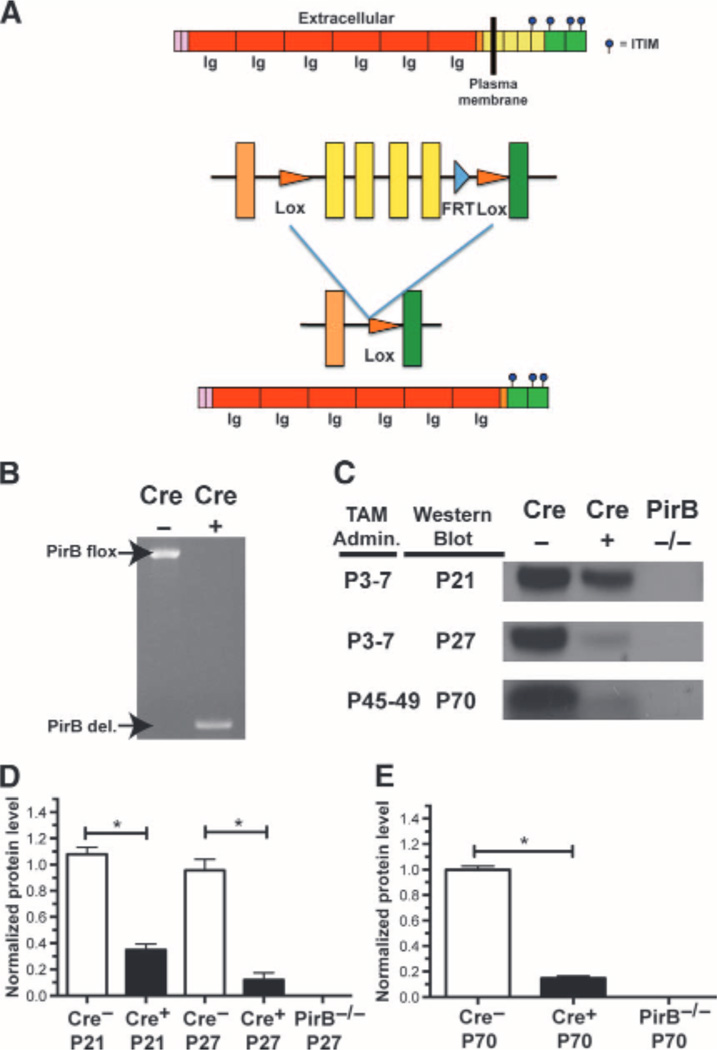
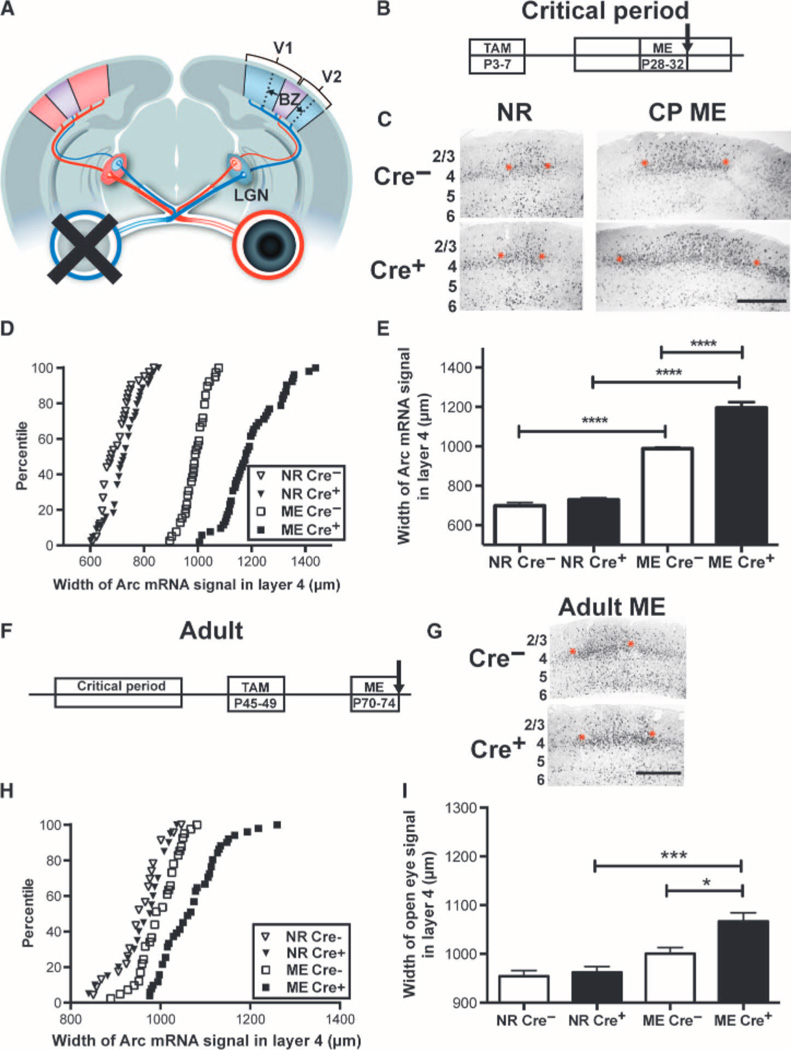
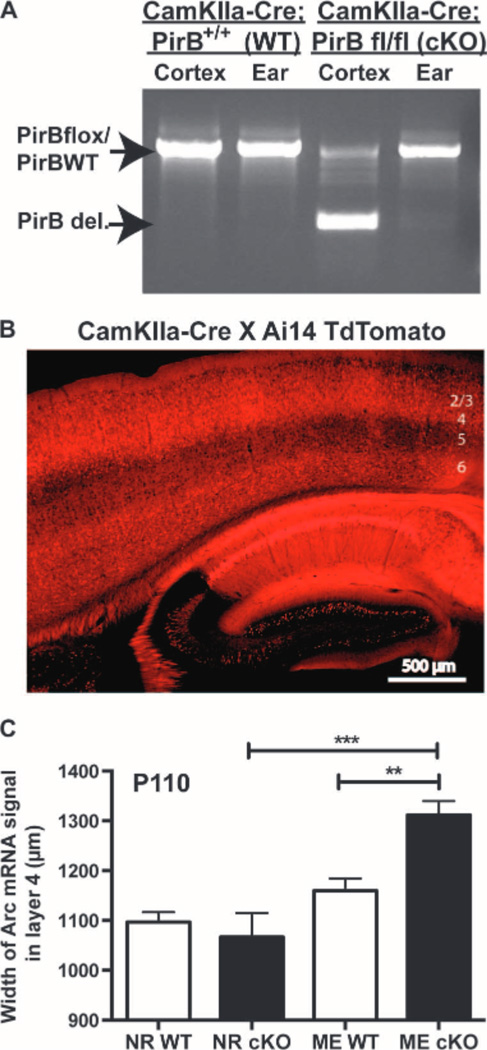
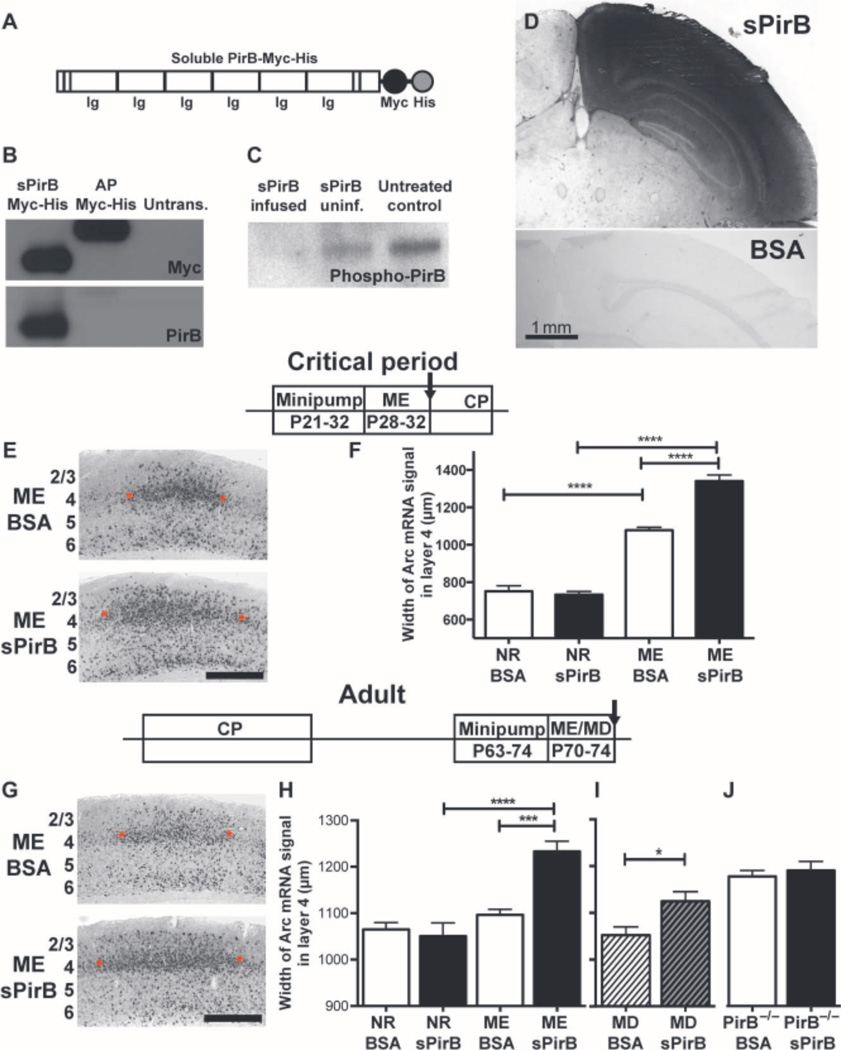
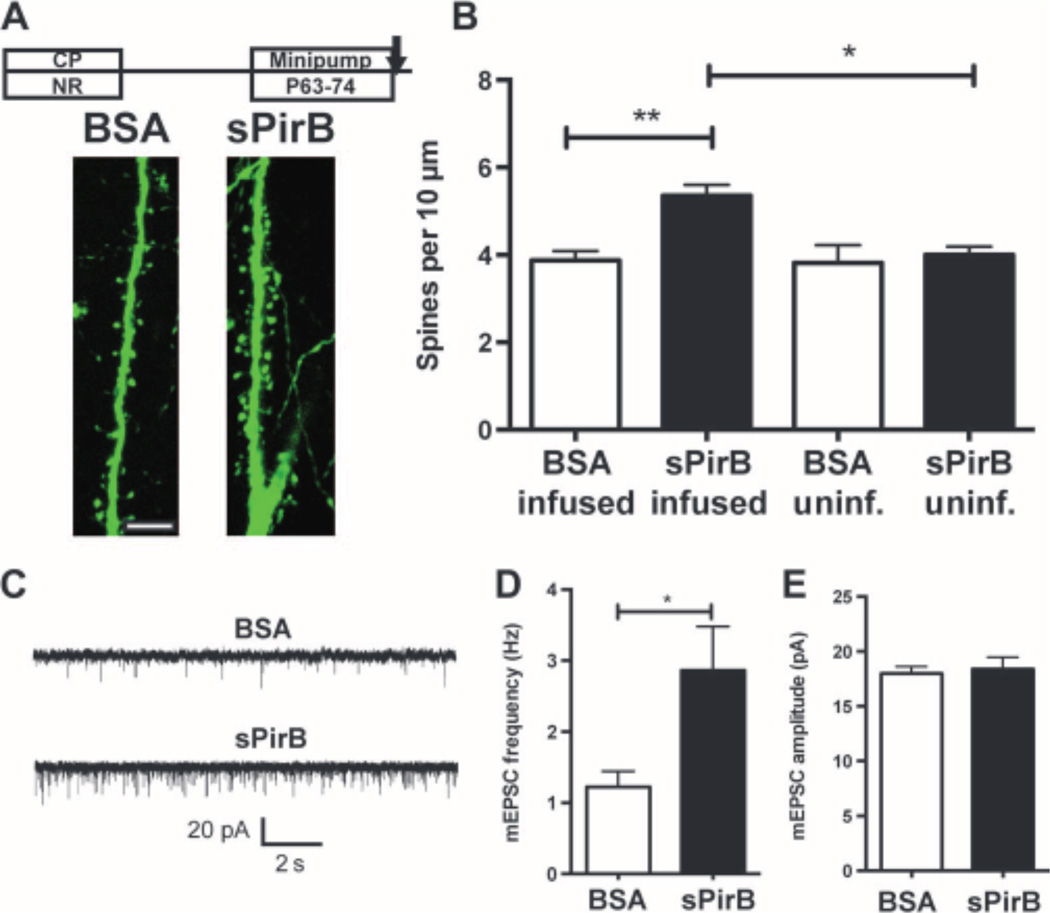
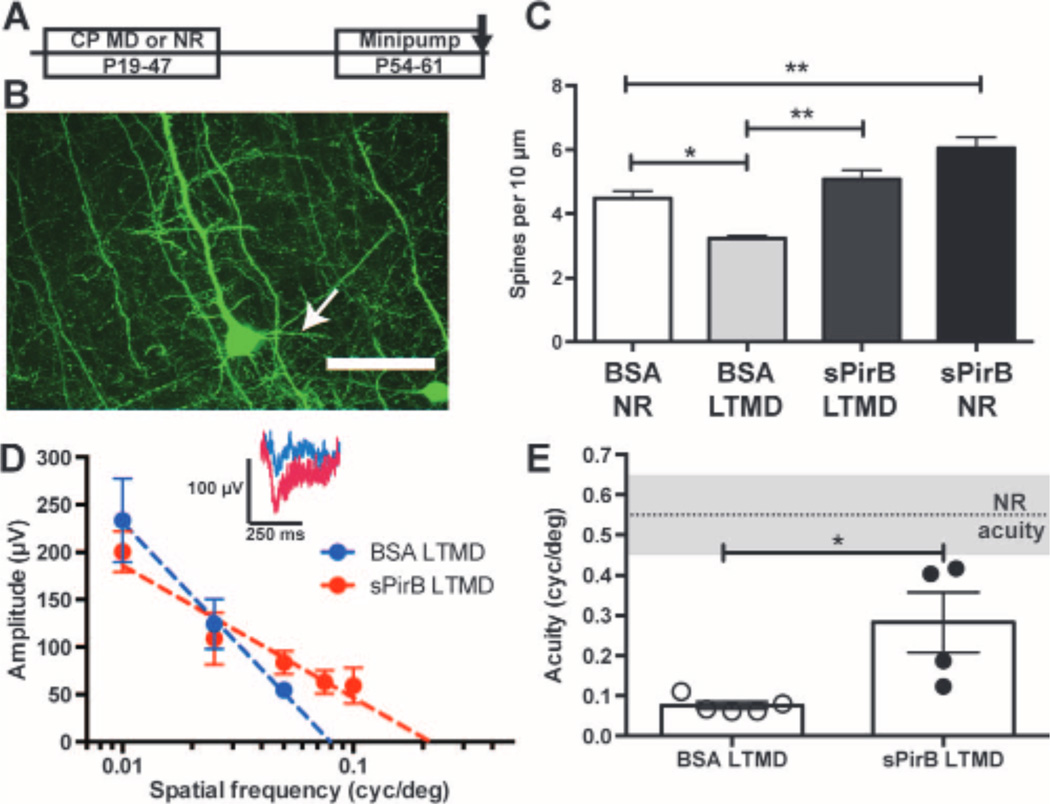
During critical periods of development, the brain easily changes in response to environmental stimuli, but this neural plasticity declines by adulthood. By acutely disrupting paired immunoglobulin-like receptor B (PirB) function at specific ages, we show that PirB actively represses neural plasticity throughout life. We disrupted PirB function either by genetically introducing a conditional PirB allele into mice or by minipump infusion of a soluble PirB ectodomain (sPirB) into mouse visual cortex. We found that neural plasticity, as measured by depriving mice of vision in one eye and testing ocular dominance, was enhanced by this treatment both during the critical period and when PirB function was disrupted in adulthood. Acute blockade of PirB triggered the formation of new functional synapses, as indicated by increases in miniature excitatory postsynaptic current (mEPSC) frequency and spine density on dendrites of layer 5 pyramidal neurons. In addition, recovery from amblyopia--the decline in visual acuity and spine density resulting from long-term monocular deprivation--was possible after a 1-week infusion of sPirB after the deprivation period. Thus, neural plasticity in adult visual cortex is actively repressed and can be enhanced by blocking PirB function.


Figures

Fig. 1
Fig. 1
A Tamoxifen-inducible Cre-dependent strategy for deletion of PirB with temporal control. (A) Schematic of PirB protein structure (top) and floxed PirB allele (bottom) before and after Cre-mediated excision. (B) Daily tamoxifen given via injection of nursing mother (P3 to P7) induces deletion of the floxed region at P21 as detected by polymerase chain reaction (PCR). (C) Western blots for PirB protein in forebrain at ages (left) of tamoxifen (TAM) administration and Western blotting. (D) Quantification of PirB protein in forebrain after tamoxifen administration (P3 to P7), normalized to average Cre levels across all ages assayed: Cre P21: n = 4 mice versus Cre+ P21: n = 5, P = 0.02, U test. Cre P27: n = 5 versus Cre+ P27: n = 4, P = 0.02, U test. (E) Quantification of PirB protein in forebrain at P70 (adult) after tamoxifen injection from P45 to P49. Cre P70: n = 4 versus Cre+ P70: n = 4, P = 0.03, U test. *P < 0.05.
Fig. 2
Fig. 2
Timed genetic deletion of PirB enhances OD plasticity. (A) Schematic of mouse visual system. Each retina (right: red, left: blue) projects primarily contralaterally to the lateral geniculate nucleus (LGN), which projects to visual cortex (V1). A small binocular zone (BZ, purple) in V1 receives input from both eyes; in response to deprivation of one eye (for example, left), the representation of the open (right; ipsilateral) eye expands (arrows). (B) Timeline of inducible knockout of PirB and assessment of OD plasticity via Arc mRNA induction. (C) Example micrographs of in situ hybridizations for Arc mRNA induced in BZ of visual cortex after open-eye stimulation. Each black dot is a cell. ME from P28 to P32 results in expansion of the ipsilateral (open) eye representation (between red asterisks), as compared with normal rearing (NR). Cre = PirB flox/flox. Cre+ = UbC-CreERT2; PirB flox/flox. Width of Arc signal in L4 was measured (see fig. S1). Cortical layers indicated at left; scale bar, 500 mm. CP, critical period. (D) Cumulative histograms of width of Arc mRNA signal by individual section. NR Cre: n = 41 sections; NRCre+: n = 44; MECre: n = 39; MECre+: n = 52. (E) Graph of data in (D), with mean and SEM by animal: deletion of PirB during the critical period enhances OD plasticity. NRCre: n = 7 mice versus NRCre+: n = 7, P = 0.65; MECre: n = 7 versus MECre+: n = 7, **** indicates P < 0.0001, two-way ANOVA with Tukey post hoc test. (F) Timeline of inducible deletion of PirB and assessment of OD plasticity in adults. (G) Example Arc mRNA in situ hybridization micrographs at P74, as in (C). (H) Cumulative histograms of width of Arc mRNA induction from individual sections. NRCre: n = 23 sections; NRCre+: n = 20; MECre: n = 41; MECre+: n = 51. (I) Graph of data shown in (G) (mean and SEM by animal): deletion of PirB in adulthood enhances OD plasticity. NRCre: n = 5 mice versus NRCre+: n = 5, P = 0.99; MECre: n = 7 versus MECre+: n = 8, P = 0.013; MECre versus NRCre: P = 0.18; MECre+ versus NRCre+: P = 0.0004, by two-way ANOVA with Tukey post test. *P < 0.05, ***P < 0.001.
Fig. 3
Fig. 3
Cre-mediated deletion of PirB from forebrain excitatory neurons enhances adult OD plasticity. (A) Genotyping of samples from ear and cerebral cortex from P100 CamKIIa-Cre; PirB flox/flox (cKO) or CamKIIa-Cre; PirB WT (wild type), showing deletion of floxed PirB in cortex but not ear. (B) CamKIIa-Cre; PirB flox/+ breeders were crossed with the Ai14 TdTomato reporter line, generating red fluorescence in the presence of Cre. Sagittal section through visual cortex (layers indicated at right) and hippocampus of a P30 mouse shows Cre present in pyramidal neurons. (C) Graphs of width of L4 region activated by stimulation of ipsilateral (open) eye in visual cortex, assessed using Arc mRNA induction. Deletion of PirB from forebrain excitatory neurons increases open-eye expansion in adult mice after ME from P100 to P110. NRWT: n = 5 mice versus NRcKO: n = 4, P = 0.91. MEWT: n = 8 mice versus MEcKO: n=5, P = 0.006. NR versus MEWT: P = 0.39, NR versus MEcKO: P = 0.0002,by two-way ANOVA with Tukey post hoc test.**P < 0.01,***P < 0.001.
Fig. 4
Fig. 4
Blockade of PirB binding enhances OD plasticity in WT visual cortex. (A) Schematic of soluble PirB-Myc-His (sPirB) fusion protein, indicating extracellular Ig-like domains plus Myc and His tags. (B) Western blot of culture supernatant from sPirB-transfected HEK293 cells, detecting Myc tag and PirB ectodomain; Myc-His–tagged alkaline phosphatase (AP-Myc-His) is a positive control. (C) PirB phosphorylation is decreased after 7 days (P21 to P28) of sPirB infusion into WT mouse cortex, as shown by phospho-tyrosine IP and PirB Western blot of cortical lysates from infused (sPirB infused), uninfused (sPirB uninf.) hemispheres, or untreated littermate controls. (D) Section of visual cortex immunostained with anti-Myc antibody after 11 days (P21toP32)of sPirB or BSA infusion (1 mg/ml). Scale bar, 1 mm. (E and F) Minipump infusions of sPirB during critical period (CP). Timeline as shown. (E) Example Arc mRNA in situ hybridization micrographs of visual cortex after BSA (top)or sPirB (bottom) treatment. Scale bar, 500 mm. Red asterisks indicate borders of Arc mRNA signal induced by stimulating the ipsilateral (open) eye in layer 4. (F) Graphs comparing width of Arc mRNA signal in L4 after open-eye stimulation. Width of territory activated by open-eye stimulation after ME is greater after sPirB infusion than with BSA. NRBSA: n = 4 mice, NR sPirB: n = 4, MEBSA: n = 5 versus ME sPirB: n = 6, P < 0.0001, by two-way ANOVA and Tukey post hoc test for all comparisons indicated. (Gto I) sPirB infusions into adult WT visual cortex; timeline as shown. (G) Example of Arc mRNA situ hybridization micrographs at P74. Scale bar, 500 mm. (H) Graphs comparing width of Arc mRNA signal in L4 after stimulation of the ipsilateral (open) eye. sPirB infusion from P63 to P74 enhances open-eye expansion after ME. NRBSA: n = 4 mice versus NR sPirB: n = 4, P = 0.99. MEBSA: n = 4 versus ME sPirB: n = 5, P = 0.0004. NR versus MEBSA: P = 0.88, NR versus ME sPirB: P < 0.0001. (I) sPirB infusion coupled with 3 days of MD also enhances OD plasticity. (J) sPirB infusion has no effect on OD plasticity when infused into visual cortex of PirB−/− mice. ME PirB−/− BSA: n = 5 mice versus ME PirB−/− sPirB: n = 5, P = 0.95, ME PirB−/− BSA versus MEWTBSA: P = 0.034. MD BSA versus MD sPirB: n = 4 mice per group, P = 0.036. *P < 0.05, ***P < 0.001, ****P < 0.0001, by two-way ANOVA and Tukey post hoc test.
Fig. 5
Fig. 5
sPirB increases spine density and functional synapses on L5 pyramidal neurons of normally reared mice. (A) Timeline of minipump infusions [BSA (1 mg/ml) or sPirB from P63 to P74] and example dendrites of YFP-labeled L5 pyramidal neurons in binocular zone of visual cortex in WT Thy-1 YFP-H animals reared with normal visual experience. Scale bar, 10 mm. (B) Histograms of spine density on apical tufts of L5 neurons in sPirB infused versus in the uninfused (unif.) contralateral hemisphere, or in BSA controls: BSA infused: n = 5mice versus sPirB infused: n = 5, P = 0.01, one to two cells per animal. BSA uninf.: n = 5 versus sPirB uninf.: n = 5, P = 0.96, BSA inf. versus uninf.: P = 0.99, sPirB inf. versus uninf.: P = 0.016, by two-way ANOVA and Tukey post hoc test. (C) Example traces of mEPSC responses recorded from visual cortical slices (P70 to P77) from L5 pyramidal neurons after BSA or sPirB infusion, as in (A).(D) Increased mEPSC frequency with sPirB infusion: BSA: n = 12 neurons versus sPirB n = 13, P = 0.046, by Mann-Whitney U test. (E) No change in mEPSC amplitude: BSA: n = 12 neurons versus sPirB n = 13, P = 0.70, by Mann-Whitney U test.
Fig. 6
Fig. 6
sPirB allows structural and functional recovery from amblyopia after LTMD. (A) Experimental timeline: LTMD from P19 to P47, eye reopening at P47, and minipump infusion from P54 to P61. (B) Representative YFP-labeled L5 cell soma and basolateral (arrow) dendrites in visual cortex of WT Thy-1 YFP-H mice. Scale bar, 50 mm. (C) Bar graphs showing changes in basolateral dendritic spine density: LTMD causes a significant decline in spine density (BSA LTMD) that can be fully reversed with sPirB infusion (sPirB LTMD) (BSA NR: n = 5 mice versus BSA LTMD: n = 4, P = 0.02. sPirB LTMD: n = 5, sPirB versus BSA LTMD, P = 0.001, sPirB NR: n = 5 animals, one to two cells per animal, sPirB versus BSA NR: P = 0.003). *P < 0.05,**P < 0.01,by two-way ANOVA and Tukey post hoc test. (D) Averaged cortical VEP response amplitudes (microvolts) to stimuli at a range of spatial frequencies (cycles per degree) after LTMD in mice receiving minipump infusion of either sPirB or BSA. Dotted line: Semilogarithmic regression of visual responses. Inset: Population average traces at 0.05 cycle per degree. (E) Bar graphs showing spatial acuity after LTMD plus infusion of either BSA or sPirB. Gray shaded region indicates mean acuity ± SEM of normally reared (NR) controls. Measurements from individual mice are plotted (circles). Loss of acuity with LTMD is reversed after just 1weekof sPirB infusion (NR, n = 6 mice versus BSA LTMD, n = 5 mice, P = 0.004. sPirB LTMD, n = 4 mice versus BSA LTMD, P = 0.016). *P < 0.05, **P < 0.01, by U test.

References

    1. Hubel DH, Wiesel TN. The period of susceptibility to the physiological effects of unilateral eye closure in kittens. J. Physiol. 1970;206:419–436. - PMC - PubMed
    1. Knudsen EI. Sensitive periods in the development of the brain and behavior. J. Cogn. Neurosci. 2004;16:1412–1425. - PubMed
    1. Levelt CN, Hübener M. Critical-period plasticity in the visual cortex. Annu. Rev. Neurosci. 2012;35:309–330. - PubMed
    1. Pizzorusso T, Medini P, Landi S, Baldini S, Berardi N, Maffei L. Structural and functional recovery from early monocular deprivation in adult rats. Proc. Natl. Acad. Sci. U.S.A. 2006;103:8517–8522. - PMC - PubMed
    1. Levi DM. Visual processing in amblyopia: Human studies. Strabismus. 2006;14:11–19. - PubMed

Publication types

MeSH terms

LinkOut - more resources