. 2015 Jan 1;125(1):13-21.
doi: 10.1182/blood-2014-05-577270. Epub 2014 Oct 15.

The H3K27me3 demethylase UTX is a gender-specific tumor suppressor in T-cell acute lymphoblastic leukemia

Affiliations

The H3K27me3 demethylase UTX is a gender-specific tumor suppressor in T-cell acute lymphoblastic leukemia

Joni Van der Meulen et al. Blood. .

Abstract

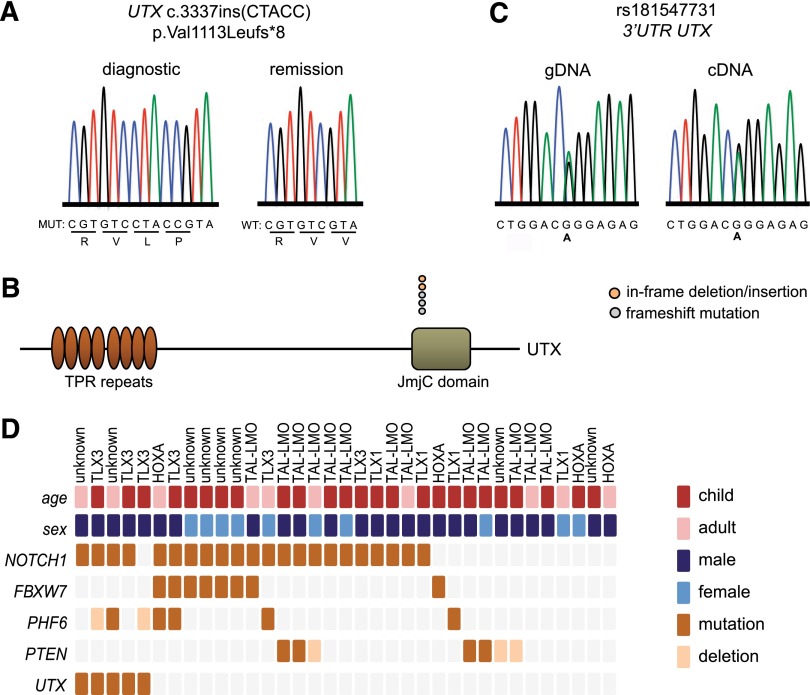
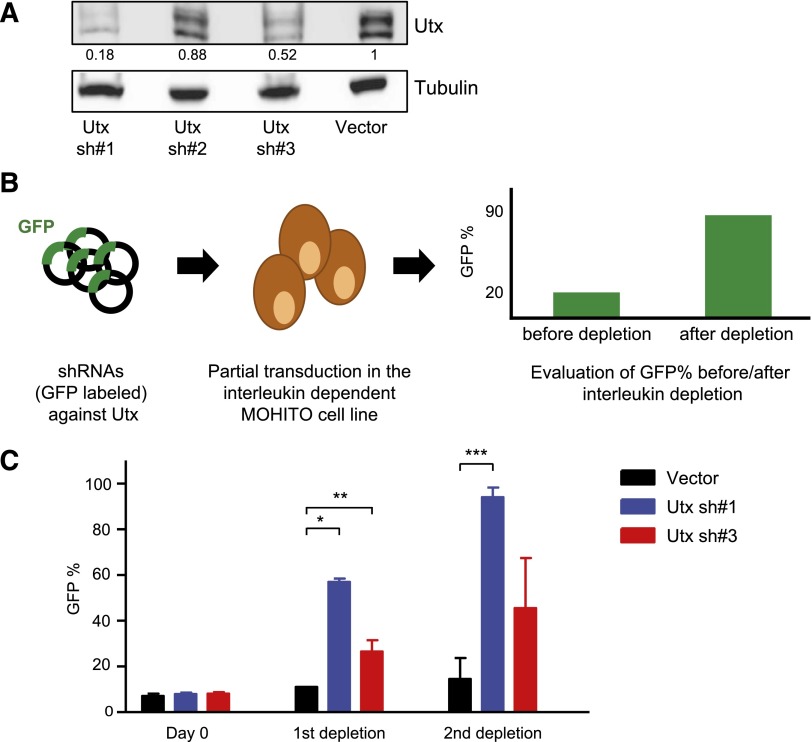
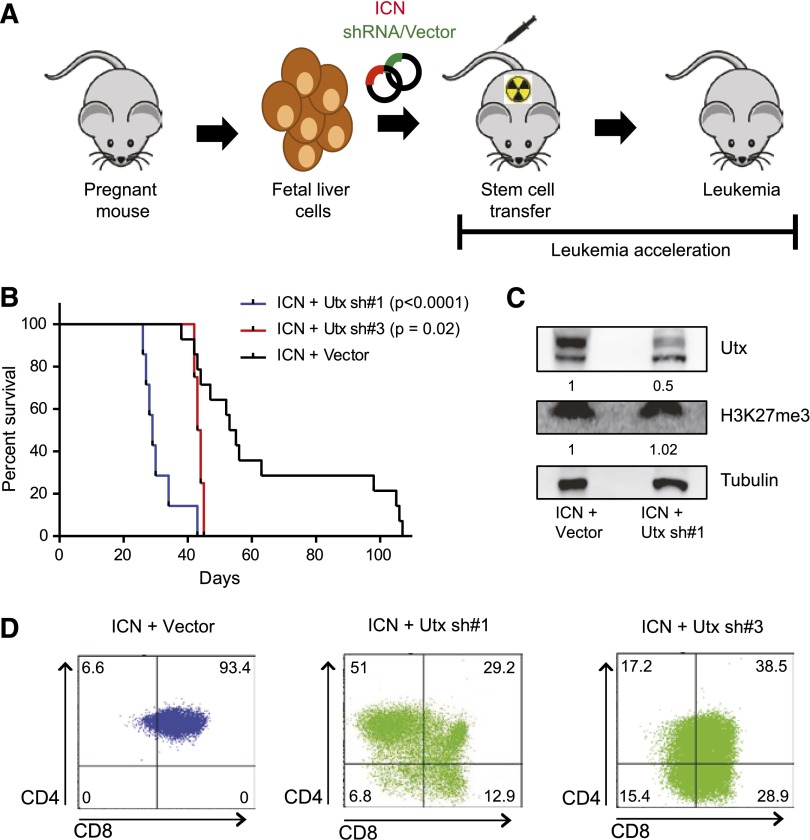
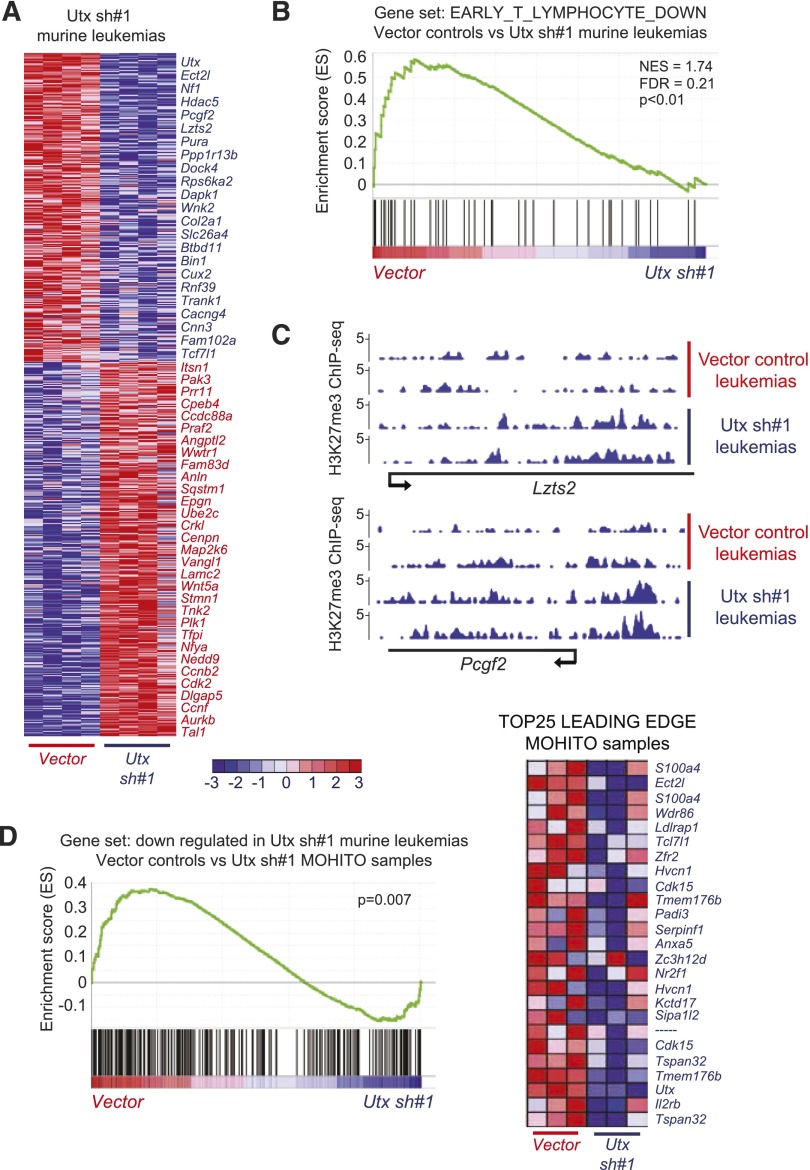
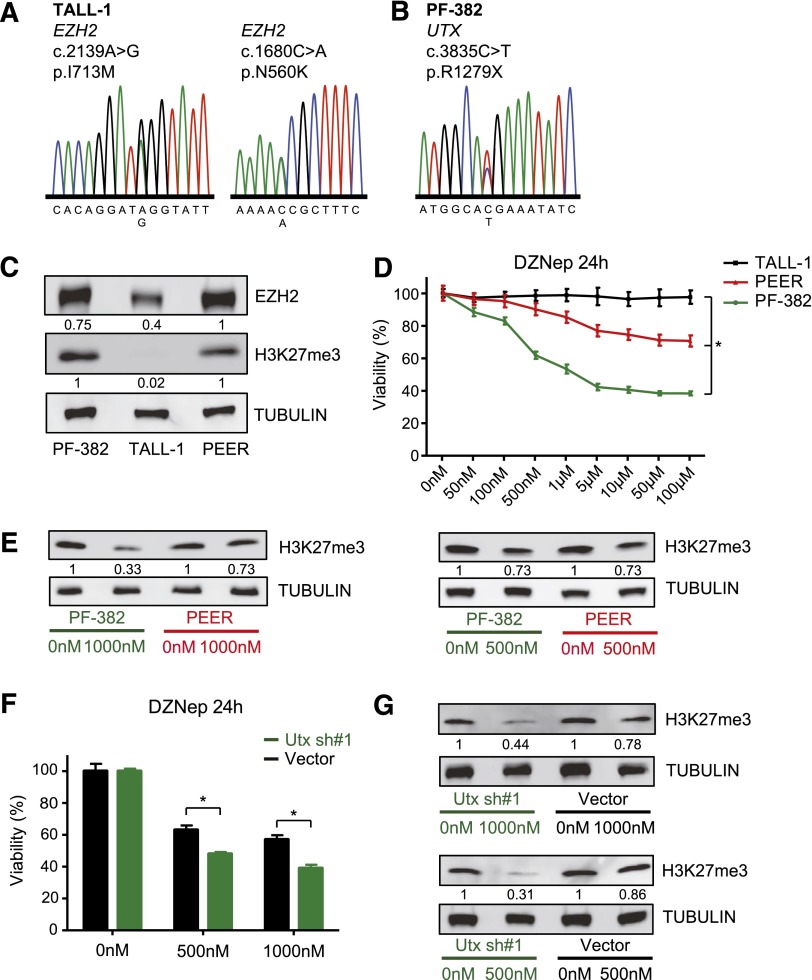
T-cell acute lymphoblastic leukemia (T-ALL) is an aggressive form of leukemia that is mainly diagnosed in children and shows a skewed gender distribution toward males. In this study, we report somatic loss-of-function mutations in the X-linked histone H3K27me3 demethylase ubiquitously transcribed X (UTX) chromosome, in human T-ALL. Interestingly, UTX mutations were exclusively present in male T-ALL patients and allelic expression analysis revealed that UTX escapes X-inactivation in female T-ALL lymphoblasts and normal T cells. Notably, we demonstrate in vitro and in vivo that the H3K27me3 demethylase UTX functions as a bona fide tumor suppressor in T-ALL. Moreover, T-ALL driven by UTX inactivation exhibits collateral sensitivity to pharmacologic H3K27me3 inhibition. All together, our results show how a gender-specific and therapeutically relevant defect in balancing H3K27 methylation contributes to T-cell leukemogenesis.


Figures

Figure 1
Figure 1
UTX mutations in human T-ALL. (A) DNA sequencing chromatogram showing a UTX mutation in the gDNA of a male primary T-ALL patient sample. The mutation is absent in remission material of the same patient. (B) Graphical representation of the localization of genetic lesions in the UTX protein structure. In-frame deletion/insertion mutations are depicted in orange circles and frameshift mutations in blue circles. (C) Genotyping and allelic expression analysis of SNP rs181547731 in gDNA and cDNA derived from female T-ALL lymphoblasts. (D) Graphical representation of the different mutations (dark orange rectangles) and deletions (light orange rectangles) present in a set of T-ALL oncogenes and tumor suppressor genes in 35 primary T-ALL patient samples. The different T-ALL subgroups include TAL-LMO, TLX3, TLX1, HOXA, and patients for whom the subgroup is unknown. The age subgroups include children (age ≤15 years; dark red rectangles) and adults (age >15 years; light red rectangles). Male and female T-ALL patient samples are presented in dark blue and light blue rectangles, respectively. JmjC, Jumonji C; TPR, tetratricopeptide repeat.
Figure 2
Figure 2
Knockdown of Utx augments the oncogenic activity in the murine T-ALL cell line MOHITO. (A) Western blot analysis of GFP sorted MOHITO knockdown samples containing 3 different hairpins against Utx compared with empty vector control. Blots were incubated with antibodies against Utx and tubulin. Expression levels were normalized to tubulin levels and compared with the vector control. (B) Graphical illustration of the interleukin depletion assay in the IL2-IL7–dependent MOHITO cell line. MOHITO cells are partially transduced with vectors encoding shRNAs against Utx and coexpressing GFP, after which the GFP percentage is measured by fluorescence-activated cell sorter analysis before and after successive rounds of interleukin depletion. (C) GFP percentage measured at Day 0, and after 1st and 2nd depletion rounds in Utx sh#1 and Utx sh#3 knockdown samples and controls. The depletion assay was repeated twice. The GFP enrichment was statistically significant after the 1st depletion for Utx sh#1* and Utx sh#3**, and after the 2nd depletion for Utx sh#1*** compared with empty vector control respectively (unpaired Student t test: *P = .005; **P = .049; ***P = .008).
Figure 3
Figure 3
Loss of Utx accelerates leukemia development in a NOTCH1-induced T-ALL mouse model. (A) Graphical illustration of NOTCH1-induced T-ALL mouse model. Fetal liver cells are partially transduced with vectors encoding NOTCH1 (ICN) (coexpressing mCherry), and the shRNA or empty vector control (coexpressing GFP), followed by tail vein injection in lethally irradiated mouse recipients and monitoring of leukemia onset. (B) Kaplan-Meier curves and log-rank (Mantel-Cox) analysis show accelerated leukemia onset in Utx sh#1 (n = 7, P < .0001) (blue) and Utx sh#3 (n = 4, P = .02) (red) mice as compared with empty vector (n = 14) (black) mouse recipients. (C) Western blot analysis of Utx and H3K27me3 in a representative Utx sh#1 mouse leukemia sample. Utx protein levels and H3K27me3 levels are quantified by Image J, normalized to tubulin levels, and compared with expression levels in control mice. (D) Immunophenotypical fluorescence-activated cell sorter analysis of CD4 and CD8 T-cell markers in the Utx sh#1, Utx sh#3, and empty vector control mouse leukemias. A representative example of each subtype is depicted.
Figure 4
Figure 4
Gene networks regulated by Utx in T-ALL. (A) Differentially expressed genes (FC >1.5; P < .05) between Utx knockdown and control murine leukemias are represented in a heat map. A selection of genes is shown in rows and each column represents 1 individual mouse leukemia sample. The scale bar shows color-coded differential expression from the mean in standard deviation units with red indicating higher levels and blue lower levels of expression. (B) Unbiased GSEA of gene expression signatures associated with murine leukemias driven by loss of Utx or NOTCH1 only vector controls. Gene sets involving early T-lymphocytes (P < .01) are significantly enriched in Utx-driven leukemias. (C) H3K27me3 ChIP-seq profiles at 2 specific gene loci (Lzts2 and Pcgf2) in murine leukemias driven by loss of Utx or NOTCH1 only vector controls. (D) GSEA of transcripts significantly downregulated upon Utx knockdown in murine leukemias (FC >1.5, P < .05; 252 probes) in gene expression signatures obtained from MOHITO samples driven by loss of Utx. Heatmap displays the TOP 25 leading edge of this gene set in Utx-driven MOHITO samples. FDR, false discovery rate; NES, negative enrichment score.
Figure 5
Figure 5
Utx-driven cell lines are more sensitive for H3K27me3 inhibition. (A) gDNA sequencing chromatograms representing 2 missense mutations in the EZH2 gene detected in the T-ALL cell line TALL-1. (B) DNA sequencing chromatogram representing a nonsense mutation in the UTX gene detected in the human T-ALL cell line PF-382. (C) Western blot analysis of EZH2, H3K27me3, and tubulin in the human T-ALL cell lines PF-382, TALL-1, and PEER. EZH2 protein and H3K27me3 levels are quantified by Image J and normalized to tubulin levels. (D) Luminescence-based viability assay after 24 hours of DZNep administration in 3 different T-ALL cell lines (TALL-1: black; PEER: red; and PF-382: green) using a range of DZNep concentrations from 0 nM to 100 μM. The experiment was done using 6 replicates, and repeated twice independently. The viability score for each concentration was significantly different between the 3 T-ALL cell lines (*Kruskal-Wallis test, P < .0001). (E) Western blot analysis of H3K27me3 and tubulin 24 hours after DZNep administration (1000 nM and 500 nM) in 2 different T-ALL cell lines (PEER: red and PF-382: green). H3K27me3 levels are quantified by Image J and normalized to tubulin levels. DZNep-treated samples are compared with expression levels in untreated samples. (F) Luminescence-based viability assay after 24 hours of DZNep administration in Utx knockdown and control MOHITO samples (vector: black and Utx sh#1: green). The experiment was done in fourfold (unpaired Student t test: *P < .0001). (G) Western blot analysis of H3K27me3 and tubulin 24 hours after DZNep administration (1000 nM and 500 nM) in Utx knockdown and control MOHITO samples (vector: black and Utx sh#1: green). H3K27me3 levels are quantified by Image J and normalized to tubulin levels. DZNep-treated samples are compared with expression levels in untreated samples.

Comment in

References

    1. Goldberg JM, Silverman LB, Levy DE, et al. Childhood T-cell acute lymphoblastic leukemia: the Dana-Farber Cancer Institute acute lymphoblastic leukemia consortium experience. J Clin Oncol. 2003;21(19):3616–3622. - PubMed
    1. Van Vlierberghe P, Ferrando A. The molecular basis of T cell acute lymphoblastic leukemia. J Clin Invest. 2012;122(10):3398–3406. - PMC - PubMed
    1. Ferrando AA, Neuberg DS, Staunton J, et al. Gene expression signatures define novel oncogenic pathways in T cell acute lymphoblastic leukemia. Cancer Cell. 2002;1(1):75–87. - PubMed
    1. Homminga I, Pieters R, Langerak AW, et al. Integrated transcript and genome analyses reveal NKX2-1 and MEF2C as potential oncogenes in T cell acute lymphoblastic leukemia. Cancer Cell. 2011;19(4):484–497. - PubMed
    1. Soulier J, Clappier E, Cayuela JM, et al. HOXA genes are included in genetic and biologic networks defining human acute T-cell leukemia (T-ALL). Blood. 2005;106(1):274–286. - PubMed

Publication types

MeSH terms