. 2014 Nov 15;193(10):5013-22.
doi: 10.4049/jimmunol.1302401. Epub 2014 Oct 15.

Regulatory T cells in central nervous system injury: a double-edged sword

Affiliations

Regulatory T cells in central nervous system injury: a double-edged sword

James T Walsh et al. J Immunol. .

Abstract

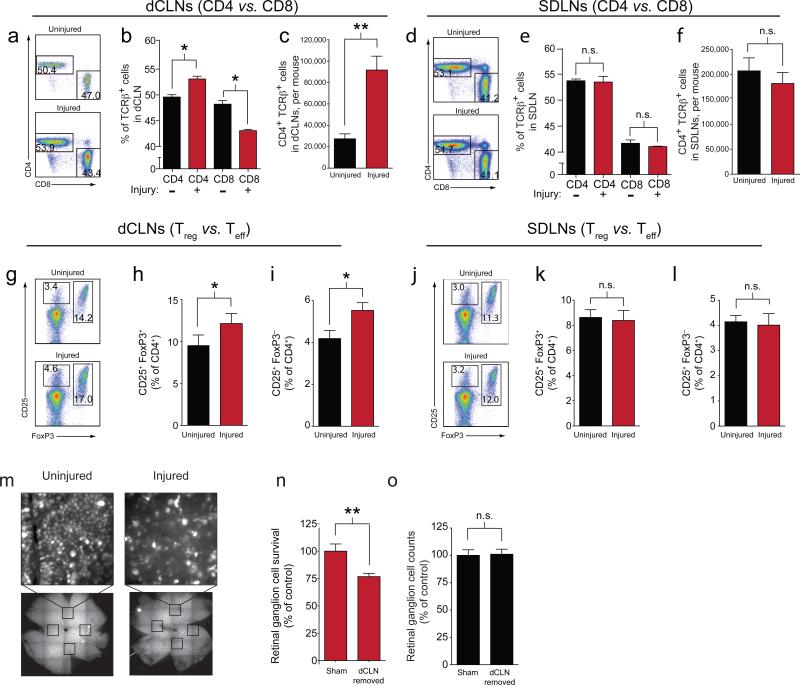
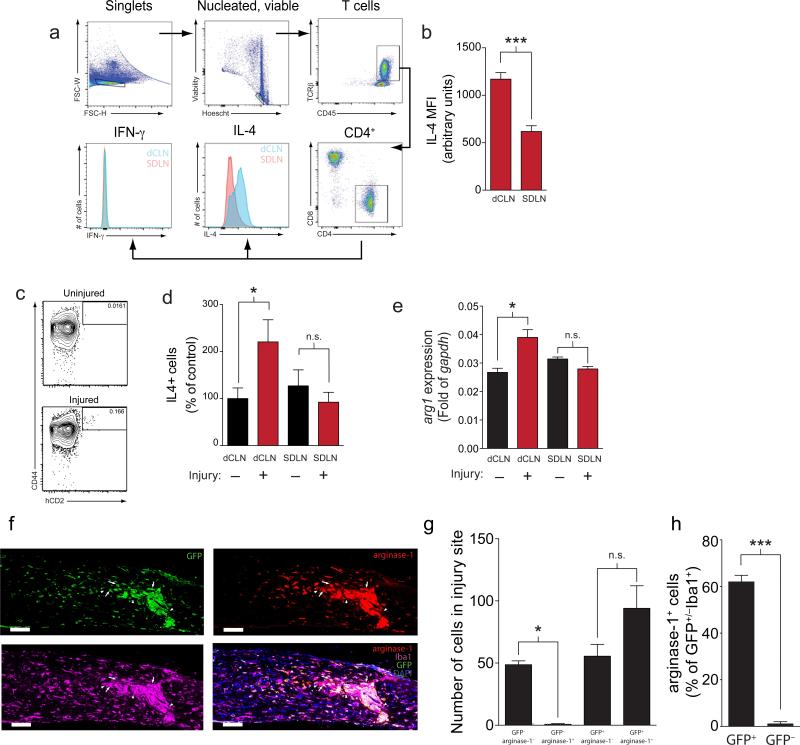
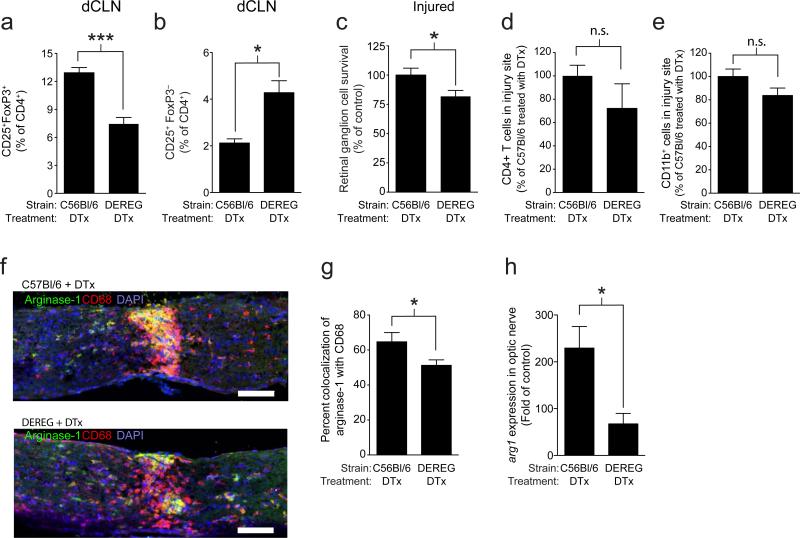
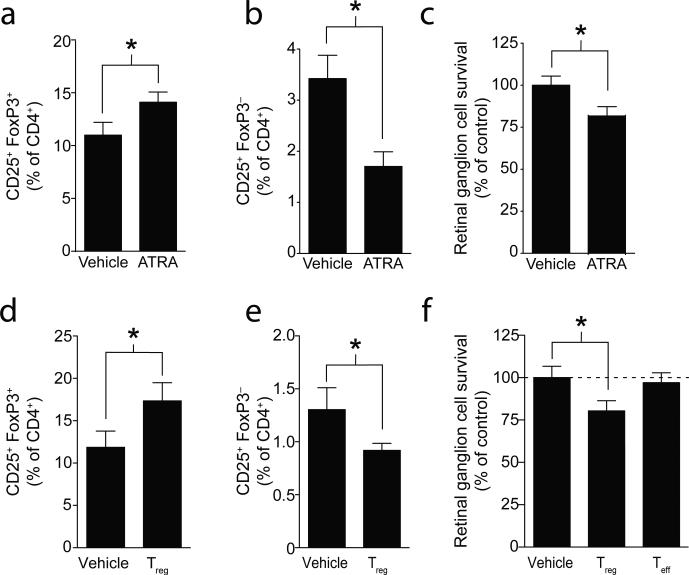
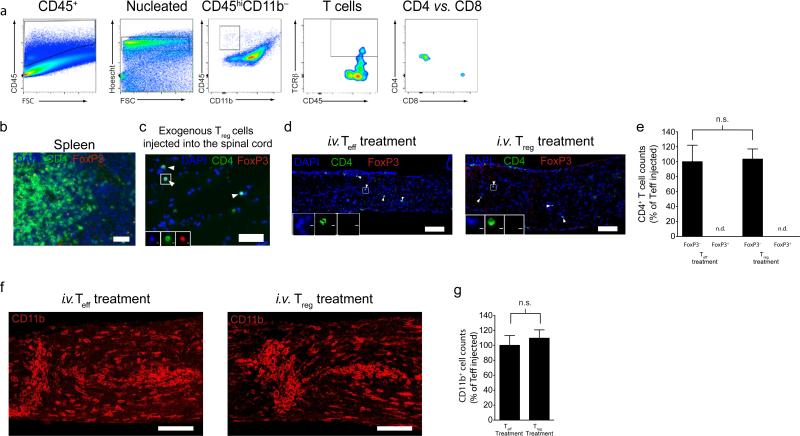
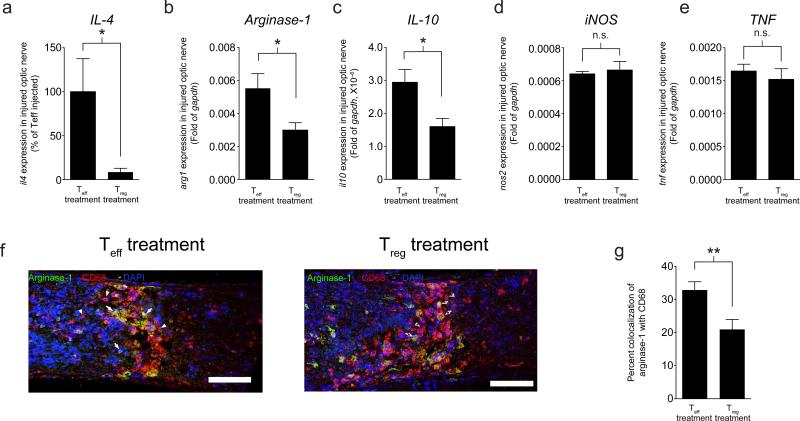
Previous research investigating the roles of T effector (T(eff)) and T regulatory (T(reg)) cells after injury to the CNS has yielded contradictory conclusions, with both protective and destructive functions being ascribed to each of these T cell subpopulations. In this work, we study this dichotomy by examining how regulation of the immune system affects the response to CNS trauma. We show that, in response to CNS injury, T(eff) and T(reg) subsets in the CNS-draining deep cervical lymph nodes are activated, and surgical resection of these lymph nodes results in impaired neuronal survival. Depletion of T(reg), not surprisingly, induces a robust T(eff) response in the draining lymph nodes and is associated with impaired neuronal survival. Interestingly, however, injection of exogenous T(reg) cells, which limits the spontaneous beneficial immune response after CNS injury, also impairs neuronal survival. We found that no T(reg) accumulate at the site of CNS injury, and that changes in T(reg) numbers do not alter the amount of infiltration by other immune cells into the site of injury. The phenotype of macrophages at the site, however, is affected: both addition and removal of T(reg) negatively impact the numbers of macrophages with alternatively activated (tissue-building) phenotype. Our data demonstrate that neuronal survival after CNS injury is impaired when T(reg) cells are either removed or added. With this exacerbation of neurodegeneration seen with both addition and depletion of T(reg), we recommend exercising extreme caution when considering the therapeutic targeting of T(reg) cells after CNS injury, and possibly in chronic neurodegenerative conditions.


Figures

Figure 1
Figure 1. The deep cervical lymph nodes display an immune response after CNS injury and their resection exacerbates neuronal survival
(a) Flow cytometry of CD4+ and CD8+ lymphocytes in the deep cervical lymph nodes from uninjured mice or from mice 5 days post-injury. Numbers indicate percent CD4+ and CD8+ T cells, as a percentage of TCRβ+ cells. (b, c) Frequency of CD4+ and CD8+ as a percent of TCRβ+ lymphocytes (b) and number of CD4+TCRβ+ T cells (c) in the deep cervical lymph nodes, as quantified by flow cytometry 5 days after injury (n = 3 per group; *, p < 0.05; **, p < 0.01; Student's t-test; representative of > 3 experiments). (d) Flow cytometry of CD4+ and CD8+ lymphocytes in the skin-draining lymph nodes of uninjured mice or from mice 5 days post-injury. Numbers indicate percent CD4+ and CD8+ T cells, as a percentage of TCRβ+ cells. (e, f) Frequency of CD4+ and CD8+ T cells, as a percent of TCRβ+ cells (e) and number of CD4+ T cells (f) in the skin draining lymph nodes 5 days post-injury, as quantified by flow cytometry (n = 3 per group; Student's t-test; representative of > 3 experiments). (g) Flow cytometry of CD4+ lymphocytes in the deep cervical lymph node of uninjured mice or from mice 5 days post-injury. Numbers indicate percent activated Teff and Treg cells, as a percentage of CD4+ cells. (h, i) Frequency of Treg (h) and Teff (i) cells in the dCLNs as a percent of the uninjured dCLN (n = 6 per group; *, p < 0.05, Student's t-test, representative of two experiments). (j) Flow cytometry of CD4+ lymphocytes in the skin-draining lymph nodes of uninjured mice or from mice 5 days post-injury. Numbers indicate percent activated Teff and Treg cells, as a percentage of CD4+ cells. (k, l) Frequency of Treg (k) and Teff (l) cells in the SDLNs as a percent of the uninjured SDLN (n = 6 per group; Student's t-test; representative of two experiments). (m) Representative images of Fluoro-gold stained retinas from uninjured or injured eyes. Boxes represent fields counted for retinal ganglion cell quantification. (n) Neuronal survival of mice receiving sham surgery or undergoing deep cervical lymph node removal 2 weeks prior to injury, as assessed by Fluoro-gold staining. Survival is quantified as a percent of control survival (n = 11 sham and 12 dCLN removed; **, p < 0.01, Student's t-test; representative of two experiments). (o) Retinal ganglion cell counts of the contralateral uninjured retina of mice receiving sham surgery or undergoing deep cervical lymph node removal 2 weeks prior to injury, as assessed by Fluoro-gold staining. RGC counts are quantified as a percent of the control (n = 11 sham and 12 dCLN removed; Student's t-test; representative of two experiments).
Figure 2
Figure 2. CNS injury promotes a milieu conducive to alternative activation of macrophages in the deep cervical lymph nodes
(a) Gating strategy and representative staining of IL-4 production by CD4+ T cells in the draining deep cervical lymph nodes and skin-draining lymph nodes after CNS injury. (b) Quantification of the mean fluorescence intensity of IL-4 staining of CD4+ T cells in the deep cervical lymph node or skin-draining lymph node (n = 4 per group; ***, p < 0.001; Student's t-test; representative of two experiments). (c) Representative staining of hCD2 (IL-4) production by CD4+ T cells in the draining deep cervical lymph nodes in injured and uninjured mice. (d) Quantification of the number of hCD2+ staining of CD4+ T cells in the deep cervical lymph node or skin-draining lymph node in uninjured and injured mice (n = 5 per group; *, p < 0.05; Student's t-test; representative of two experiments). (e) arg1 mRNA expression of bone-marrow derived macrophages that had been co-cultured with CD4+ T cells from the indicated lymph nodes of mice with or without optic nerve injury for 24 hours (n = 3 per group; *, p < 0.05; One-way ANOVA with Bonferroni's post-test; representative of > 3 experiments). (f) Representative images of injured optic nerves of GFP ⇒ C57Bl/6 bone marrow chimeras stained for arginase-1 and Iba1. Arrowheads point to GFP radio-resistant microglia, while arrows point to infiltrating macrophages (scale bar = 100 μm). (g) Quantification of percent of Iba1+ cells in the injured optic nerve that are GFP+arginase-1+, GFP+arginase-1, GFParginase-1+, and GFParginase-1 (n = 3 per group; One-way ANOVA with Bonferroni's post-test; *, p < 0.05). (h) Quantification of the percent of GFP+ and GFP cells that are arginase-1+ in the injured optic nerve (n = 3 per group; Student's t-test; ***, p < 0.001).
Figure 3
Figure 3. Alleviation of Treg suppression after CNS injury leads to a reduced neuronal survival after optic nerve injury
(a, b) Bar graphs represent quantification of flow cytometry analysis of the deep cervical lymph nodes of DEREG or wild type littermates treated with DTx two days before injury and on the day of injury, showing percent of CD25+Foxp3+ Treg cells (a) and of CD25+Foxp3 Teff cells (b), graphed as a percentage of TCRβ+CD4+ cells (n = 12 wild type and 9 DEREG treated mice; ***, p < 0.001; *, p < 0.05; Student's t-test; representative of three experiments). (c) Neuronal survival after optic nerve injury in DEREG and wild type mice injected with 40 μg/kg DTx two days before injury and on the day of injury. Survival is quantified as a percent of control survival. (n = 19 wild type and 25 DEREG; *, p < 0.05, Student's t-test, representative of three experiments). (d) Quantification of the number of CD4+ T cells found in the injury site of DEREG mice treated with DTx normalized to the number of CD4+ T cells found in the injury site of C57Bl/6 mice treated with DTx. (n = 3 per group; Student's t-test; representative of 2 experiments) (e) Quantification of the number of CD11b+ cells found in the injury site, normalized to the number of CD11b+ T cells found in the injury site of C57Bl/6 mice treated with DTx. (n = 3 C57Bl/6 treated with DTx and 9 DEREG treated with DTx, Student's t-test; representative of 2 experiments) (f) Representative images of CD68 and arginase-1 in injured optic nerve of DEREG and WT mice treated with two doses of 40 μg/kg DTx. (g) Arginase-1+ area graphed as a percent of CD68+ area in C57Bl/6 or DEREG mice treated with DTx (n = 3 C57Bl/6 treated with DTx and 8 DEREG treated with DTx; *, p < 0.05; Student's t-test). (h) Quantitative PCR for arg1 of optic nerves of C57Bl/6 or DEREG mice treated with 40 μg/kg DTx 2 days before injury and on the day of injury normalized to arg1 expression in the contralateral uninjured nerve (n = 7 C57Bl/6 treated with DTx and 4 DEREG treated with DTx; *, p < 0.05; Student's t-test; representative of 2 experiments).
Figure 4
Figure 4. Potentiation of Treg function impairs neuronal survival after optic nerve injury
(a, b) Bar graphs represent quantification of flow cytometry analysis of the deep cervical lymph nodes of wild type mice treated with vehicle or ATRA showing percent of CD25+Foxp3+ Treg cells (a) and of CD25+Foxp3 Teff cells (b), graphed as a percentage of TCRβ+CD4+ cells (n = 7 vehicle treated and n = 9 ATRA treated; *, p < 0.05, Student's t-test; representative of two experiments (c) Retinal ganglion cell survival in wild type mice treated with vehicle or ATRA. Survival is quantified as a percent of control survival. (n = 7, vehicle and n = 9, ATRA; *, p < 0.05, Student's t-test, representative of two experiments). (d, e) Bar graphs represent quantification of flow cytometry analysis of deep cervical lymph nodes of wild type mice treated with vehicle or 1×10⁶ exogenous Treg cells one day before injury and one day after injury, showing percent of CD25+Foxp3+ Treg cells (d) and of CD25+Foxp3 Teff cells (e), graphed as a percentage of TCRβ+CD4+ cells (n = 12 Treg cells injected and n = 13 vehicle injected; *, p < 0.05, Student's t-test). (f) Neuronal survival in wild type mice injected with vehicle, 1×10⁶ Treg or 1×10⁶ Teff cells two days before injury and on the day of injury. Survival is quantified as a percent of control survival (n = 13 vehicle injected, 12 Treg cell injected, and 7 Teff cell injected; *, p < 0.05, One-way ANOVA with Bonferroni's post-test; representative of two experiments).
Figure 5
Figure 5. Boost with exogenous Treg cells does not alter immune cell infiltration into the injury site
(a) Representative gates of flow cytometry of CD4+ and CD8+ lymphocytes in the injured optic nerve seven days post-injury. Optic nerves were pooled from eight mice, and cells were stained for analysis by flow cytometry. (b) Representative image from splenic tissue stained for CD4 (green) and Foxp3 (red) (scale bar = 100 μm). (c) Representative image from spinal cord tissue directly injected (ex vivo) with in vitro induced regulatory T cells stained for CD4 (green) and Foxp3 (red) (scale bar = 50 μm). (d) Representative images of CD4+Foxp3 and CD4+Foxp3+ T cells in the optic nerve parenchyma of Teff- and Treg-treated mice (scale bar = 100 μm). (e) Quantification of the number of CD4+Foxp3 and CD4+Foxp3+ T cells in the optic nerve parenchyma of Teff and Treg treated mice (n = 4 mice per group; One-way ANOVA with Bonferroni's post-test; scale bar = 100 μm). (f) Representative images of CD11b+ cells in injury site of the optic nerve of Teff- and Treg-treated mice (scale bar = 100 μm). (g) Quantification of the number of CD11b+ cells in injury site of the optic nerve of Teff and Treg treated mice (n = 9 mice per group; Student's t-test; representative of two experiments).
Figure 6
Figure 6. Treg cell injection leads to a loss of an alternative activation phenotype of myeloid cells at the site of injury
Optic nerves of Teff- and Treg- cell injected mice were collected 7 days post injury and examined for expression of the following genes relative to expression of gapdh (a) il4 (n = 11 per group *, p < 0.05; Student's t-test; representative of two experiments); (b) arg1; (c) il10; (d) nos2; (e) tnf; (b-e; n = 6 per group; *, p < 0.05; Student's t-test); (f) Representative images of Teff- and Treg- cell injected mice 7 days after injury stained for arginase-1 (green) and CD68 (red) (scale bar = 100 μm). (g) Arginase-1+ area graphed as a percent of CD68+ area in Teff- and Treg- cell injected mice 7 days post-injury (n = 9 Teff cell injected and 6 Treg cell injected; **, p < 0.01; Student's t-test; representative of two experiments).

References

    1. Yoles E, Schwartz M. Degeneration of spared axons following partial white matter lesion: implications for optic nerve neuropathies. Experimental Neuroloy. 1998;153:1–7. - PubMed
    1. Davalos D, Grutzendler J, Yang G, Kim JV, Zuo Y, Jung S, Littman DR, Dustin ML, Gan WB. ATP mediates rapid microglial response to local brain injury in vivo. Nat Neurosci. 2005;8:752–758. - PubMed
    1. Ransohoff RM. Chemokines and chemokine receptors: standing at the crossroads of immunobiology and neurobiology. Immunity. 2009;31:711–721. - PMC - PubMed
    1. Moalem G, Leibowitz-Amit R, Yoles E, Mor F, Cohen IR, Schwartz M. Autoimmune T cells protect neurons from secondary degeneration after central nervous system axotomy. Nat Med. 1999;5:49–55. - PubMed
    1. Serpe CJ, Kohm AP, Huppenbauer CB, Sanders VM, Jones KJ. Exacerbation of facial motoneuron loss after facial nerve transection in severe combined immunodeficient (scid) mice. J Neurosci. 1999;19:Rc7. - PMC - PubMed

Publication types

MeSH terms