. 2015 Jan;89(1):110-9.
doi: 10.1128/JVI.01765-14. Epub 2014 Oct 15.

Complex T-cell receptor repertoire dynamics underlie the CD8+ T-cell response to HIV-1

Affiliations

Complex T-cell receptor repertoire dynamics underlie the CD8+ T-cell response to HIV-1

Ana I Costa et al. J Virol. 2015 Jan.

Abstract

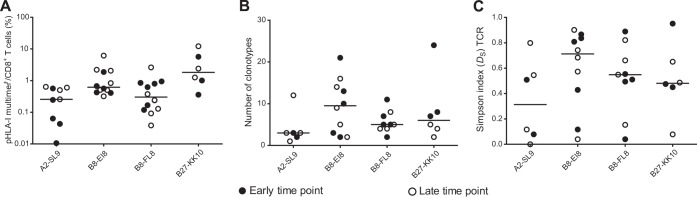
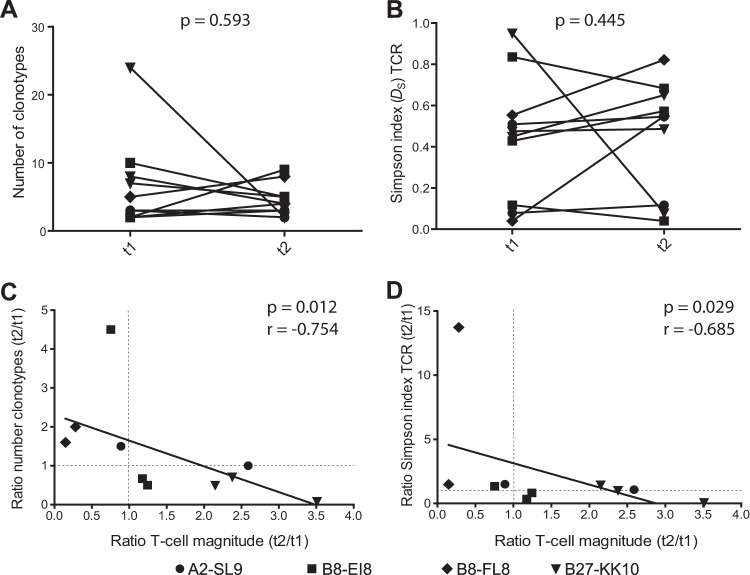
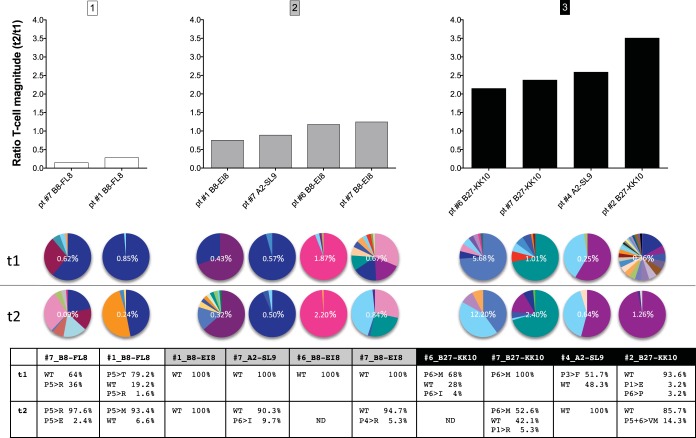
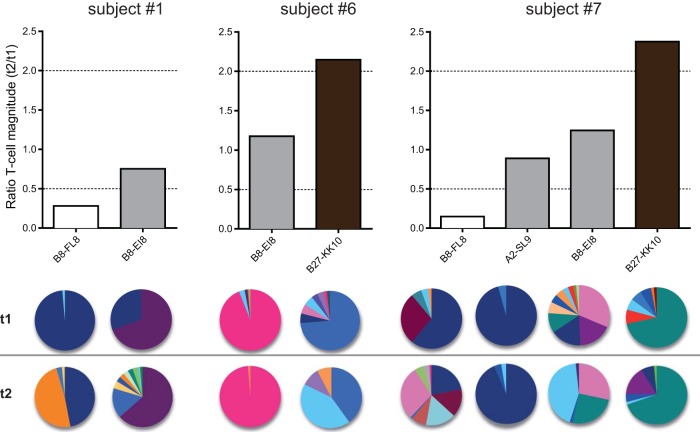
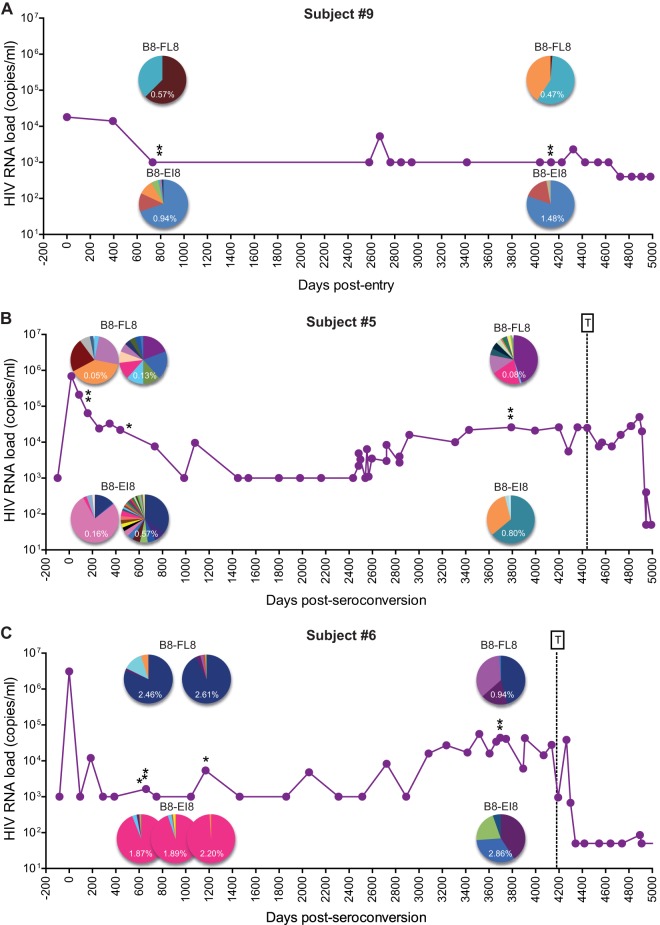
Although CD8(+) T cells are important for the control of HIV-1 in vivo, the precise correlates of immune efficacy remain unclear. In this study, we conducted a comprehensive analysis of viral sequence variation and T-cell receptor (TCR) repertoire composition across multiple epitope specificities in a group of antiretroviral treatment-naive individuals chronically infected with HIV-1. A negative correlation was detected between changes in antigen-specific TCR repertoire diversity and CD8(+) T-cell response magnitude, reflecting clonotypic expansions and contractions related to alterations in cognate viral epitope sequences. These patterns were independent of the individual, as evidenced by discordant clonotype-specific transitions directed against different epitopes in single subjects. Moreover, long-term asymptomatic HIV-1 infection was characterized by evolution of the TCR repertoire in parallel with viral replication. Collectively, these data suggest a continuous bidirectional process of adaptation between HIV-1 and virus-specific CD8(+) T-cell clonotypes orchestrated at the TCR-antigen interface.

Importance: We describe a relation between viral epitope mutation, antigen-specific T-cell expansion, and the repertoire of responding clonotypes in chronic HIV-1 infection. This work provides insights into the process of coadaptation between the human immune system and a rapidly evolving lentivirus.


Figures

FIG 1
FIG 1
Analysis of CD8+ T-cell populations directed against A2-SL9, B8-EI8, B8-FL8, and B27-KK10. (A) Antigen-specific CD8+ T cells were labeled with pHLA-I tetramers and quantified by flow cytometry. Response magnitude is shown as the frequency of tetramer-positive (multimer+) events in the total CD8+ T-cell population. (B and C) TCRβ diversity was quantified using the relative number of clonotypes (B) and Simpson's diversity index (C). Data are shown for each individual at both the early and late time points.
FIG 2
FIG 2
CD8+ T-cell repertoire diversity is not related to viral epitope variation. Antigen-specific TCRβ repertoire diversity (Simpson's diversity index) and viral epitope sequences were determined in parallel for a subset of samples (n = 22). The percentage of wild-type (WT) epitope sequences (A) and the number of variant epitopes present at the time of analysis (B) were used as measures of epitope composition in the autologous viral quasispecies. All plots include data derived from the early and late time points. Correlation testing for data in panel A was performed using the Spearman rank test. Note that Simpson's diversity index was determined after data normalization for appropriate diversity comparisons (see Materials and Methods for details).
FIG 3
FIG 3
Longitudinal variations in CD8+ T-cell response magnitude correlate negatively with TCRβ diversity. (A and B) TCRβ diversity was quantified at the early (t1) and late (t2) time points for a subset of antigen-specific CD8+ T-cell responses (n = 10) using the relative number of clonotypes (A) and Simpson's diversity index (B). Statistical analyses were performed using the Wilcoxon signed-rank test. (C and D) Changes in CD8+ T-cell response magnitude (ratio of t2 to t1) were related to differences in TCRβ diversity (ratio of t2 to t1) determined by the relative number of clonotypes (C) and Simpson's diversity index (D). Each dot represents a CD8+ T-cell response analyzed at two time points. Correlation testing was performed using the Spearman rank test.
FIG 4
FIG 4
The relationship between CD8+ T-cell response magnitude, TCRβ diversity, and viral epitope variation. Antigen-specific CD8+ T-cell responses were stratified according to changes in magnitude over time (ratio of t2 to t1). The bar graphs at the top represent CD8+ T-cell responses that subsided over time (A), remained stable over time (B), or increased over time (C). The clonotypic composition of each CD8+ T-cell population is illustrated in the pie charts (middle), with each color illustrating a unique clonotype, and the respective viral epitope sequences are shown in the chart at the bottom (where P5>R, for example, indicates the substitution of an R residue at position 5). Response magnitudes are indicated in the pie charts as the frequency of tetramer-positive events in the total CD8+ T-cell population. Pie chart colors match clonotypes for each epitope pair but do not correspond between pairs. pt, patient.
FIG 5
FIG 5
CD8+ T-cell response evolution is not dependent on the individual. Antigen-specific CD8+ T-cell responses were stratified according to subject origin. Bar colors in the upper panel are adapted from Fig. 4 and represent decreasing (white), stable (gray), and increasing (black) response magnitudes over time. The clonotypic composition of each CD8+ T-cell population is illustrated in the pie charts. Each color in a pie chart represents a unique clonotype. Pie chart colors match clonotypes for each epitope pair but do not correspond between pairs.
FIG 6
FIG 6
TCR repertoire evolution and viral load dynamics during long-term asymptomatic infection. Viral load trajectories and CD8+ T-cell repertoires specific for B8-FL8 and B8-EI8 are shown for subject 9 (A), subject 5 (B), and subject 6 (C). Each color in a pie chart illustrates a unique clonotype. Pie chart colors match clonotypes for each epitope in each individual but do not correspond between epitopes or individuals. Single asterisks correspond to the time points described in Table 1. Double asterisks correspond to additional time points (see Table SI in the supplemental material). T denotes the commencement of antiretroviral therapy.

References

    1. Goulder PJ, Watkins DI. 2008. Impact of MHC class I diversity on immune control of immunodeficiency virus replication. Nat Rev Immunol 8:619–630. doi:10.1038/nri2357. - DOI - PMC - PubMed
    1. Seder RA, Darrah PA, Roederer M. 2008. T-cell quality in memory and protection: implications for vaccine design. Nat Rev Immunol 8:247–258. doi:10.1038/nri2274. - DOI - PubMed
    1. Appay V, Douek DC, Price DA. 2008. CD8+ T cell efficacy in vaccination and disease. Nat Med 14:623–628. doi:10.1038/nm.f.1774. - DOI - PubMed
    1. Bangham CR. 2009. CTL quality and the control of human retroviral infections. Eur J Immunol 39:1700–1712. doi:10.1002/eji.200939451. - DOI - PubMed
    1. Turner SJ, La Gruta NL, Kedzierska K, Thomas PG, Doherty PC. 2009. Functional implications of T cell receptor diversity. Curr Opin Immunol 21:286–290. doi:10.1016/j.coi.2009.05.004. - DOI - PMC - PubMed

Publication types