

Real time shear wave elastography in chronic liver diseases: accuracy for predicting liver fibrosis, in comparison with serum markers
- PMID: 25320528
- PMCID: PMC4194574
- DOI: 10.3748/wjg.v20.i38.13920
Real time shear wave elastography in chronic liver diseases: accuracy for predicting liver fibrosis, in comparison with serum markers
Abstract
Aim: To evaluate the correlation between liver stiffness measurement (LSM) by real-time shear wave elastography (SWE) and liver fibrosis stage and the accuracy of LSM for predicting significant and advanced fibrosis, in comparison with serum markers.
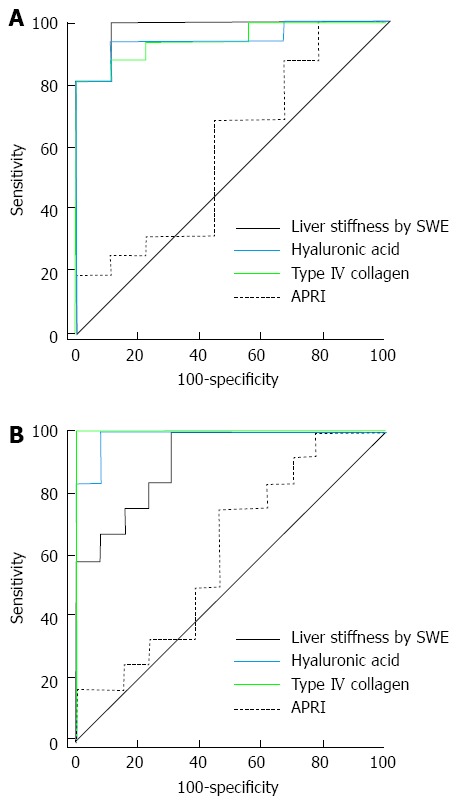
Methods: We consecutively analyzed 70 patients with various chronic liver diseases. Liver fibrosis was staged from F0 to F4 according to the Batts and Ludwig scoring system. Significant and advanced fibrosis was defined as stage F ≥ 2 and F ≥ 3, respectively. The accuracy of prediction for fibrosis was analyzed using receiver operating characteristic curves.
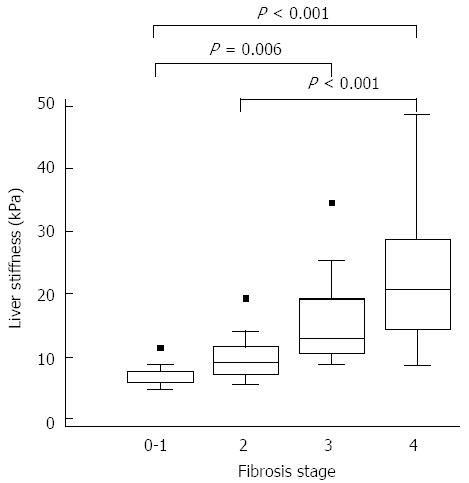
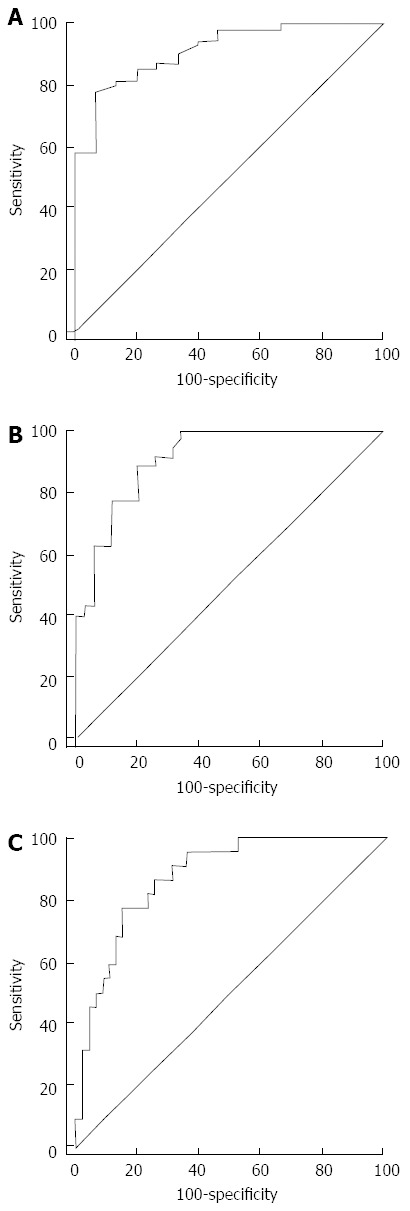
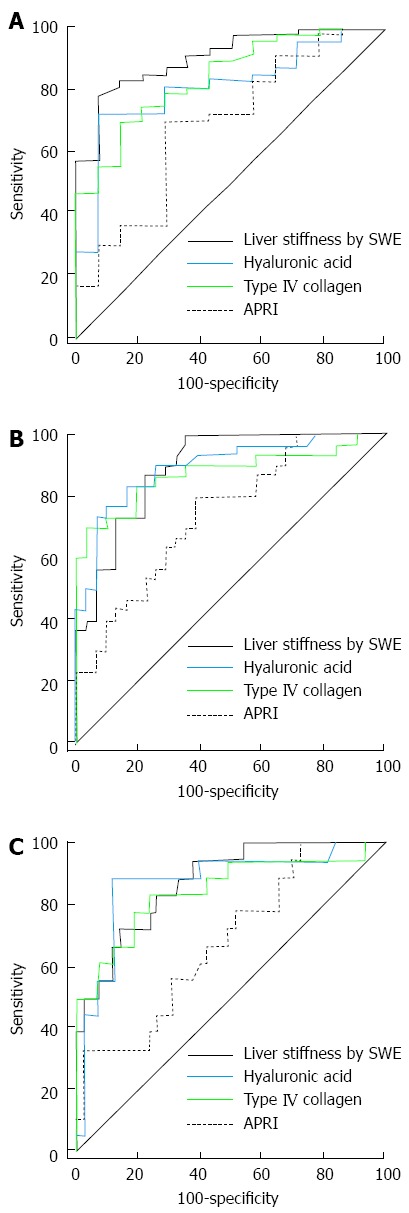
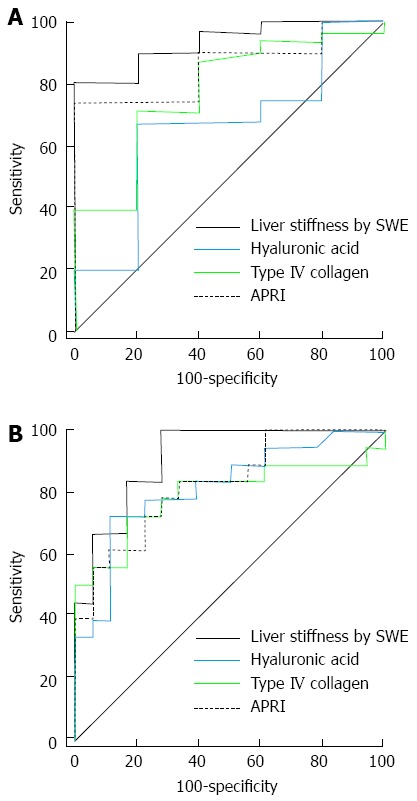
Results: Seventy patients, 15 were belonged to F0-F1 stage, 20 F2, 13 F3 and 22 F4. LSM was increased with progression of fibrosis stage (F0-F1: 6.77 ± 1.72, F2: 9.98 ± 3.99, F3: 15.80 ± 7.73, and F4: 22.09 ± 10.09, P < 0.001). Diagnostic accuracies of LSM for prediction of F ≥ 2 and F ≥ 3 were 0.915 (95%CI: 0.824-0.968, P < 0.001) and 0.913 (95%CI: 0.821-0.967, P < 0.001), respectively. The cut-off values of LSM for prediction of F ≥ 2 and F ≥ 3 were 8.6 kPa with 78.2% sensitivity and 93.3% specificity and 10.46 kPa with 88.6% sensitivity and 80.0% specificity, respectively. However, there were no significant differences between LSM and serum hyaluronic acid and type IV collagen in diagnostic accuracy.
Conclusion: SWE showed a significant correlation with the severity of liver fibrosis and was useful and accurate to predict significant and advanced fibrosis, comparable with serum markers.
Keywords: Elastography; Liver biopsy; Liver fibrosis; Liver stiffness; Serum markers.
Figures
Similar articles
-
Accuracy of real-time shear wave elastography for assessing liver fibrosis in chronic hepatitis C: a pilot study.Hepatology. 2012 Dec;56(6):2125-33. doi: 10.1002/hep.25936. Epub 2012 Aug 31. Hepatology. 2012. PMID: 22767302
-
Study of detection times for liver stiffness evaluation by shear wave elastography.World J Gastroenterol. 2014 Jul 28;20(28):9578-84. doi: 10.3748/wjg.v20.i28.9578. World J Gastroenterol. 2014. PMID: 25071355 Free PMC article.
-
Assessment of liver fibrosis by Fibroscan as compared to liver biopsy in biliary atresia.World J Gastroenterol. 2015 Jun 14;21(22):6931-6. doi: 10.3748/wjg.v21.i22.6931. World J Gastroenterol. 2015. PMID: 26078570 Free PMC article.
-
Imaging-based noninvasive liver disease assessment for staging liver fibrosis in chronic liver disease: A systematic review supporting the AASLD Practice Guideline.Hepatology. 2025 Feb 1;81(2):725-748. doi: 10.1097/HEP.0000000000000852. Epub 2024 Mar 15. Hepatology. 2025. PMID: 38489521
-
Clinical Utility of Non-Invasive Tests for Liver Fibrosis in People Living With Alpha-1 Antitrypsin Deficiency.Liver Int. 2025 Jul;45(7):e70165. doi: 10.1111/liv.70165. Liver Int. 2025. PMID: 40478205 Free PMC article. Review.
Cited by
-
Shear-wave elastography for evaluation of hepatic stiffness in chronic viral hepatitis B and C.Clin Exp Hepatol. 2023 Jun;9(2):179-186. doi: 10.5114/ceh.2023.129112. Epub 2023 Jun 30. Clin Exp Hepatol. 2023. PMID: 37502433 Free PMC article.
-
Non-invasive assessment of liver fibrosis using two-dimensional shear wave elastography in patients with autoimmune liver diseases.World J Gastroenterol. 2017 Jul 14;23(26):4839-4846. doi: 10.3748/wjg.v23.i26.4839. World J Gastroenterol. 2017. PMID: 28765706 Free PMC article. Clinical Trial.
-
Non-invasive Markers of Liver Fibrosis: Adjuncts or Alternatives to Liver Biopsy?Front Pharmacol. 2016 Jun 20;7:159. doi: 10.3389/fphar.2016.00159. eCollection 2016. Front Pharmacol. 2016. PMID: 27378924 Free PMC article. Review.
-
Prediction of liver cirrhosis, using diagnostic imaging tools.World J Hepatol. 2015 Aug 18;7(17):2069-79. doi: 10.4254/wjh.v7.i17.2069. World J Hepatol. 2015. PMID: 26301049 Free PMC article. Review.
-
Shear wave elastography correlates with liver fibrosis scores in pediatric patients with liver disease.Pediatr Radiol. 2019 Dec;49(13):1742-1753. doi: 10.1007/s00247-019-04493-3. Epub 2019 Aug 15. Pediatr Radiol. 2019. PMID: 31418057
References
-
- Cho SW, Cheong JY. Clinical application of non-invasive diagnosis for hepatic fibrosis. Korean J Hepatol. 2007;13:129–137. - PubMed
-
- Dienstag JL. The role of liver biopsy in chronic hepatitis C. Hepatology. 2002;36:S152–S160. - PubMed
-
- Bravo AA, Sheth SG, Chopra S. Liver biopsy. N Engl J Med. 2001;344:495–500. - PubMed
-
- Bedossa P, Dargère D, Paradis V. Sampling variability of liver fibrosis in chronic hepatitis C. Hepatology. 2003;38:1449–1457. - PubMed
-
- Regev A, Berho M, Jeffers LJ, Milikowski C, Molina EG, Pyrsopoulos NT, Feng ZZ, Reddy KR, Schiff ER. Sampling error and intraobserver variation in liver biopsy in patients with chronic HCV infection. Am J Gastroenterol. 2002;97:2614–2618. - PubMed
Publication types
MeSH terms
Substances
LinkOut - more resources
Full Text Sources
Other Literature Sources
Medical
Miscellaneous
