. 2014 Oct 7:2:e614.
doi: 10.7717/peerj.614. eCollection 2014.

Stimulation of glucose uptake in murine soleus muscle and adipocytes by 5-(4-phenoxybutoxy)psoralen (PAP-1) may be mediated by Kv1.5 rather than Kv1.3

Affiliations

Stimulation of glucose uptake in murine soleus muscle and adipocytes by 5-(4-phenoxybutoxy)psoralen (PAP-1) may be mediated by Kv1.5 rather than Kv1.3

Robert A Ngala et al. PeerJ. .

Abstract

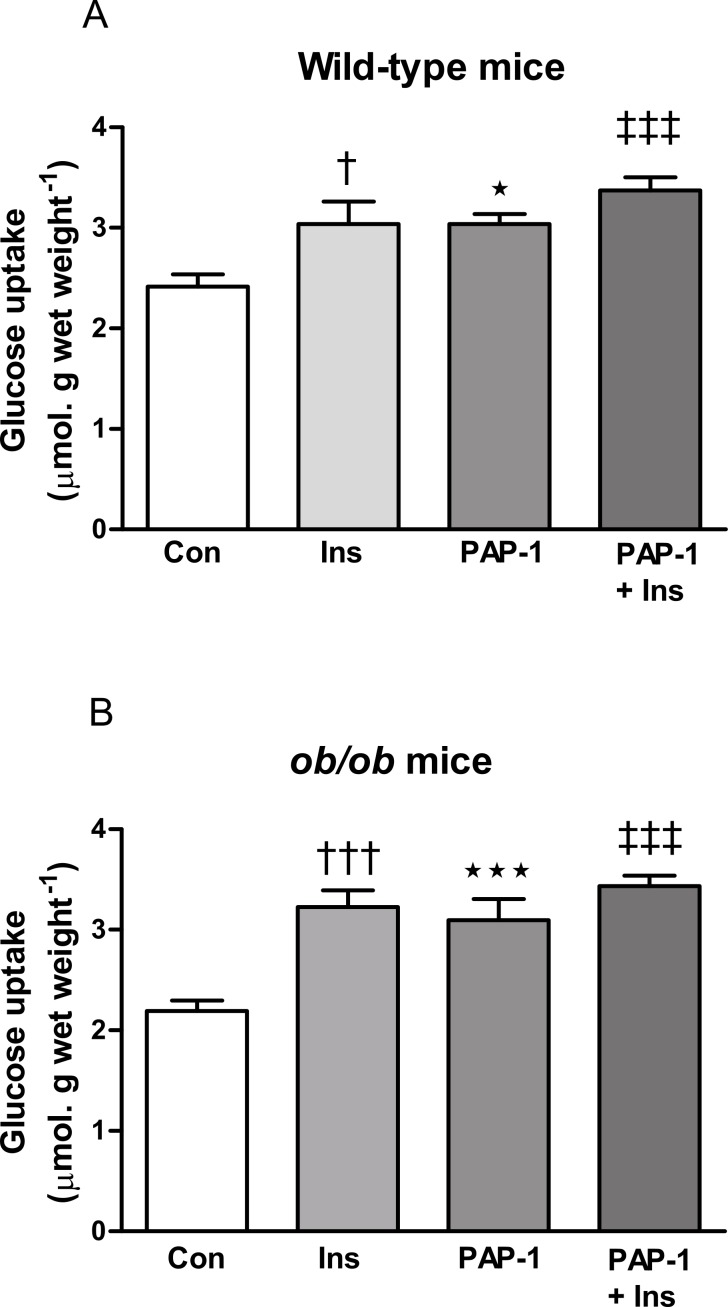
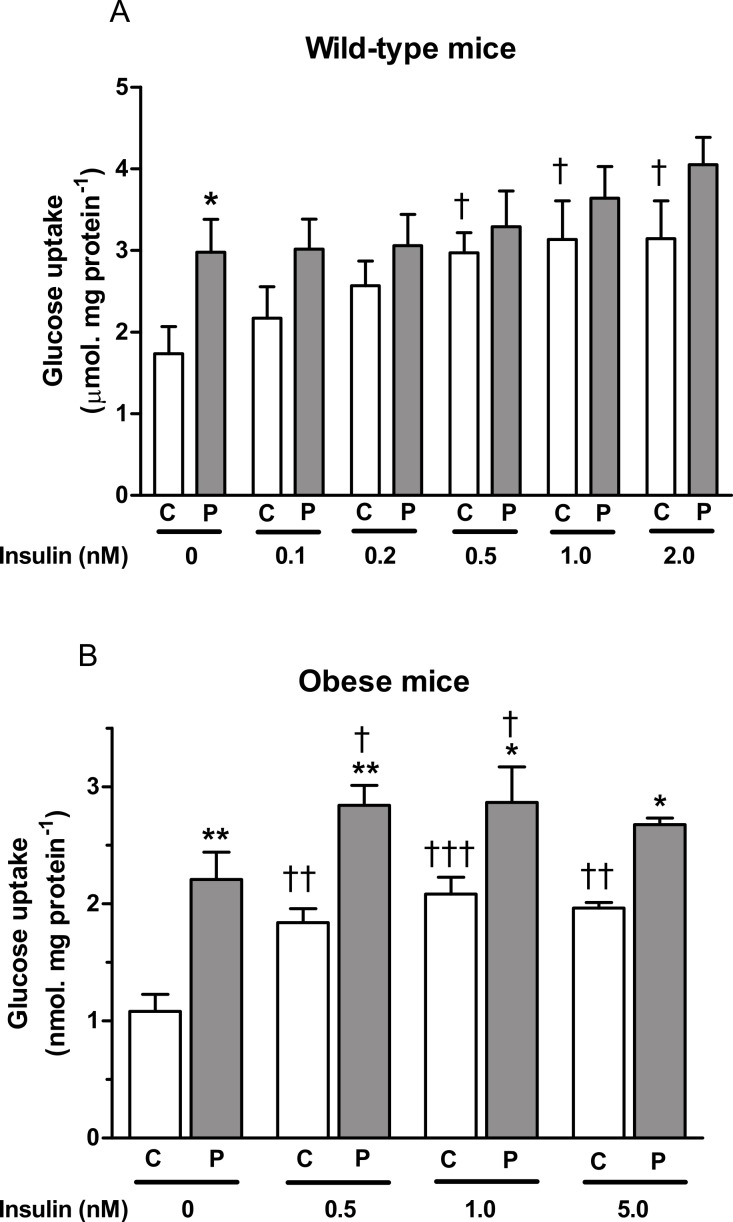
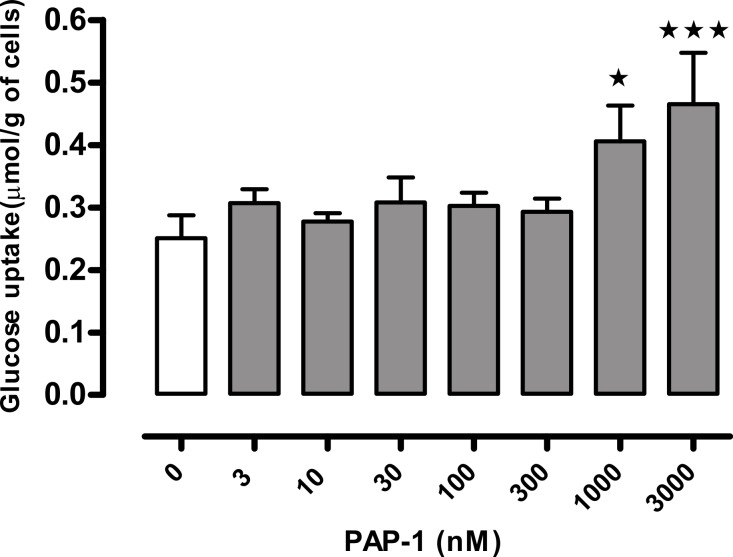
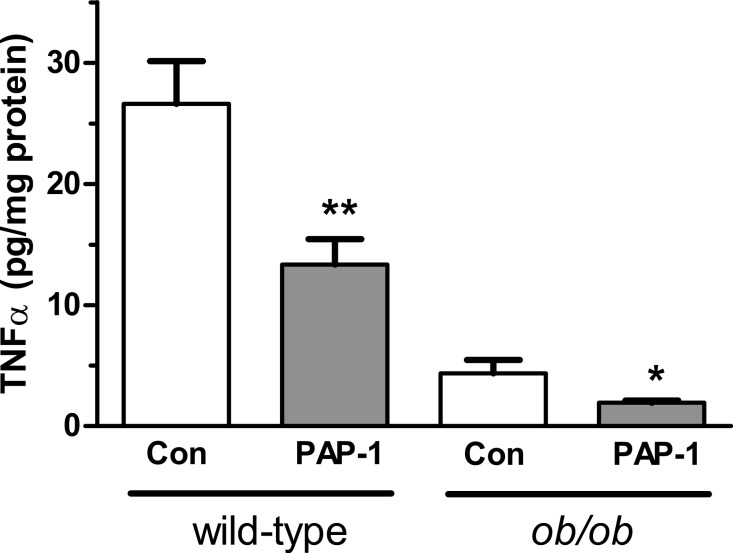
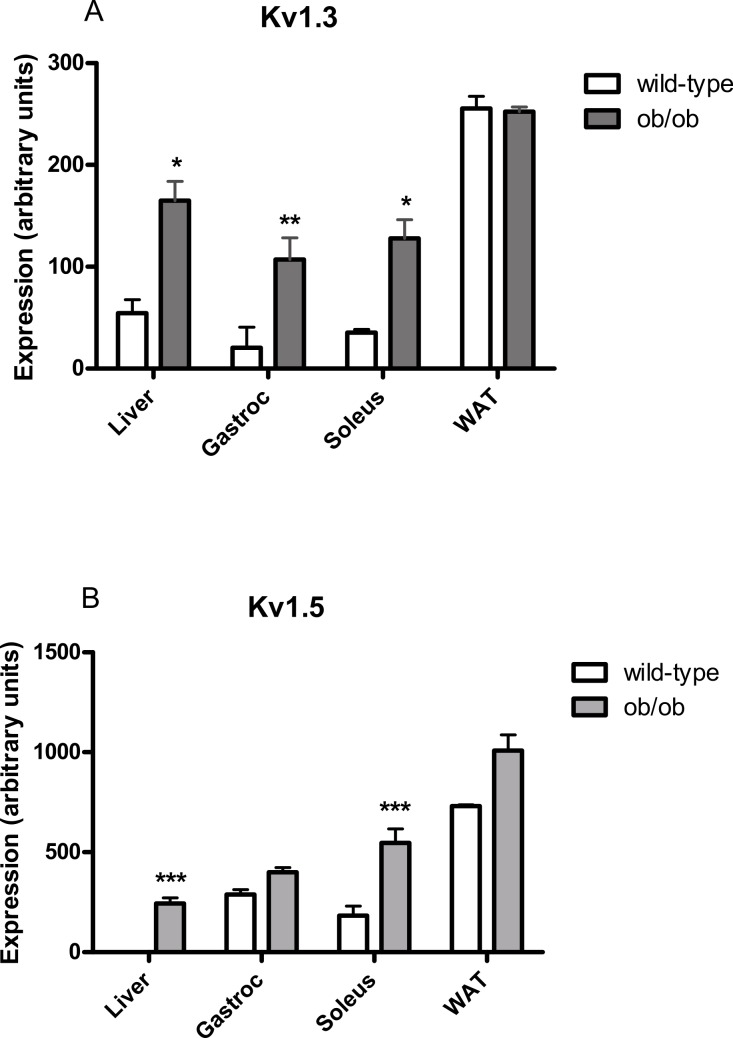
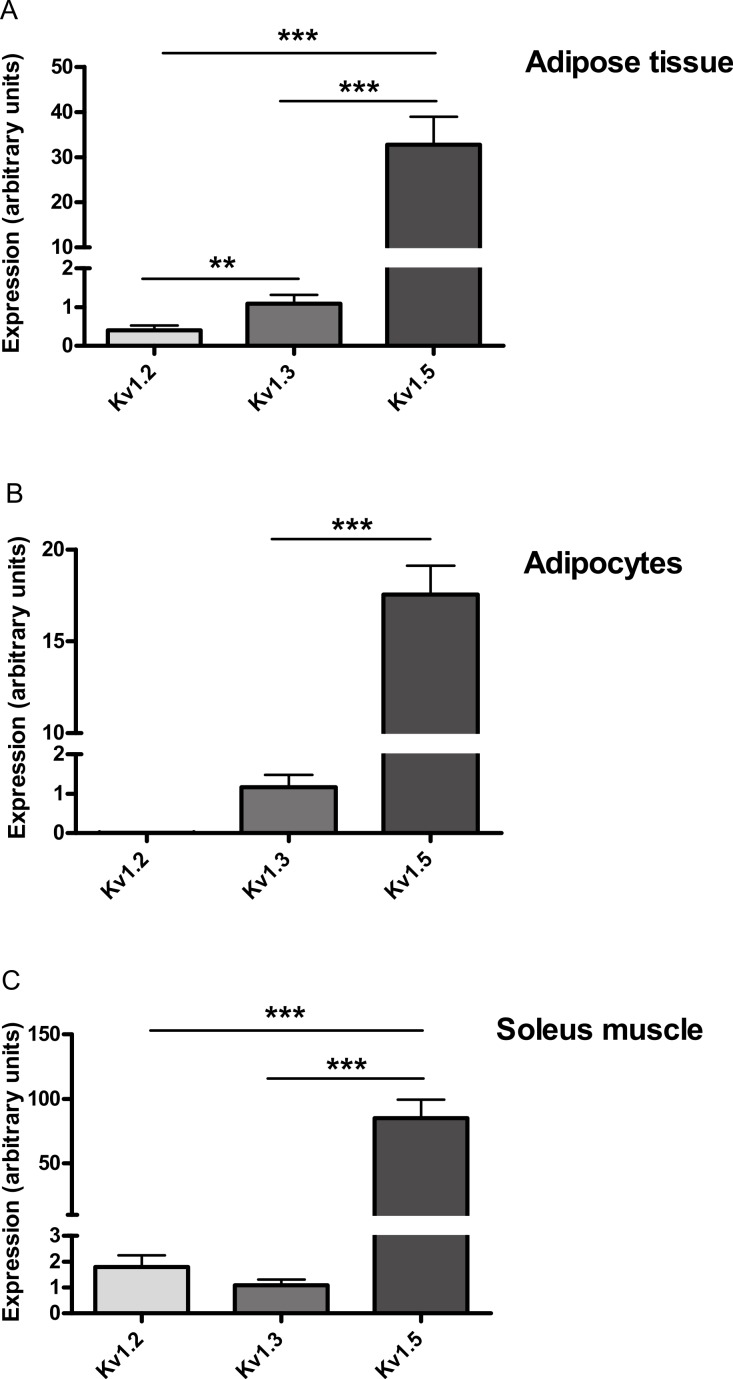
Kv1 channels are shaker-related potassium channels that influence insulin sensitivity. Kv1.3(-/-) mice are protected from diet-induced insulin resistance and some studies suggest that Kv1.3 inhibitors provide similar protection. However, it is unclear whether blockade of Kv1.3 in adipocytes or skeletal muscle increases glucose uptake. There is no evidence that the related channel Kv1.5 has any influence on insulin sensitivity and its expression in adipose tissue has not been reported. PAP-1 is a selective inhibitor of Kv1.3, with 23-fold, 32-fold and 125-fold lower potencies as an inhibitor of Kv1.5, Kv1.1 and Kv1.2 respectively. Soleus muscles from wild-type and genetically obese ob/ob mice were incubated with 2-deoxy[1-(14)C]-glucose for 45 min and formation of 2-deoxy[1-(14)C]-glucose-6-phosphate was measured. White adipocytes were incubated with D-[U-(14)C]-glucose for 1 h. TNFα and Il-6 secretion from white adipose tissue pieces were measured by enzyme-linked-immunoassay. In the absence of insulin, a high concentration (3 µM) of PAP-1 stimulated 2-deoxy[1-14C]-glucose uptake in soleus muscle of wild-type and obese mice by 30% and 40% respectively, and in adipocytes by 20% and 50% respectively. PAP-1 also stimulated glucose uptake by adipocytes at the lower concentration of 1 µM, but at 300 nM, which is still 150-fold higher than its EC50 value for inhibition of the Kv1.3 channel, it had no effect. In the presence of insulin, PAP-1 (3 µM) had a significant effect only in adipocytes from obese mice. PAP-1 (3 µM) reduced the secretion of TNFα by adipose tissue but had no effect on the secretion of IL-6. Expression of Kv1.1, Kv1.2, Kv1.3 and Kv1.5 was determined by RT-PCR. Kv1.3 and Kv1.5 mRNA were detected in liver, gastrocnemius muscle, soleus muscle and white adipose tissue from wild-type and ob/ob mice, except that Kv1.3 could not be detected in gastrocnemius muscle, nor Kv1.5 in liver, of wild-type mice. Expression of both genes was generally higher in liver and muscle of ob/ob mice compared to wild-type mice. Kv1.5 appeared to be expressed more highly than Kv1.3 in soleus muscle, adipose tissue and adipocytes of wild-type mice. Expression of Kv1.2 appeared to be similar to that of Kv1.3 in soleus muscle and adipose tissue, but Kv1.2 was undetectable in adipocytes. Kv1.1 could not be detected in soleus muscle, adipose tissue or adipocytes. We conclude that inhibition of Kv1 channels by PAP-1 stimulates glucose uptake by adipocytes and soleus muscle of wild-type and ob/ob mice, and reduces the secretion of TNFα by adipose tissue. However, these effects are more likely due to inhibition of Kv1.5 than to inhibition of Kv1.3 channels.

Keywords: Adipocyte; Glucose uptake; Kv1.3; Kv1.5; PAP-1; Potassium channel; Soleus muscle; TNFα.


Figures

Figure 1
Figure 1. Effect of PAP-1 on glucose uptake in soleus muscles of male (A) wild-type and (B) ob/ob C57Bl6 mice.
Muscles were treated with insulin (wild-type, 10 nM; ob/ob, 100 nM) or PAP-1 (3 µM) alone, or the combination of insulin and PAP-1. n = 8 mice per group for all columns. Data for each genotype were analyzed by one-way ANOVA followed by Fisher’s least significant difference test. P < 0.05; ∗∗∗ P < 0.001 for effect of PAP-1 compared to controls (Con). P < 0.05; †††P < 0.001 for effect of insulin (Ins) compared to controls. ‡‡‡P < 0.001 for the effect of the combination of PAP-1 and insulin compared to the absence of both compounds (Con). Note that in both wild-type and ob/ob mice, glucose uptake in the presence of the combination of PAP-1 and insulin was not significantly greater than in the absence of one of the compounds.
Figure 2
Figure 2. Effect of PAP-1 on glucose uptake in adipocytes of female (A) wild-type and (B) ob/ob C57Bl6 mice.
Adipocytes were treated with insulin, PAP-1 (P, 3 µM) alone, or a combination of insulin and PAP-1. n = 8 mice per group for all columns. Data for each genotype were analyzed by two-way ANOVA (sources of variation: PAP-1 and insulin concentrations), followed by Fisher’s least significant difference test, first for the paired columns at the same concentration of insulin, and second to test for an effect of insulin compared to the value obtained in the absence of insulin but in the presence of the same concentration (0 or 3 microM) of PAP-1. P < 0.05; ∗∗P < 0.01 for effect of PAP-1 compared to controls at the same concentration of insulin (C). P < 0.05; ††P < 0.01; †††P < 0.001 for effect of insulin compared to no insulin at the same concentration of PAP-1.
Figure 3
Figure 3. Concentration-response curve for the effect of PAP-1 on glucose uptake in the absence of insulin in adipocytes of female wild-type C57Bl6 mice.
n = 8 mice per group for all columns. Data were analyzed by one-way ANOVA followed by Fisher’s least significant difference test against the control value. P < 0.05; ∗∗∗P < 0.001 for effect of PAP-1 compared to baseline.
Figure 4
Figure 4. Effect of PAP-1 (3 µM) on TNFα secretion by adipocytes from female wild-type and ob/ob mice.
n = 6 mice per group for all columns. Data were log10-transformed so that variances were not significantly different between groups prior to analysis by two-way ANOVA (sources of variation: genotype and PAP-1 concentration), followed by Fisher’s least significant difference test. P < 0.05; ∗∗P < 0.01 for effect of PAP-1 compared to control (Con).
Figure 5
Figure 5. Kv1.3 and Kv1.5 mRNA levels in liver, gastrocnemius, soleus and white adipose tissue of female (A) wild-type and (B) ob/ob mice.
n = 3 mice for all columns. Expression of each potassium channel was calculated relative to expression of GAPDH in each sample. Data were log10-transformed prior to statistical analysis because the data obtained for Fig. 6 suggested that widely distributed data did not follow a normal distribution without this transformation. Analysis was by two-way ANOVA (sources of variation: genotype and tissue) for each gene, followed by Fisher’s least significant difference test for each pair of wild-type and ob/ob values. Unpaired t-tests conducted on untransformed data gave the same significant differences. P < 0.05; ∗∗P < 0.01; ∗∗∗P < 0.001 compared to wild-type mice.
Figure 6
Figure 6. Relative expression of Kv1.2, Kv1.3 and Kv1.5 expression in (A) adipose tissue, (B) adipocytes and (C) soleus muscle of wild-type mice.
Relative expression is given assuming that PCR reaction efficiencies were 1.0 for each gene. The expression of each Kv channel was expressed relative to GAPDH in the same sample and then relative to Kv1.3. ΔCT GAPDH–ΔCT Kv1.3 was 4.43 ± 0.31 for adipose tissue, 6.32 ± 0.34 for adipocytes and 9.8 ± 0.70 for soleus muscle (n = 6). Data were log10-transformed prior to statistical analysis because variances were clearly higher for Kv1.5, which was far more highly expressed than Kv1.2 or Kv1.3. Thus the Bartlett and F-tests showed significant differences in variance for the adipose tissue and adipocyte data respectively when these data were not transformed. Analysis was by two-way ANOVA (sources of variation: gene and tissue), followed by Fisher’s least significant difference test for adipose tissue and soleus muscle. Kv1.2 was undetectable in adipocytes, so Kv1.3 and Kv1.5 were compared by unpaired t-test. n = 4 mice for soleus muscle and 6 mice for adipose tissue and adipocytes. ∗∗P < 0.01; ∗∗∗P < 0.001.

References

    1. Beeton C, Wulff H, Standifer NE, Azam P, Mullen KM, Pennington MW, Kolski-Andreaco A, Wei E, Grino A, Counts DR, Wang PH, LeeHealey CJ, Andrews BS, Sankaranarayanan A, Homerick D, Roeck WW, Tehranzadeh J, Stanhope KL, Zimin P, Havel PJ, Griffey S, Knaus HG, Nepom GT, Gutman GA, Calabresi PA, Chandy KG. Kv1.3 channels are a therapeutic target for T cell-mediated autoimmune diseases. Proceedings of the National Academy of Sciences of the United States of America. 2006;103:17414–17419. doi: 10.1073/pnas.0605136103. - DOI - PMC - PubMed
    1. Calle MC, Fernandez ML. Inflammation and type 2 diabetes. Diabetes & Metabolism. 2012;38:183–191. doi: 10.1016/j.diabet.2011.11.006. - DOI - PubMed
    1. Choi BH, Hahn SJ. Kv1.3: a potential pharmacological target for diabetes. ACTA Pharmacologica Sinica. 2010;31:1031–1035. doi: 10.1038/aps.2010.133. - DOI - PMC - PubMed
    1. Ford J, Milnes J, Wettwer E, Christ T, Rogers M, Sutton K, Madge D, Virag L, Jost N, Horvath Z, Matschke K, Varro A, Ravens U. Human electrophysiological and pharmacological properties of XEN-D0101: a novel atrial-selective Kv1.5/IKur inhibitor. Journal of Cardiovascular Pharmacology. 2013;61:408–415. doi: 10.1097/FJC.0b013e31828780eb. - DOI - PubMed
    1. Galvez BG, San Martin N, Rodriguez C. TNF-alpha is required for the attraction of mesenchymal precursors to white adipose tissue in ob/ob mice. PLoS ONE. 2009;4:e614. doi: 10.1371/journal.pone.0004444. - DOI - PMC - PubMed

LinkOut - more resources