. 2014 Oct 16:3:e04123.
doi: 10.7554/eLife.04123.

Phase transitions of multivalent proteins can promote clustering of membrane receptors

Affiliations

Phase transitions of multivalent proteins can promote clustering of membrane receptors

Sudeep Banjade et al. Elife. .

Abstract

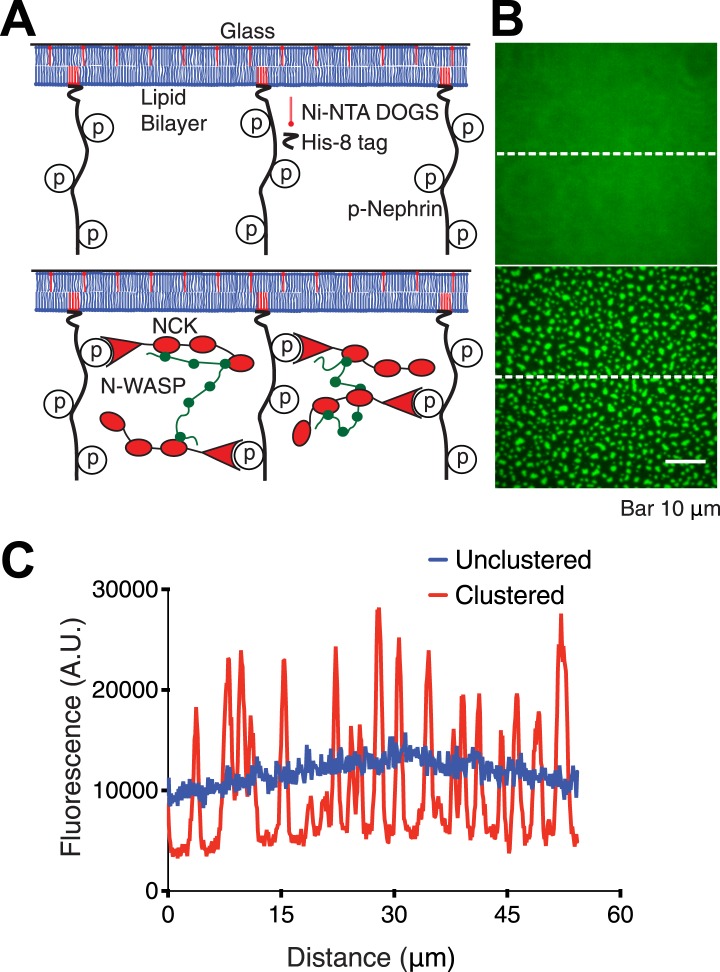
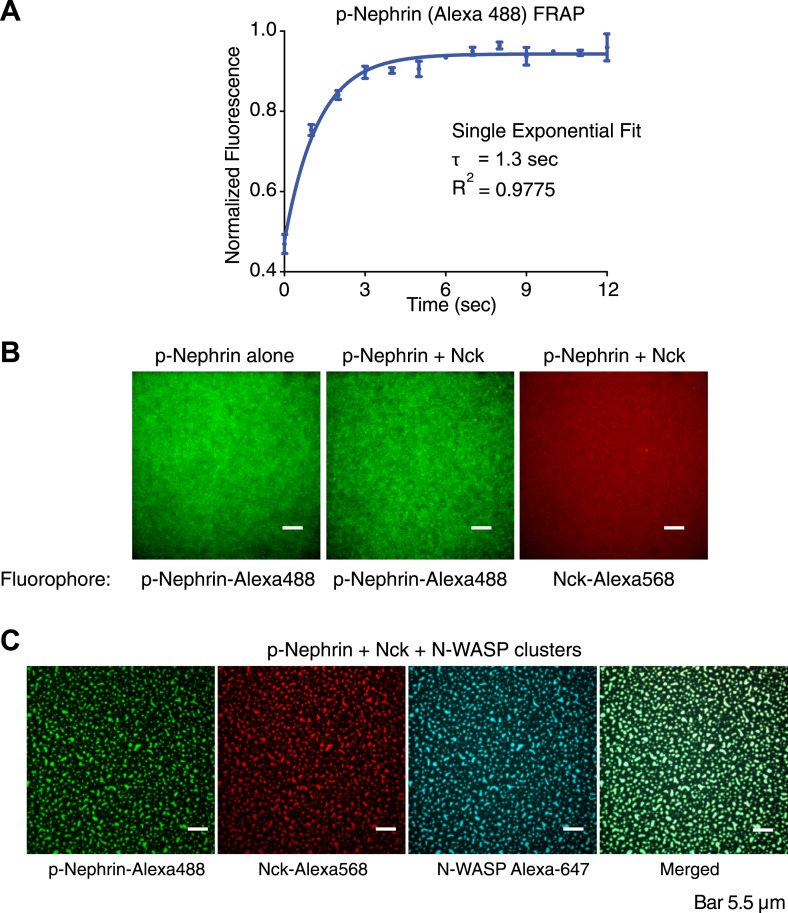
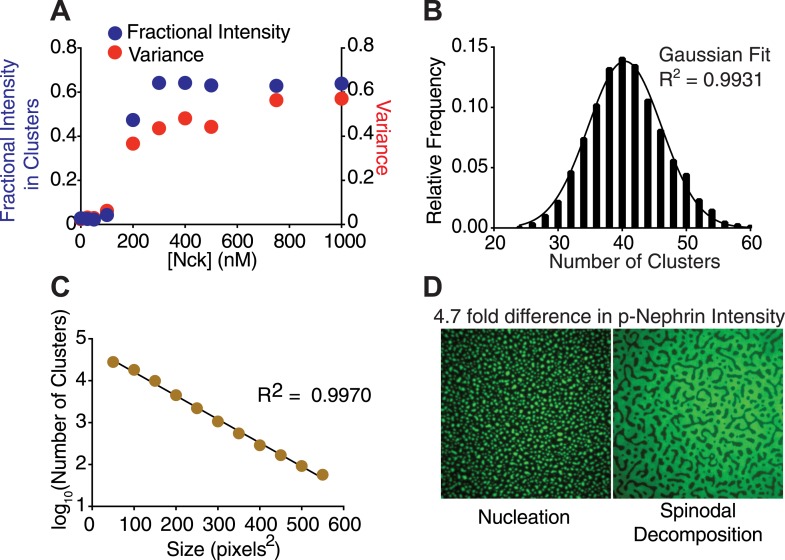
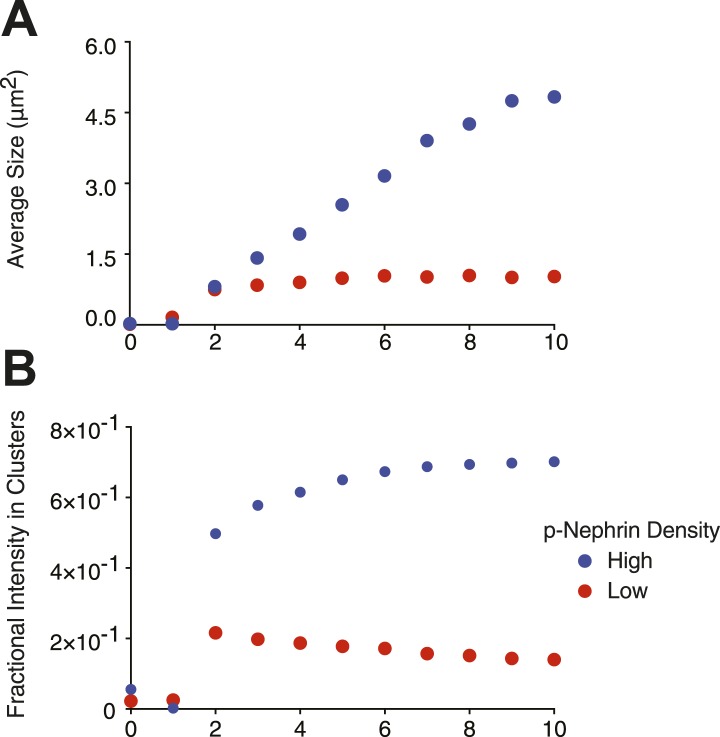
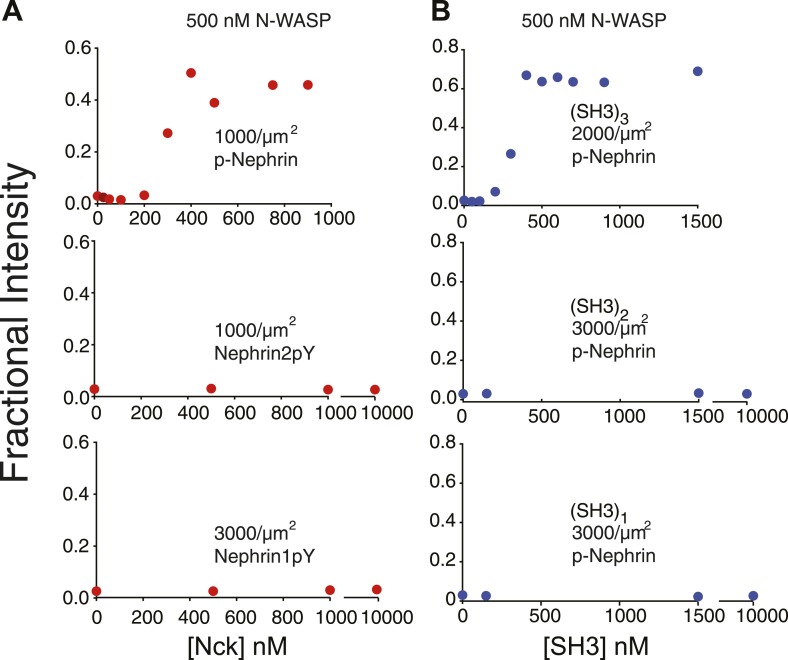
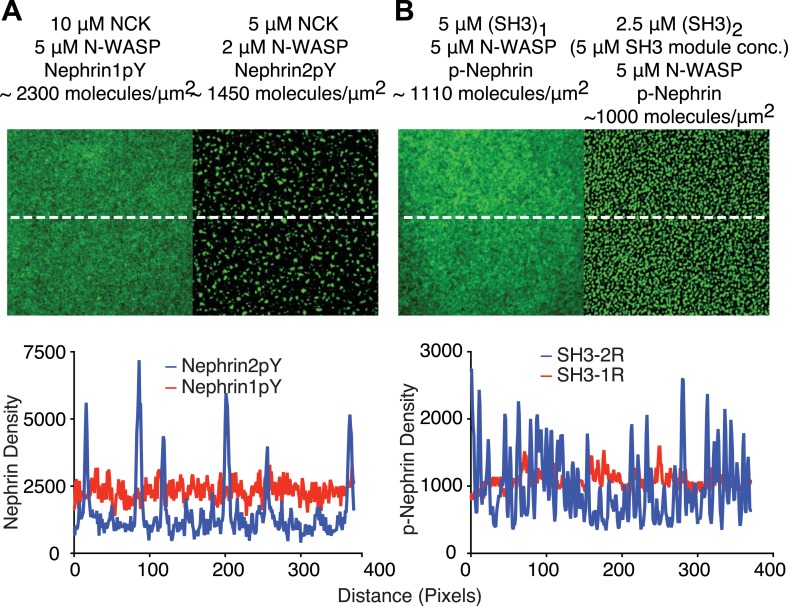
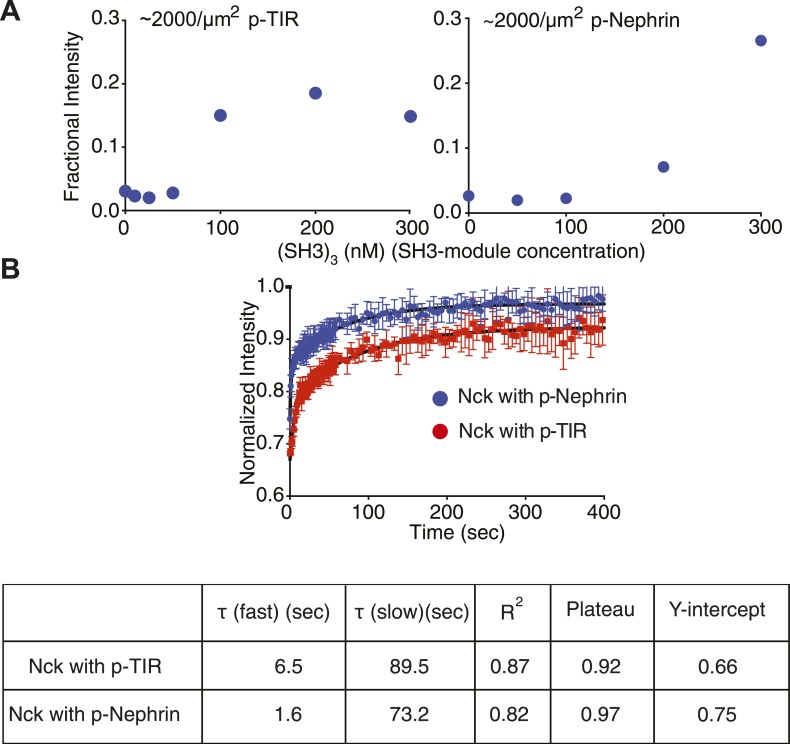
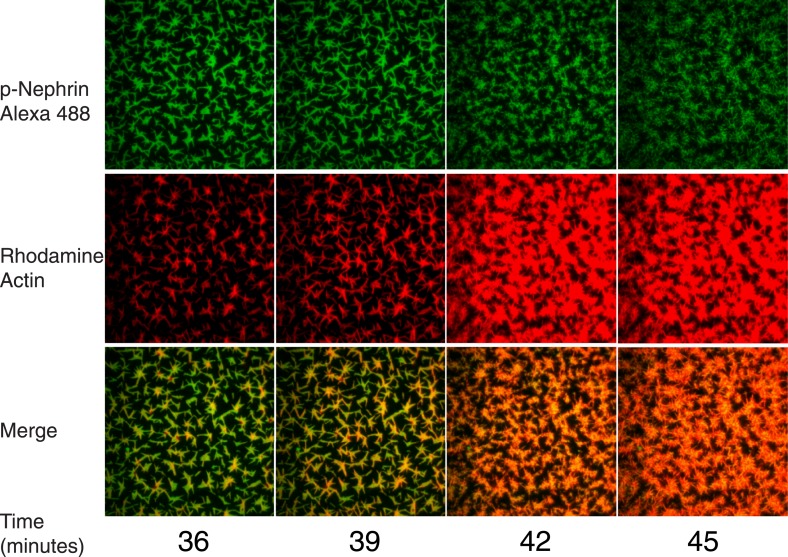
Clustering of proteins into micrometer-sized structures at membranes is observed in many signaling pathways. Most models of clustering are specific to particular systems, and relationships between physical properties of the clusters and their molecular components are not well understood. We report biochemical reconstitution on supported lipid bilayers of protein clusters containing the adhesion receptor Nephrin and its cytoplasmic partners, Nck and N-WASP. With Nephrin attached to the bilayer, multivalent interactions enable these proteins to polymerize on the membrane surface and undergo two-dimensional phase separation, producing micrometer-sized clusters. Dynamics and thermodynamics of the clusters are modulated by the valencies and affinities of the interacting species. In the presence of the Arp2/3 complex, the clusters assemble actin filaments, suggesting that clustering of regulatory factors could promote local actin assembly at membranes. Interactions between multivalent proteins could be a general mechanism for cytoplasmic adaptor proteins to organize membrane receptors into micrometer-scale signaling zones.

Keywords: actin regulation; biophysics; cell biology; human; membrane clustering; multivalency; phase separation; polymerization; signal transduction; structural biology.


Conflict of interest statement

The authors declare that no competing interests exist.

Figures

Figure 1.
Figure 1.. Reconstitution of p-Nephrin clusters on supported lipid bilayers.
(A) Cartoon illustrating the interaction of triply-phosphorylated His8-tagged Nephrin (p-Nephrin) with its partners Nck and N-WASP. Top panel illustrates p-Nephrin attached to bilayers. Bottom panel illustrates the model for clustered p-Nephrin, upon Nck and N-WASP binding. (B) Top: TIRF image of Alexa488-labeled p-Nephrin attached to a supported DOPC lipid bilayer doped with 1% nickel-chelating lipid (Ni2+-NTA DOGS), (corresponding to panel A, top). Bottom: TIRF image of analogous membrane-attached Alexa488-labeled p-Nephrin after addition of 1 µM Nck and 1 µM N-WASP (corresponding to panel A, bottom). (C) Line-scans of the images in panel B, at the positions depicted by the white dotted lines. DOI: http://dx.doi.org/10.7554/eLife.04123.003
Figure 1—figure supplement 1.
Figure 1—figure supplement 1.. p-Nephrin, Nck and N-WASP colocalize to clusters formed on fluid supported lipid bilayers.
(A) Fluorescence recovery after photobleaching (FRAP) on a supported bilayer with p-Nephrin shows full recovery with exponential recovery time constant τ = 1.3 s. Line shows fit to a single-exponential. (B) Clusters do not form with only p-Nephrin on the membrane (left-panel, p-Nephrin Alexa488) or with p-Nephrin (Alexa488) + 1 μM Nck (Alexa568) (middle and right panels). The legend below each panel indicates the fluorophore imaged. (C) Three color imaging shows that p-Nephrin Alexa488, Nck Alexa568, and N-WASP Alexa647 co-localize at the clusters. DOI: http://dx.doi.org/10.7554/eLife.04123.004
Figure 2.
Figure 2.. Nephrin clusters are created via a two-dimensional phase-transition.
(A) Fractional intensity in clusters (blue symbols, left ordinate) and signal variance (red symbols, right ordinate) of p-Nephrin fluorescence on a DOPC bilayer as a function of Nck concentration for 500 nM N-WASP and total p-Nephrin density of ∼2700 molecules/µm2. (B) Relative frequency with which a given number of clusters are found within 93 randomly selected 56 × 56 µm regions of a bilayer formed using ∼2500 molecules/µm2 Alexa488-labeled p-Nephrin, 1 µM Nck, and 1 µM N-WASP. (C) Size distribution of clusters formed using ∼2500 molecules/µm2 Alexa488-labeled p-Nephrin, 1 µM Nck, and 1 µM N-WASP. (D) Puncta formed using 1 µM Nck, 1 µM N-WASP, and low (left) or 4.7-fold higher (right) density of p-Nephrin. Images were autocontrasted for clarity. DOI: http://dx.doi.org/10.7554/eLife.04123.006
Figure 2—figure supplement 1.
Figure 2—figure supplement 1.. Quantitative analysis of the measurement and control of His8-p-Nephrin density on supported lipid bilayers.
(A) Fluorescence intensity as a function of fluorescent lipid (OG-DHPE) concentration for a solution of small unilamellar vesicles. Fluorescence of liposomes (in solution) containing OG-DHPE were measured at the indicated concentrations of the OG-DHPE concentrations in the x-axis. (B) Fluorescence intensity as a function of p-Nephrin Alexa488 concentrations. Blue points represent data for protein alone, red points represent data for p-Nephrin in the presence of 9.5 μM of Ni2+-NTA DOGS. Concentrations of the protein for this standard plot were kept similar to those of the concentration of OG-DHPE in panel A. (C) Fluorescence intensity as a function of OG-DHPE density on supported lipid bilayers. Upper and lower x-axis labels list density as percent total lipid and molecules/µm2, respectively. Lines in (AC) represent a linear fits. (D) Time course of His8-tagged p-Nephrin Alexa488 dissociation from supported lipid bilayers, monitored by TIRFM, following washes that left 2.8 nM protein in solution above the bilayer. (E) Fluorescence intensity of bilayers containing different percentages of p-Nephrin Alexa488 (with total p-Nephrin density ∼2000 molecules/µm2). The data suggest linearity up to ∼60% labeling. DOI: http://dx.doi.org/10.7554/eLife.04123.007
Figure 2—figure supplement 2.
Figure 2—figure supplement 2.. Quantification of average p-Nephrin density on the bilayer for every titration point shown in Figure 2A.
Y-axis represents p-Nephrin density and x-axis represents the different Nck concentrations of the titration as in Figure 2A. Densities are averages of five different areas of each bilayer. Error bars representing standard deviations are smaller than the symbols. DOI: http://dx.doi.org/10.7554/eLife.04123.008
Figure 3.
Figure 3.. Clusters are dynamic.
(A) Time-lapse TIRF imaging of bilayers containing ∼3100 molecules/µm2 Alexa488-labeled p-Nephrin after addition of 1 µM Nck and 1 µM N-WASP. Images represent time intervals of 2 min and show coalescence of clusters into larger structures. (B) Fluorescence recovery after photobleaching of Nck and N-WASP in clustered regions (left panel, red and blue, respectively) and p-Nephrin in clustered and unclustered regions (right panel, green and black, respectively). FRAP experiments were performed in separate experiments using Alexa-488 labeled p-Nephrin, Nck, or N-WASP. Lines show bi-exponential fits of the data, except for unclustered p-Nephrin, which was fit using a single-exponential. Bars represent standard deviation from three FRAP experiments on a single bilayer. Bottom table lists the parameters obtained from the fitting. DOI: http://dx.doi.org/10.7554/eLife.04123.010
Figure 3—figure supplement 1.
Figure 3—figure supplement 1.. Cluster size-distribution analyses at different times suggest exponential behavior at lower densities.
(A) Log-linear plot of cluster number vs size at p-Nephrin density of ∼2500 μm2, 1 μM Nck, and 1 μM N-WASP. The distributions are plotted for times between 2 and 20 min. (B) Log–log plot of the same data. Lines in (A and B) represent the best linear fits of the data. The better fits in (A) than (B) indicate that the data are better described by exponential than power law functions. In other experiments (not shown), the sizes remain exponentially distributed to times as long as 60 min. DOI: http://dx.doi.org/10.7554/eLife.04123.011
Figure 3—figure supplement 2.
Figure 3—figure supplement 2.. Cluster size-distribution analyses suggest power law behavior at higher densities.
(A) Log-linear plot of the size distribution of clusters at a Nephrin density of ∼4000 μm2, 1 μM Nck, and 1 μM N-WASP, recorded 60 min after clustering was initiated. (B) Log–log plot of the size distribution of clusters at a Nephrin density of ∼4000 μm2, 1 μM Nck, and 1 μM N-WASP. Lines in (A and B) represent the best linear fits of the data. The better fits in (B) than (A) indicate that the data are better described by power law than exponential functions (contrast with Figure 3—figure supplement 1). DOI: http://dx.doi.org/10.7554/eLife.04123.012
Figure 3—figure supplement 3.
Figure 3—figure supplement 3.. Average cluster size is dependent on molecular density.
Samples contained either low (∼2000 molecules/µm2, red dots) or high (∼3500 molecules/µm2, blue dots) density of p-Nephrin. Clustering was initiated by addition of 1 μM Nck and 1 μM N-WASP. Images were taken every minute. (A) Average cluster size, (B) the fractional intensity in clusters. DOI: http://dx.doi.org/10.7554/eLife.04123.013
Figure 4.
Figure 4.. Clustering is dependent upon the valency of the interacting motifs.
Plots show fractional intensity of fluorescent Nephrin proteins in clusters as a function of Nck protein concentrations for 500 nM N-WASP. (A) Top, middle, and bottom panels show data for p-Nephrin 3pY, 2pY, and 1pY, respectively. For these concentrations of N-WASP and Nck, only Nephrin 3pY shows clustering. At 2 µM N-WASP, Nephrin 2pY also clusters when Nck is added (Figure 4—figure supplement 1). (B) Top, middle, and bottom panels show data for p-Nephrin plus engineered Nck proteins containing 3, 2, or 1 repeat of the second SH3 domain of Nck. For these concentrations/densities of N-WASP/p-Nephrin, only the (SH3)3 protein can induce clustering. At 5 µM N-WASP, (SH3)3 also induces clustering (Figure 4—figure supplement 1). Note that the x-axis is Nck concentration in panel A but total SH3 domain concentration in panel B. DOI: http://dx.doi.org/10.7554/eLife.04123.014
Figure 4—figure supplement 1.
Figure 4—figure supplement 1.. Di-valent molecules are stronger clustering agents than mono-valent molecules.
(A) In the presence of 5 µM Nck and 2 μM N-WASP, p-Nephrin 2pY forms clusters (right panel). Even in the presence of 10 µM Nck and 5 μM N-WASP, p-Nephrin 1pY does not form clusters (left panel). Bottom: line-scan of images in the top panels, with locations indicated by dotted lines. (B) At 5 μM N-WASP, 2.5 μM (SH3)2 (5 μM SH3 module concentration) produces p-Nephrin clusters (right panel), whereas (SH3)1 does not (left panel). Bottom: line-scan of images in the top panels, with locations indicated by dotted lines. DOI: http://dx.doi.org/10.7554/eLife.04123.015
Figure 5.
Figure 5.. Molecular affinities affect macroscopic clustering.
(A) Fractional intensity of fluorescent pTyr proteins in clusters as a function of SH3 (module) concentrations for 500 nM N-WASP. Left and right panels show data for a p-TIR and p-Nephrin, whose pTyr motifs bind the SH2 domain of Nck with KD values of 40 nM and 370 nM, respectively. (B) Fluorescence recovery after photobleaching (FRAP) for Alexa488-labeled Nck in p-Nephrin clusters (blue) and p-TIR clusters (red). Nck recovers more slowly (larger τ), can be bleached more strongly (Y-intercept) and recovers to a lower value (plateau) with p-TIR than with p-Nephrin, all indicating slower dynamics in clusters with the higher affinity SH2 binding partner. The bars represent standard deviation from three FRAP experiments on a single bilayer. DOI: http://dx.doi.org/10.7554/eLife.04123.016
Figure 5—figure supplement 1.
Figure 5—figure supplement 1.. Measurement of the affinity of Nck for p-TIR and p-Nephrin.
Isothermal titration calorimetry analysis of Nck binding to p-Nephrin and p-TIR. Nck (150 µM) in the syringe was titrated into 5 μM of either (A) p-Nephrin (3pY) or (B) p-TIR (3pY). Both datasets could be fit well to a three-site binding model with a single affinity for Nck. In the p-Nephrin and p-TIR titrations, ∼6% and ∼11% of the proteins, respectively, were found to be incompetent to bind Nck. DOI: http://dx.doi.org/10.7554/eLife.04123.017
Figure 6.
Figure 6.. Mono-valent pTyr peptide can eliminate clusters.
(A) Time course following addition of 10 µM of a monovalent pTyr peptide derived from TIR (with KD of 40 nM for the Nck SH2 domain) to clusters formed from p-Nephrin /(SH3)3/N-WASP. (B) Time course of the fractional p-Nephrin intensity in clusters after addition of the TIR peptide. (C) Equilibrium fractional intensity of the p-Nephrin clusters as a function of p-TIR peptide concentration, performed in the presence of 1 µM (SH3)3 and 500 nM N-WASP. DOI: http://dx.doi.org/10.7554/eLife.04123.019
Figure 7.
Figure 7.. Actin assembles specifically on p-Nephrin/Nck/N-WASP clusters.
(A) Alexa488-labeled p-Nephrin (2200 molecules/µm2) was clustered by addition of 2 μM N-WASP and 1 μM Nck. Images show time course of p-Nephrin (top row), actin (middle row) and merge (bottom row) after addition of 10 nM Arp2/3 complex and 1 µM actin (10% rhodamine labeled). (B) Half-times of actin assembly as a function of surface area (left-panel) and p-Nephrin intensity (right-panel) in individual clusters. Half-times were calculated using the data for the first 27 min of the time-lapse. (C) Fluorescence of rhodamine-actin on individual clusters as a function of time for 20 representative clusters. Individual curves represent average intensity across an individual cluster. DOI: http://dx.doi.org/10.7554/eLife.04123.020
Figure 7—figure supplement 1.
Figure 7—figure supplement 1.. Actin localizes to and assembles on the clusters in an Arp2/3 dependent manner.
(A) Images of clusters formed by p-Nephrin (2173 molecules/μm2 on the supported lipid bilayer) plus soluble 1 μM Nck, 2 μM N-WASP, 10 nM Arp2/3 complex, and 1 μM actin (10% rhodamine labeled) at 0 and 3 min. Top panels show p-Nephrin (Alexa 488 labeled), bottom panels show fluorescence for rhodamine-actin. Note that the actin images are contrast-enhanced relative to those in Figure 7A to illustrate weak, but relatively uniform actin recruitment to the p-Nephrin clusters at 3 min. (B) Actin assembly reactions as in panel A, except that of the lower row lacks the Arp2/3 complex, imaged at 105 min after actin addition. Left, middle, and right panels show p-Nephrin Alexa488, rhodamine-actin, and phalloidin 647 staining, respectively. In the bottom row phalloidin stains only the morphologically elongated structures, suggesting that the actin filaments are formed only in the re-shaped structures on the membrane. DOI: http://dx.doi.org/10.7554/eLife.04123.021
Figure 7—figure supplement 2.
Figure 7—figure supplement 2.. Actin assembly reorganizes p-Nephrin clusters.
Enlarged actin assembly images from Figure 7, including more time points between 36 and 45 min. Top, middle, and bottom rows show p-Nephrin Alexa488, rhodamine-actin and merge, respectively. DOI: http://dx.doi.org/10.7554/eLife.04123.022

References

    1. Abmayr SM, Pavlath GK. 2012. Myoblast fusion: lessons from flies and mice. Development 139:641–656. doi: 10.1242/dev.068353. - DOI - PMC - PubMed
    1. Antoku S, Saksela K, Rivera GM, Mayer BJ. 2008. A crucial role in cell spreading for the interaction of Abl PxxP motifs with Crk and Nck adaptors. Journal of Cell Science 121:3071–3082. doi: 10.1242/jcs.031575. - DOI - PMC - PubMed
    1. Balagopalan L, Barr VA, Kortum RL, Park AK, Samelson LE. 2013. Cutting edge: cell surface linker for activation of T cells is recruited to microclusters and is active in signaling. Journal of Immunology 190:3849–3853. doi: 10.4049/jimmunol.1202760. - DOI - PMC - PubMed
    1. Bergman A, Condeelis JS, Gligorijevic B. 2014. Invadopodia in context. Cell Adhesion & Migration 8:273–279. doi: 10.4161/cam.28349. - DOI - PMC - PubMed
    1. Blasutig IM, New LA, Thanabalasuriar A, Dayarathna TK, Goudreault M, Quaggin SE, Li SS, Gruenheid S, Jones N, Pawson T. 2008. Phosphorylated YDXV motifs and Nck SH2/SH3 adaptors act cooperatively to induce actin reorganization. Molecular and Cellular Biology 28:2035–2046. doi: 10.1128/MCB.01770-07. - DOI - PMC - PubMed

Publication types

MeSH terms