. 2014 Oct 16;5(10):e1471.
doi: 10.1038/cddis.2014.440.

Enrichment of c-Met+ tumorigenic stromal cells of giant cell tumor of bone and targeting by cabozantinib

Affiliations

Enrichment of c-Met+ tumorigenic stromal cells of giant cell tumor of bone and targeting by cabozantinib

L Liu et al. Cell Death Dis. .

Abstract

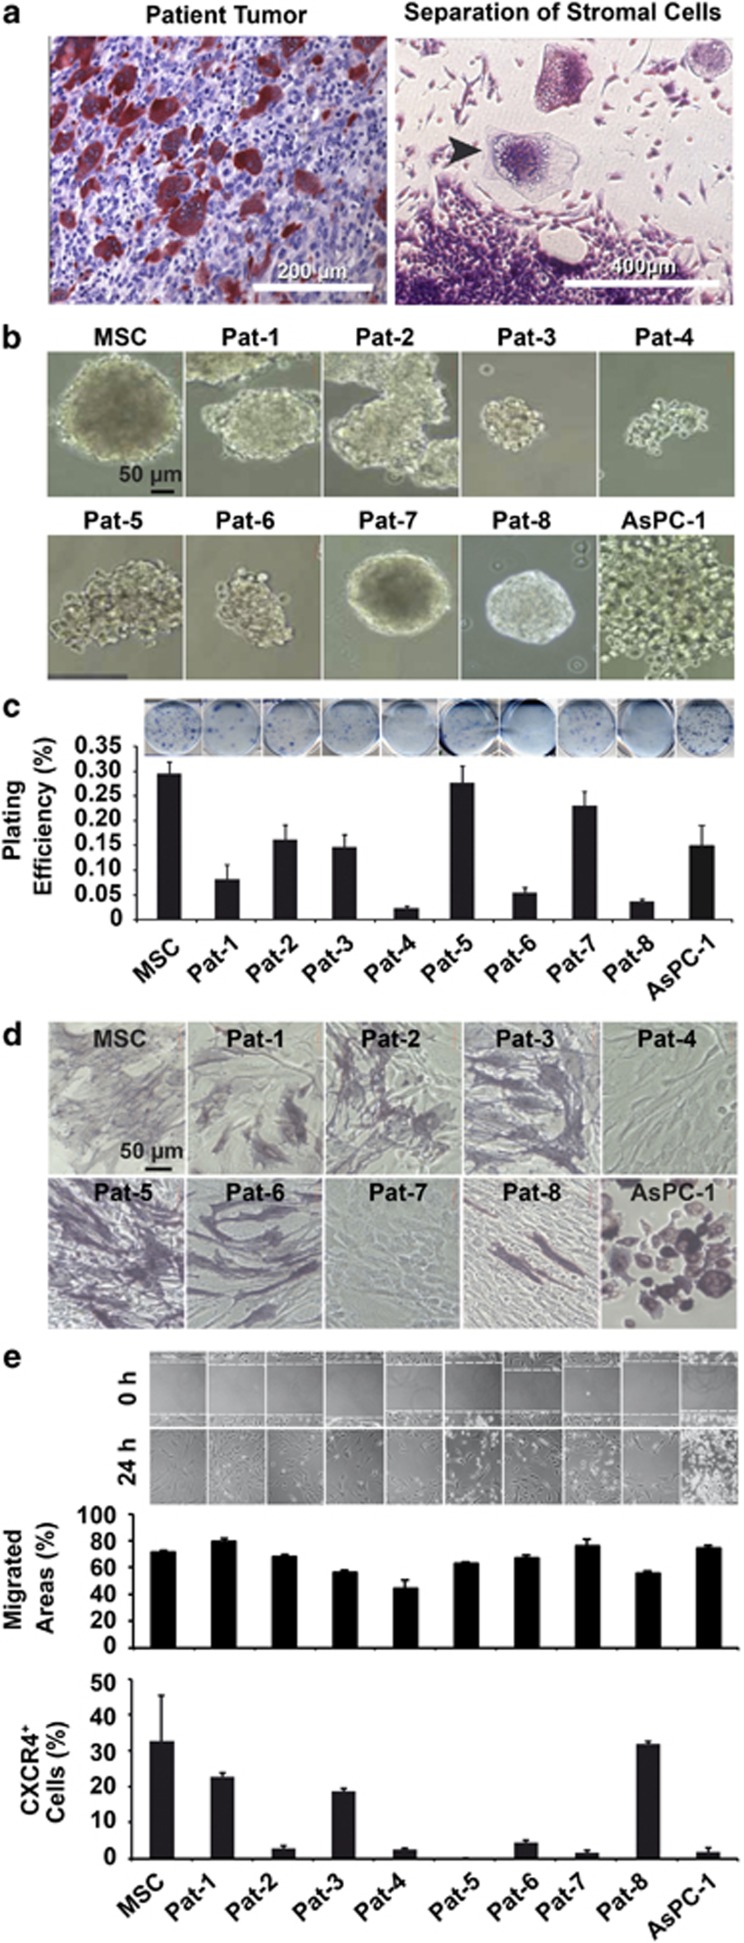
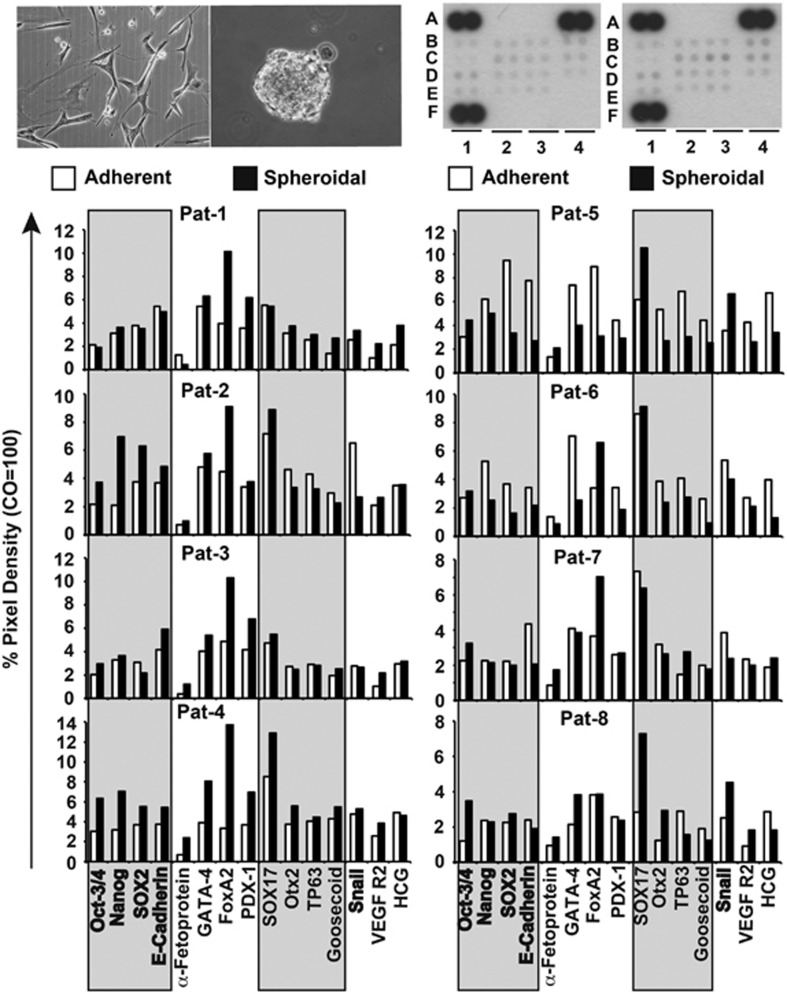
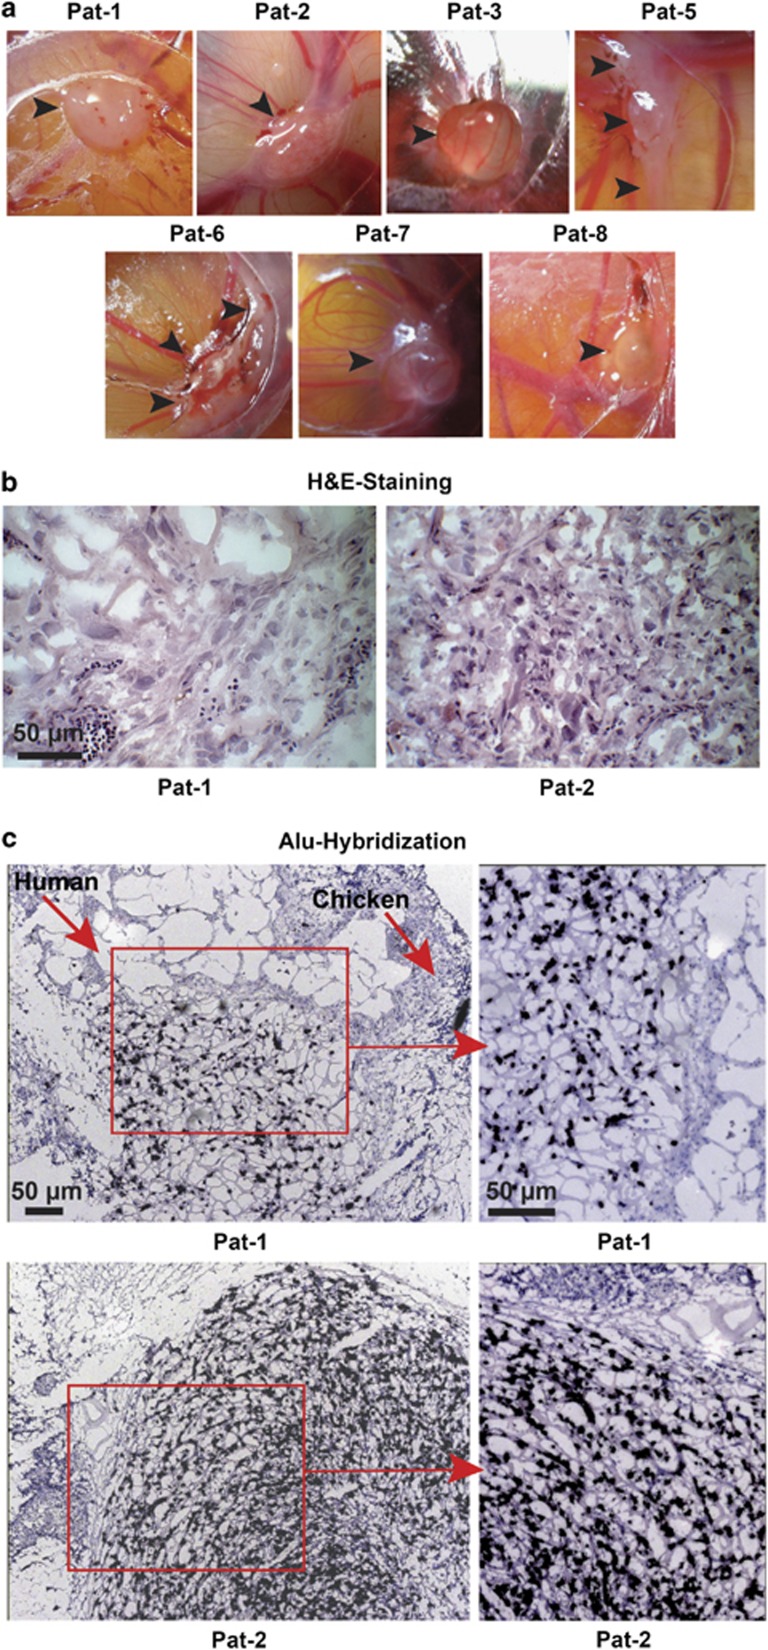
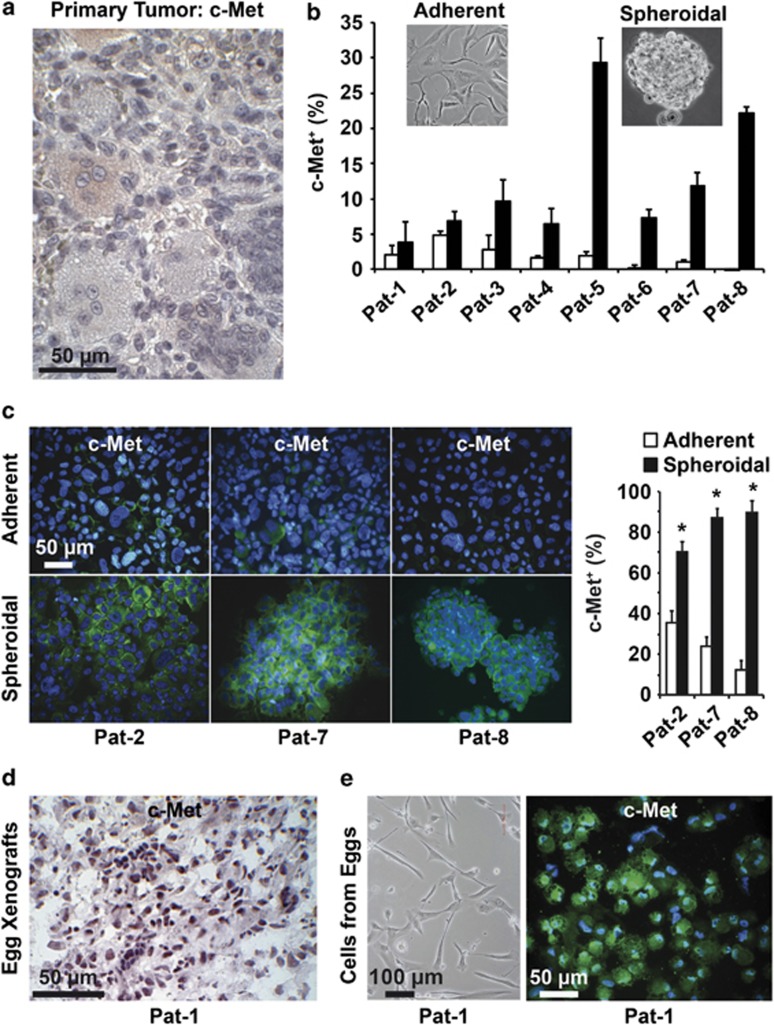
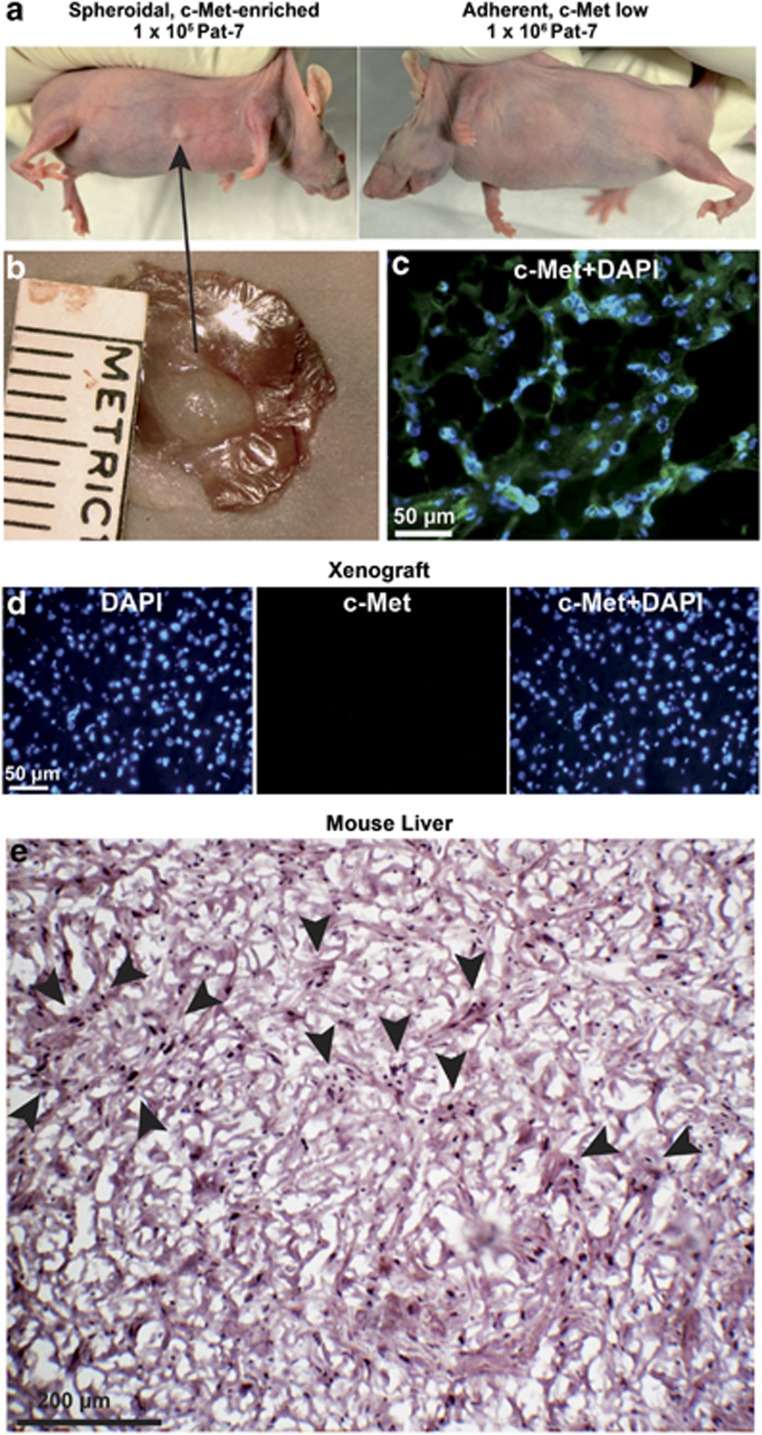
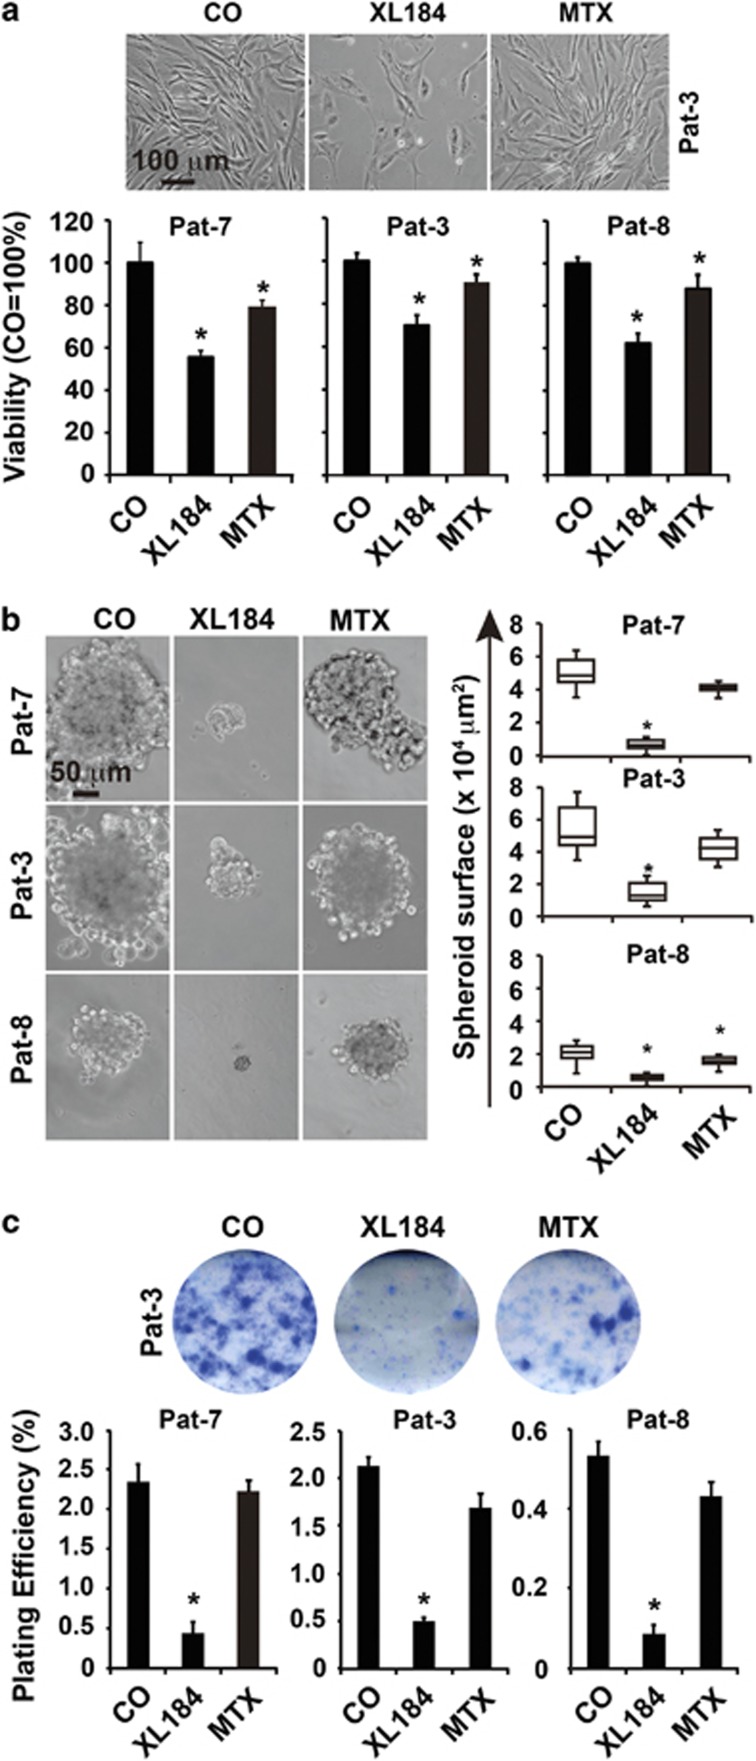
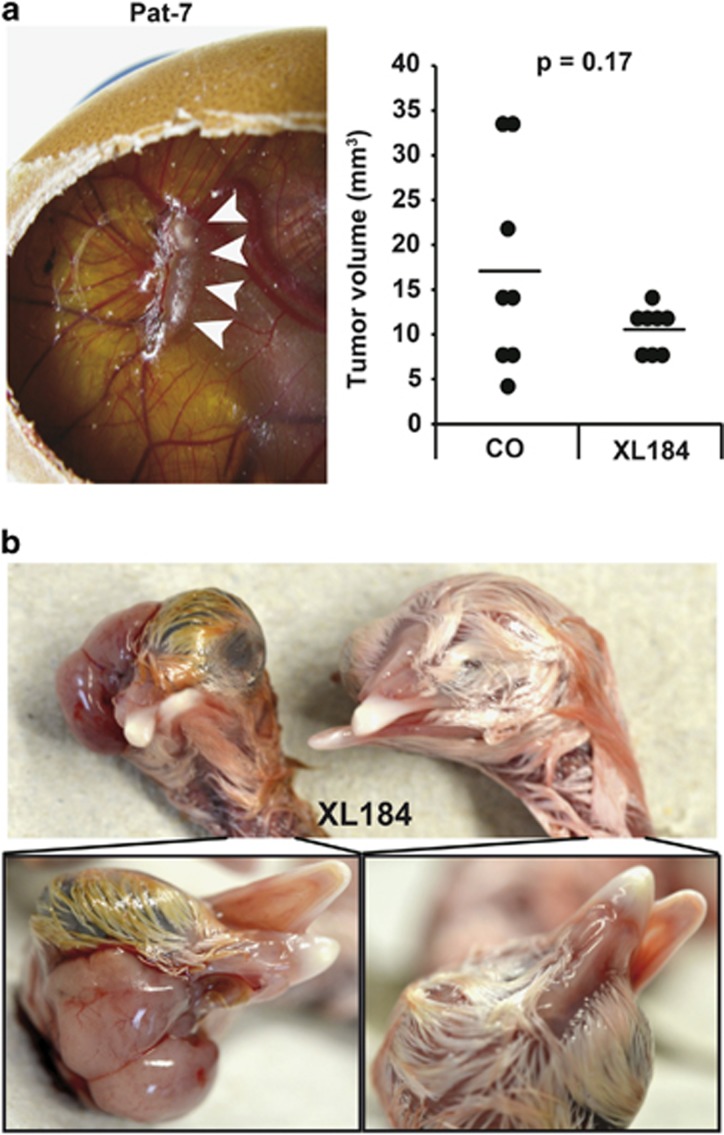
Giant cell tumor of bone (GCTB) is a very rare tumor entity, which is little examined owing to the lack of established cell lines and mouse models and the restriction of available primary cell lines. The stromal cells of GCTB have been made responsible for the aggressive growth and metastasis, emphasizing the presence of a cancer stem cell population. To identify and target such tumor-initiating cells, stromal cells were isolated from eight freshly resected GCTB tissues. Tumorigenic properties were examined by colony and spheroid formation, differentiation, migration, MTT (3-(4,5-dimethylthiazol-2-yl)-2,5-diphenyltetrazolium bromide) assay, immunohistochemistry, antibody protein array, Alu in situ hybridization, FACS analysis and xenotransplantation into fertilized chicken eggs and mice. A sub-population of the neoplastic stromal cells formed spheroids and colonies, differentiated to osteoblasts, migrated to wounded regions and expressed the metastasis marker CXC-chemokine receptor type 4, indicating self-renewal, invasion and differentiation potential. Compared with adherent-growing cells, markers for pluripotency, stemness and cancer progression, including the CSC surface marker c-Met, were enhanced in spheroidal cells. This c-Met-enriched sub-population formed xenograft tumors in fertilized chicken eggs and mice. Cabozantinib, an inhibitor of c-Met in phase II trials, eliminated CSC features with a higher therapeutic effect than standard chemotherapy. This study identifies a c-Met(+) tumorigenic sub-population within stromal GCTB cells and suggests the c-Met inhibitor cabozantinib as a new therapeutic option for targeted elimination of unresectable or recurrent GCTB.


Figures

Figure 1
Figure 1
GCTB stromal cells exhibit self-renewal activity. (a, left) Representative paraffin section out of 20 of a surgically resected GCTB specimen after TRAP staining at × 200 magnification. (Right) Osteoclast-like giant cells and stromal cells in culture after digestion of the tumor tissue. The arrow marks a giant cell surrounded by stromal cells at × 400 magnification. (b) GCTB stromal cells isolated from eight different patient tumors (Pat-1 to Pat-8) were seeded at clonal density in low-adhesion plates. The spheroids were grown until day 7 and photographed at × 100 magnification. MSCs or established pancreatic cancer cells (AsPC-1) served as controls. Data are representative of three independent experiments with similar results. (c) Colony-forming assay of cells plated in medium containing 10% FCS at clonal density of 200 cells/well. Cells were grown without change of medium for 2 weeks, followed by evaluation of fixed and Coomassie blue-stained colonies consisting of at least 50 cells. The plating efficiency as a percentage was calculated using the following formula: 100 × number of colonies/number of seeded cells. Data are presented as the mean of two experiments performed in sextuplicate (n=12)±S.D. (d) The differentiation potential was examined after incubation of cells in osteogenic differentiation medium for 10 days. Alkaline phosphatase expression was detected using BCIP/NBT. Cells were evaluated under × 200 magnification using a Nikon Eclipse TS100 microscope (Nikon Corporation, Sendai, Japan). Data are representative of three independent experiments with similar results. (e) Cells were cultured to 90% confluence before the cell layer was scratched with the tip of a pipette. Closure of the wounded region was evaluated 24 h after scratching by microscopy at × 100 magnification (pictures upper part). CXCR4 expression of GCTB-derived stromal cells was quantified by FACS analysis. Fluorescence intensities±S.D. of eight GCTB stromal patient-derived specimens and controls are shown (diagram lower part). Data are representative of three independent experiments with similar results. Data are representative of three independent experiments with similar results
Figure 2
Figure 2
GCTB stromal cells express stem cell markers. Proteins from adherent- or spheroidal-growing cells (upper left pictures) were prepared and incubated with the nitrocellulose membranes of an antibody array kit for the detection of human pluripotent stem cell markers. The binding of proteins to antibodies spotted on the membrane was detected using biotinylated secondary antibodies, streptavidin-HRP and chemiluminescence (upper right pictures). The pixel density was quantified using ImageJ software and normalized to the mean pixel intensity of reference spots located at the coordinates A1, A4 and F1 on the membrane. Spot E4 is the negative control, where PBS instead of the antibody was spotted onto the membrane. This experiment was performed with eight different primary cell lines once in duplicate for a general overview and the mean values are shown
Figure 3
Figure 3
GCTB stromal cells form tumor xenografts. (a) GCTB stromal cells (1 × 10⁶) derived from seven different patients were transplanted on the CAM of fertilized chicken eggs (n=8 per cell line) at embryonal development day 10 and photographed at day 17. The arrows mark the tumor xenografts. (b) H&E staining of representative frozen xenograft sections derived from Pat-1 and Pat-2 cells. (c) Alu hybridization of egg xenograft tissue derived from Pat-1 and Pat-2 cells. Dark blue-labeled cells of human origin and unlabeled chicken cells are marked by arrows. Pictures were taken at × 400 magnification, and the bar indicates 50 μm
Figure 4
Figure 4
c-Met is enriched in spheroidal cultures and xenografts. (a) Representative c-Met staining (light red) of a section of surgically resected GCTB tissue at × 200 magnification (n=5). (b) Flow cytometry analysis of c-Met expression in adherent- (white bars) and spheroidal- (black bars) growing GCTB stromal cells. (c) Cytospins were performed from adherent- and spheroidal-growing GCTB cells derived from Pat-2, Pat-7 and Pat-8, followed by immunofluorescence staining of c-Met (green) and DAPI counterstaining of cell nuclei (blue), followed by fluorescence microscopy at × 400 magnification. The bar indicates 50 μm. c-Met+ and c-Met cells of 10 vision fields were evaluated and are presented as the percentage of c-Met+ cells on the right. (d) Sections from egg xenografts (n=8) derived from stromal cells of Pat-1 were stained with c-Met antibody, and positive cells were detected by immunohistochemistry (dark violet). (e) Characterization of adherent-growing cells isolated from egg xenografts (n=8) from Pat-1. Representative photograph (n=3) of the cell morphology (left) and that of c-Met+ cells after immunofluorescence staining (right: green) with DAPI counterstaining (blue) at × 400 magnification. The scale bars indicate 100 and 50 μm, respectively. The data shown in (b and c) are representative of three experiments performed in duplicates (n=6)
Figure 5
Figure 5
c-Met+ GCTB stromal cells form tumors in mice. (a) A total of 1 × 10⁵ spheroidal-growing and 1 × 10⁶ adherent-growing Pat-2, Pat-7 and Pat-8 cells were subcutaneously transplanted into the right and left flanks of 15 mice per cell line. Four months later, one mouse developed a tumor at the right flank at the site where spheroidal cells from Pat-7 cells were injected. (b) The tumor xenograft was resected, and the size of 5 × 3 mm2 was determined by calipers. (c) c-Met (green) staining merged with DAPI counterstaining (blue) of a frozen mouse xenograft section derived from Pat-7 cells. The scale bar indicates 50 μm. (d) c-Met control staining (no signal) and DAPI staining (blue) of mouse liver sections (n=5). The scale bar indicates 50 μm. (e) H&E staining of a frozen mouse xenograft section derived from Pat-7 cells. The scale bar indicates 200 μm. Arrows indicate giant-like cells. Owing to a lack of tumor tissue, we could not further evaluate the features of the xenograft
Figure 6
Figure 6
Cabozantinib reduces viability and spheroid and colony formation of GCTB stromal cells. (a) Adherent-growing GCTB stromal cells derived from three different patients were left untreated (CO) or were treated with cabozantinib (10 μM, XL184) or methotrexate (100 μM, MTX). Seventy-two hours later, the viability was measured by the MTT assay, and the control was set to 100%. (b) Spheroidal cultures were established as described in Figure 1b. After spheroid formation, the cells were left untreated or were treated as described above. Seven days later, spheroids were photographed, and the number and volume of spheroids (spheroid surface) were determined. (c) Cells were seeded at a density of 1.5 × 10⁵ cells/ml in six-well plates. After 24 h, the cells were treated as described above. Seventy-two hours later, cells were trypsinized, and 2000 viable cells of each group were seeded per well of a six-well plate. Colony formation was evaluated as described in Figure 1c. Representative pictures of colonies derived from Pat-3 are shown. The data shown are the mean±S.D. (*P<0.05; **P<0.01). Data are representative of three independent experiments with similar results. Data from (a) and (b) are representative of three experiments performed in triplicate (n=9) and data from (c) were performed two times in sextuplicates (n=12)
Figure 7
Figure 7
Cabozantinib reduces the tumorigenicity of GCTB stromal cells in vivo. (a) GCTB stromal cells (Pat-3, 1 × 10⁶/group) were left untreated or were treated with cabozantinib (10 μM) in vitro. Twenty-four hours later, equal amounts of viable cells were transplanted in Matrigel on the CAM of fertilized chicken eggs at day 9 of embryonic development (n=8 per group). At day 17, the xenograft tumors were resected (representative picture of a xenograft tumor in a chicken egg), and the volumes were determined. The single data points and means of both groups are shown in the diagram on the left. (b) In ovo application of XL184 (10 μM) to a 1-cm2 Whatman paper on the CAM until saturation at day 11 of embryonic development led to craniofacial malformation in two of seven chicken embryos as photographed at day 18 of embryonal development. In contrast, chicken embryos from untreated eggs developed normally

References

    1. 1Wulling M, Engels C, Jesse N, Werner M, Delling G, Kaiser E. The nature of giant cell tumor of bone. J Cancer Res Clin Oncol 2001; 127: 467–474. - PubMed
    1. 2Zheng MH, Robbins P, Xu J, Huang L, Wood DJ, Papadimitriou JM. The histogenesis of giant cell tumour of bone: a model of interaction between neoplastic cells and osteoclasts. Histol Histopathol 2001; 16: 297–307. - PubMed
    1. 3Mendenhall WM, Zlotecki RA, Scarborough MT, Gibbs CP, Mendenhall NP. Giant cell tumor of bone. Am J Clin Oncol 2006; 29: 96–99. - PubMed
    1. 4Alberghini M, Kliskey K, Krenacs T, Picci P, Kindblom L, Forsyth R et al. Morphological and immunophenotypic features of primary and metastatic giant cell tumour of bone. Virchows Arch 2010; 456: 97–103. - PubMed
    1. 5Szendroi M. Giant-cell tumour of bone. J Bone Joint Surg Br 2004; 86: 5–12. - PubMed

Publication types

MeSH terms

LinkOut - more resources