

Cancer-driven dynamics of immune cells in a microfluidic environment
- PMID: 25322144
- PMCID: PMC5377582
- DOI: 10.1038/srep06639
Cancer-driven dynamics of immune cells in a microfluidic environment
Abstract
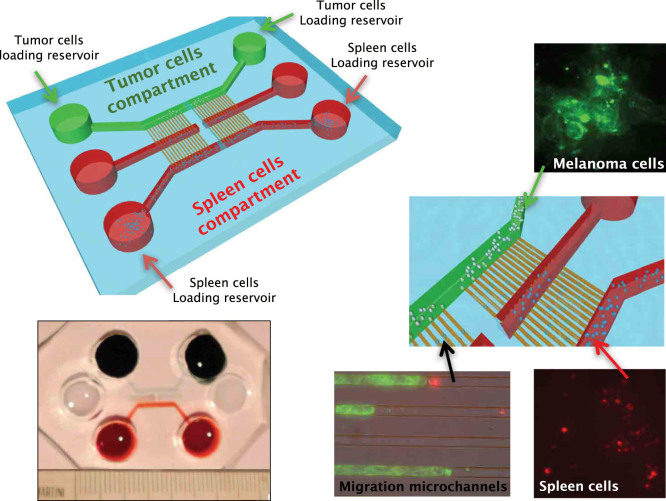
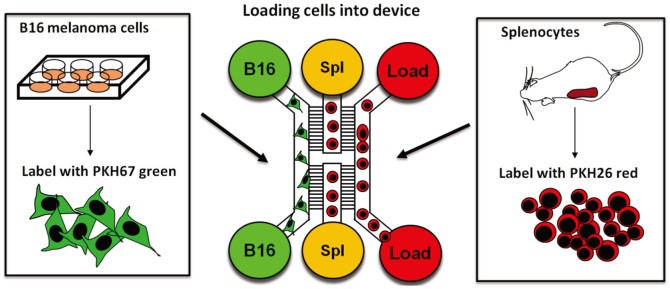
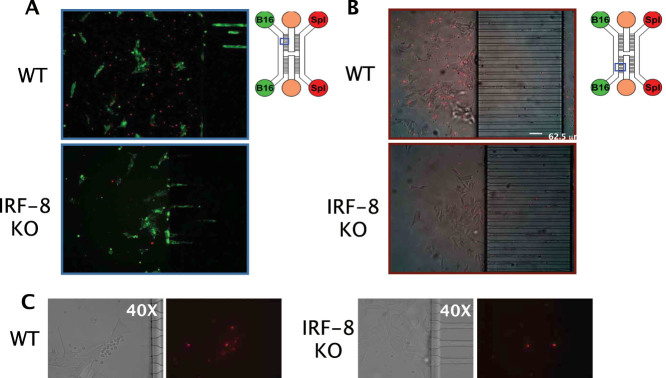
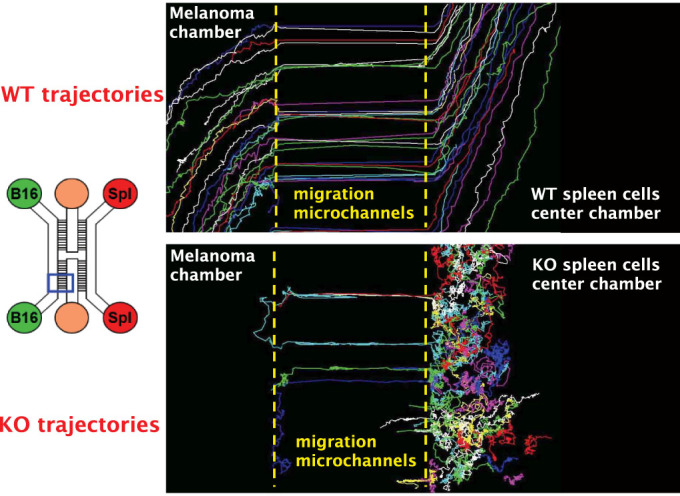
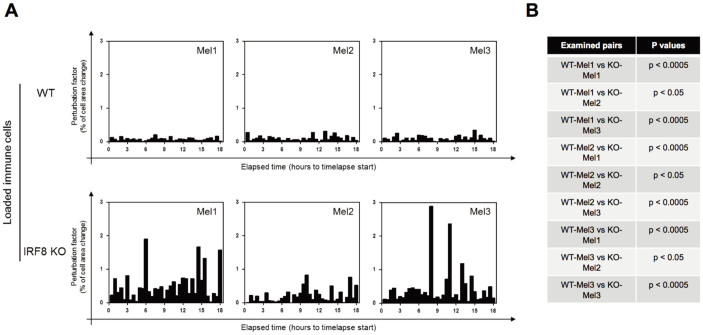
Scope of the present work is to infer the migratory ability of leukocytes by stochastic processes in order to distinguish the spontaneous organization of immune cells against an insult (namely cancer). For this purpose, spleen cells from immunodeficient mice, selectively lacking the transcription factor IRF-8 (IRF-8 knockout; IRF-8 KO), or from immunocompetent animals (wild-type; WT), were allowed to interact, alternatively, with murine B16.F10 melanoma cells in an ad hoc microfluidic environment developed on a LabOnChip technology. In this setting, only WT spleen cells were able to establish physical interactions with melanoma cells. Conversely, IRF-8 KO immune cells exhibited poor dynamical reactivity towards the neoplastic cells. In the present study, we collected data on the motility of these two types of spleen cells and built a complete set of observables that recapitulate the biological complexity of the system in these experiments. With remarkable accuracy, we concluded that the IRF-8 KO cells performed pure uncorrelated random walks, while WT splenocytes were able to make singular drifted random walks that collapsed on a straight ballistic motion for the system as a whole, hence giving rise to a highly coordinate response. These results may provide a useful system to quantitatively analyse the real time cell-cell interactions and to foresee the behavior of immune cells with tumor cells at the tissue level.
Conflict of interest statement
The authors declare no competing financial interests.
Figures
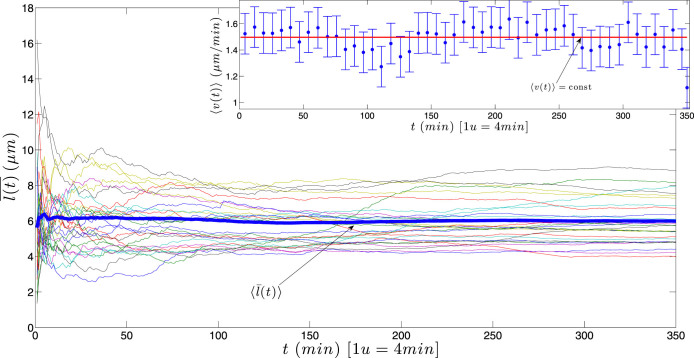
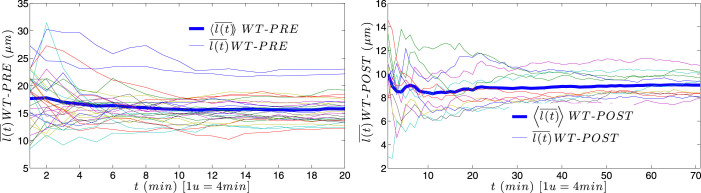
 for each KO cell (thin curve) and mean step length averaged over all splenocytes (thick curve) at each time, which is essentially constant.
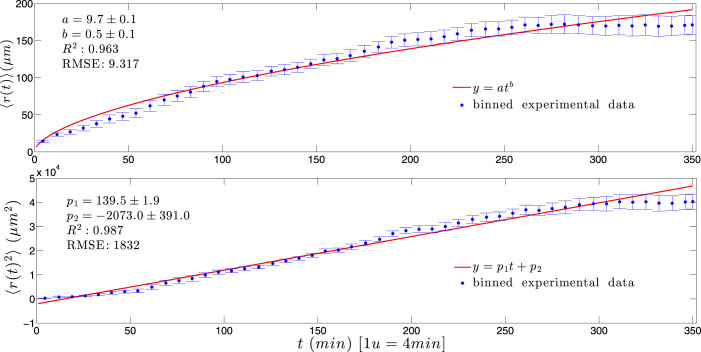
 ) with standard errors are compared with best fits (solid line) whose coefficients are properly shown.
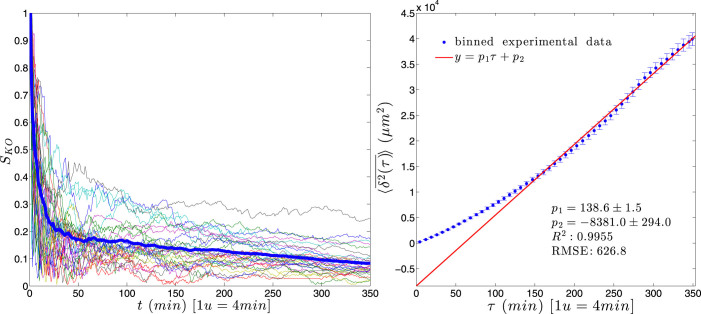
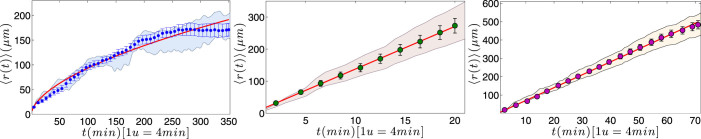
 (
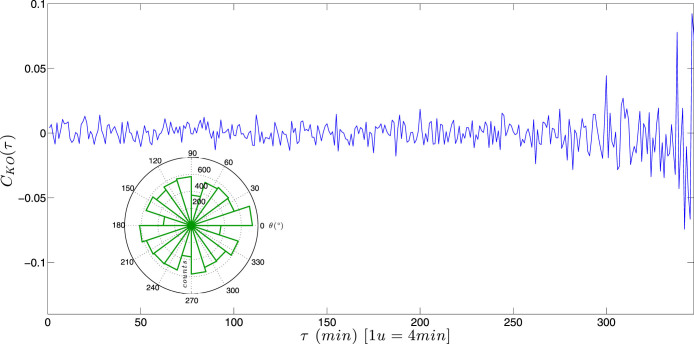
( ) with standard errors for KO splenocytes and best linear fit (solid line).
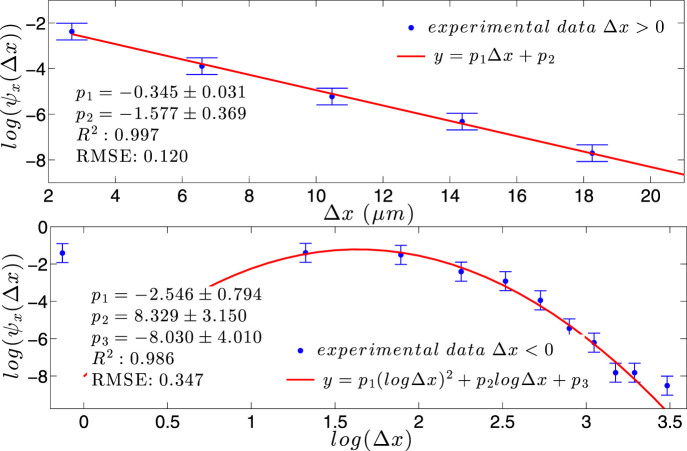
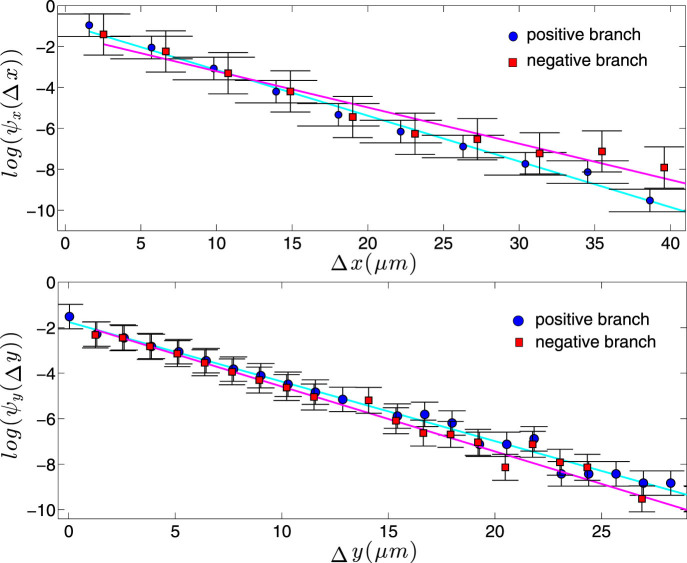
 ) with standard errors are compared with best fits (solid line). Note that the distribution is broadened along the negative x direction (and, analogously, along the positive y direction).
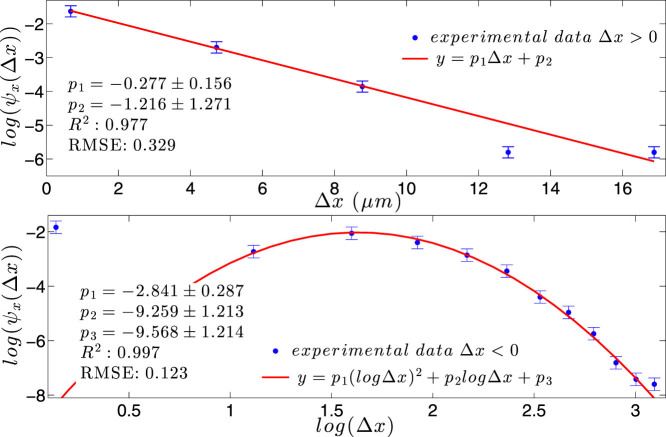
 ) with standard errors are compared with best fits (solid line). Note that the distribution is broadened along the negative x direction (and, analogously, along the positive y direction).
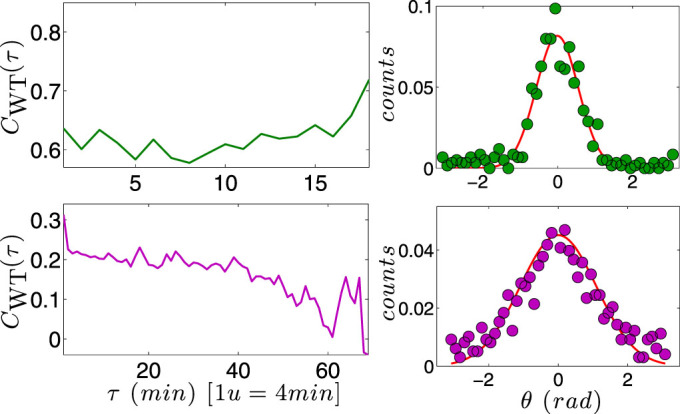
 appears constant in time.
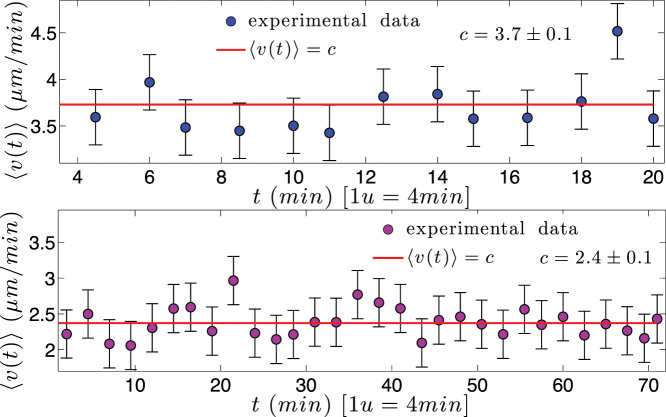
 ) with standard errors are best fitted by a constant line (solid curve). In both cases, no evident acceleration is observed, but, in the latter case, speed is lower.
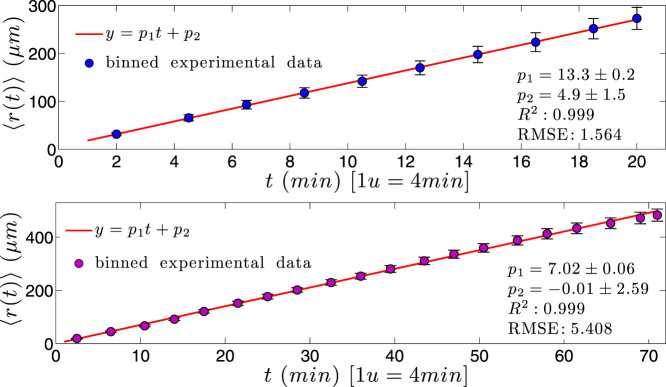
 ) with standard errors are compared with best fit (solid line), whose coefficients are also reported.
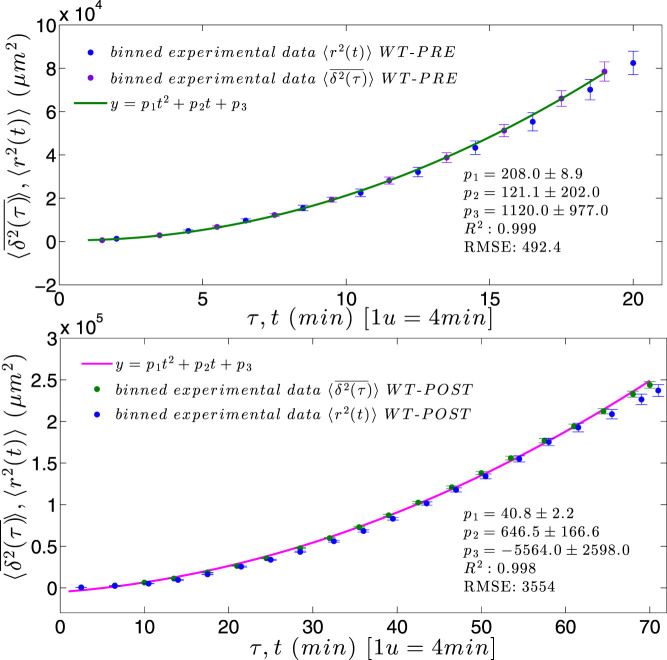
 and 〈r2(t)〉 are nicely overlapped, both growing with the square of time.
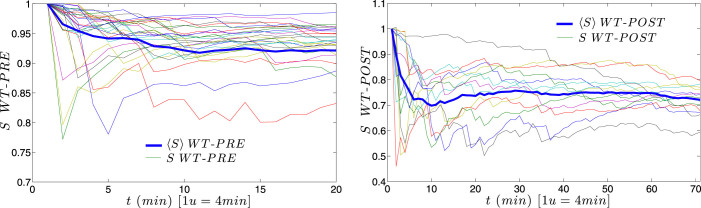
References
-
- Kim P. S., Levy D. & Lee P. P. Modeling and simulation of the immune system as a self-regulating network. Method. enzymol. 144, 79–109 (2009). - PubMed
-
- Chung S., Sudo R., Vickerman V., Zervantonakis I. K. & Kamm R. D. Microfluidic platforms for studies of angiogenesis, cell migration, and cell–cell interactions. Ann. Biomed. Eng. 38, 1164–1177 (2010). - PubMed
-
- Agliari E., Annibale A., Barra A., Coolen A. C. C. & Tantari D. Immune networks: Multitasking capabilities at medium load. J. Phys. A 46, 335101s (2013).
Publication types
MeSH terms
Substances
LinkOut - more resources
Full Text Sources
Other Literature Sources
Research Materials
Miscellaneous
