. 2015 Jan;129(1):115-31.
doi: 10.1007/s00401-014-1352-5. Epub 2014 Oct 17.

Bevacizumab treatment induces metabolic adaptation toward anaerobic metabolism in glioblastomas

Affiliations

Bevacizumab treatment induces metabolic adaptation toward anaerobic metabolism in glioblastomas

Fred Fack et al. Acta Neuropathol. 2015 Jan.

Abstract

Anti-angiogenic therapy in glioblastoma (GBM) has unfortunately not led to the anticipated improvement in patient prognosis. We here describe how human GBM adapts to bevacizumab treatment at the metabolic level. By performing (13)C6-glucose metabolic flux analysis, we show for the first time that the tumors undergo metabolic re-programming toward anaerobic metabolism, thereby uncoupling glycolysis from oxidative phosphorylation. Following treatment, an increased influx of (13)C6-glucose was observed into the tumors, concomitant to increased lactate levels and a reduction of metabolites associated with the tricarboxylic acid cycle. This was confirmed by increased expression of glycolytic enzymes including pyruvate dehydrogenase kinase in the treated tumors. Interestingly, L-glutamine levels were also reduced. These results were further confirmed by the assessment of in vivo metabolic data obtained by magnetic resonance spectroscopy and positron emission tomography. Moreover, bevacizumab led to a depletion in glutathione levels indicating that the treatment caused oxidative stress in the tumors. Confirming the metabolic flux results, immunohistochemical analysis showed an up-regulation of lactate dehydrogenase in the bevacizumab-treated tumor core as well as in single tumor cells infiltrating the brain, which may explain the increased invasion observed after bevacizumab treatment. These observations were further validated in a panel of eight human GBM patients in which paired biopsy samples were obtained before and after bevacizumab treatment. Importantly, we show that the GBM adaptation to bevacizumab therapy is not mediated by clonal selection mechanisms, but represents an adaptive response to therapy.


Figures

Fig. 1
Fig. 1
Schematic representation of the experimental design. Three weeks after implantation, tumor growth was assessed by MRI. The rats were then treated weekly with bevacizumab (10 mg/kg) for 3 weeks. During the first week of treatment, 8F-FMISO and 18F-FDG PET were performed at day 0, 3 and 7. At week 6, the animals underwent MRI. Before killing, the animals were infused i.v with 13C6-glucose, whereupon the brains were harvested at 15 min at 120 min after infusion for further analysis. For the flux analysis, tumor tissue was collected both from the tumor core as well as from the contralateral brain (lower panel)
Fig. 2
Fig. 2
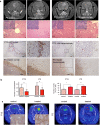
Bevacizumab induces reduction of contrast enhancement and normalization of vascular morphology. a Upper panels: T1 contrast-enhanced MRI images of control and bevacizumab-treated P3 and P13 tumors at week 6 after implantation. A reduction in contrast enhancement is seen after bevacizumab treatment. Corresponding H&E-stained sections of P3 tumors showing a reduction in pseudopalisading necrosis (insets), whereas this was not observed in the P13 tumors. (bars 100 µm). Lower panels: vWf factor staining of blood vessels in control P13 tumors showing a strong proliferation of endothelial cells at the tumor margin as indicated by numerous vascular nests. These nests were absent in the bevacizumab-treated tumors (bars 100 µm). P13 tumors stained with a nestin human monoclonal antibody show an increased invasion in bevacizumab-treated tumors compared to controls (bars 100 µm). b A significant reduction in blood vessels was observed for both P13 and P3 tumors following bevacizumab treatment, whereas in both tumors a significant increase in tumor cell invasion was seen. c 18F-FMISO PET images after the first week of bevacizumab treatment revealed a stronger hypoxia signal in both P3 and P13 tumors in the treatment groups (red arrows) compared to untreated control tumors (green arrows). For the P13 tumors, the 18F-FMISO PET images were confirmed by immunostaining for the hypoxyprobe pimonidazole (insets; bar 100 µm)
Fig. 3
Fig. 3
Increased glycolytic activity following bevacizumab treatment. a Principal components analysis (PCA) revealed clustering of metabolites extracted at 15 min after 13C6-glucose injection in the different animal groups: control and bevacizumab-treated tumors and contralateral brain (left panel). Distinctions between treated and control groups were, however, not evident at 120 min after injection (right panel). b Left panel: metabolic 13C6 glucose carbon flux analysis of labeled (gray) and unlabeled (colored) metabolites. The 13C isotopologues reveal an increased influx of labeled glucose (m + 6) leading to an increase of labeled pyruvate (m + 3) and lactate (m + 3) in the bevacizumab treatment tumors compared to the controls (dark gray bars: m + 3 isotopologues, light gray bars: m + 6 isotopologs). Increased labeled lactate was also seen in the contralateral brain upon treatment. Note that levels of unlabeled 12C glucose and pyruvate were reduced in treated tumors, while unlabeled lactate levels were increased, suggesting a depletion of the glucose pool in favor of lactate production (pink bars: untreated tumor, red bars: treated tumors). Right panel: 18F-FDG micro-PET imaging showing an increased uptake of this radioactive glucose analog after treatment (arrowheads depict the 18F-FDG signal). In vivo MRS shows a 17 % increase of lactate in the bevacizumab-treated animals confirming the results of the metabolic flux analysis. c Expression analysis of key metabolic enzymes. Left panel: RT-qPCR analysis shows an up-regulation of glycolytic enzymes (ALDOC, HK2 and PFKP) as well key enzymes of the pentose phosphate pathway (PPP) (G6PD, PGD, TALDO1 and TKT), in both P3 and P13 xenografts. Yet there is a stronger trend in P3 tumors compared to P13. Western blots (central panel) substantiated these observations indicating an up-regulation of PDK1, PFKP, HK2 and TKT protein after treatment. Right panel: quantification of the blots after normalization to β-actin
Fig. 4
Fig. 4
Bevacizumab treatment causes a reduction of metabolites associated with the TCA cycle. a Total metabolite levels (unlabeled and labeled) were quantified by LC–MS analysis. In addition to decreased glucose, glucose-6-phosphate and pryruvate levels, a reduction of metabolites associated with the TCA cycle was measured in the bevacizumab-treated tumors. These included pyruvate, cis-aconitate, α-ketoglutarate, succinate, fumarate and malate. Moreover, reduced levels of l-glutamine were observed following bevacizumab treatment. b Bevacizumab treatment led to reduced levels of glutathione and metabolites associated with glutathione synthesis, including l-cysteine, l-glutamate and l-glycine
Fig. 5
Fig. 5
Bevacizumab treatment leads to an increased lactate dehydrogenase (LDH) expression. a Immunohistochemical analysis of P3 and P13 tumors show an increased expression of LDH in the bevacizumab-treated tumors (bar 500 µm). For the P3 control tumors, LDH was highly expressed in the periphery (left panel; green arrows) as well as in hypoxic pseudopalisading necrotic areas (left panel; yellow arrows). Right panel, quantification of LDH expression in control and treated tumors (quantification was made over defined area of 3,122 µm, outlined in the immunostained sections). Western blots from both tumors confirmed the immunohistochemical observations (left panel). b Immunohistochemical analyses of human primary GBMs predominantly exhibit strong LDHA expression in tumor cells surrounding necroses (arrowheads upper middle, asterisks indicating necroses), while infiltration zones were virtually devoid of LDHA-positive cells. After bevacizumab treatment the LDHA expression pattern changed from a virtually exclusive perinecrotic pattern to a patchy leopard-skin-like expression (arrowheads lower left) also in non-necrotic tumor centers (lower middle) as well as in infiltration zones (lower right). Infiltrating pleomorphic tumor cells (black arrowheads lower right) strongly express LDHA (white arrowhead blowup on lower right indicating mitotic figure). (t. center tumor center, inf. zone infiltration zone; scale bars: lower left 1 mm, lower middle and right 100 µm). c Quantification of matched-pairs analyses revealed higher frequencies of LDH-positive cells in tumor centers (p = 0.0137) as well as in infiltration zones (p = 0.0159) after bevacizumab treatment. The number of LDHA-positive cells where quantified as fraction of the whole cell population
Fig. 6
Fig. 6
Flow cytometric analysis indicates that the change in phenotype represents an adaptive response and not clonal evolution and stem-like cell selection. a Hoechst-based ploidy measurements revealed that pseudodiploid P3 xenografts retained their initial ploidy after 3 weeks of bevacizumab treatment. b Flow cytometric phenotyping of tumor cells revealed no change in expression levels of classical glioma tumor cell membrane proteins such as EGFR, CD90, NG2 and CD29. c Also expression of the putative glioma stem cell markers CD133, CD15, CD44, A2B5 remained the same after treatment

References

    1. Batchelor TT, Gerstner ER, Emblem KE, Duda DG, Kalpathy-Cramer J, Snuderl M, Ancukiewicz M, Polaskova P, Pinho MC, Jennings D, et al. Improved tumor oxygenation and survival in glioblastoma patients who show increased blood perfusion after cediranib and chemoradiation. Proc Natl Acad Sci. 2013;110:19059–19064. doi: 10.1073/pnas.1318022110. - DOI - PMC - PubMed
    1. Batchelor TT, Sorensen AG, di Tomaso E, Zhang WT, Duda DG, Cohen KS, Kozak KR, Cahill DP, Chen PJ, Zhu M, et al. AZD2171, a pan-VEGF receptor tyrosine kinase inhibitor, normalizes tumor vasculature and alleviates edema in glioblastoma patients. Cancer Cell. 2007;11:83–95. doi: 10.1016/j.ccr.2006.11.021. - DOI - PMC - PubMed
    1. Baumgarten P, Brokinkel B, Zinke J, Zachskorn C, Ebel H, Albert FK, Stummer W, Plate KH, Harter PN, Hasselblatt M, et al. Expression of vascular endothelial growth factor (VEGF) and its receptors VEGFR1 and VEGFR2 in primary and recurrent WHO grade III meningiomas. Histol Histopathol. 2013;28:1157–1166. - PubMed
    1. Bjerkvig R, Tonnesen A, Laerum OD, Backlund EO. Multicellular tumor spheroids from human gliomas maintained in organ culture. J Neurosurg. 1990;72:463–475. doi: 10.3171/jns.1990.72.3.0463. - DOI - PubMed
    1. Carbonell WS, DeLay M, Jahangiri A, Park CC, Aghi MK. beta1 integrin targeting potentiates antiangiogenic therapy and inhibits the growth of bevacizumab-resistant glioblastoma. Cancer Res. 2013;73:3145–3154. doi: 10.1158/0008-5472.CAN-13-0011. - DOI - PMC - PubMed

Publication types

MeSH terms

LinkOut - more resources