

Mathematical models of electrical activity of the pancreatic β-cell: a physiological review
- PMID: 25322829
- PMCID: PMC4292577
- DOI: 10.4161/19382014.2014.949195
Mathematical models of electrical activity of the pancreatic β-cell: a physiological review
Abstract
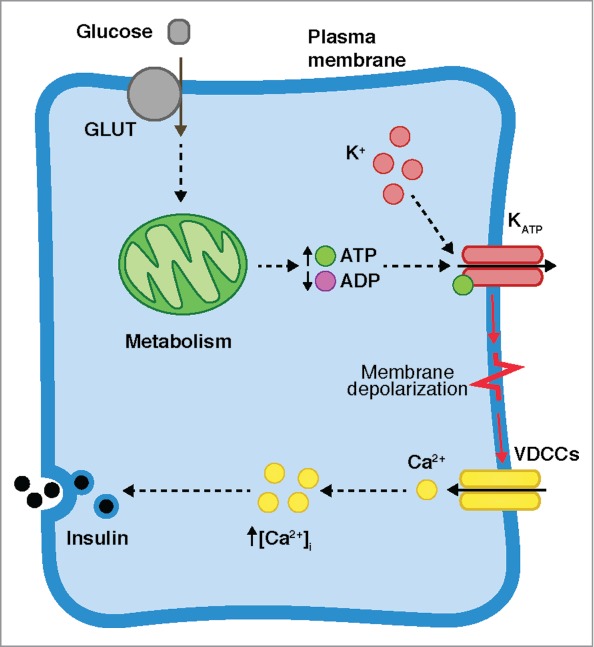
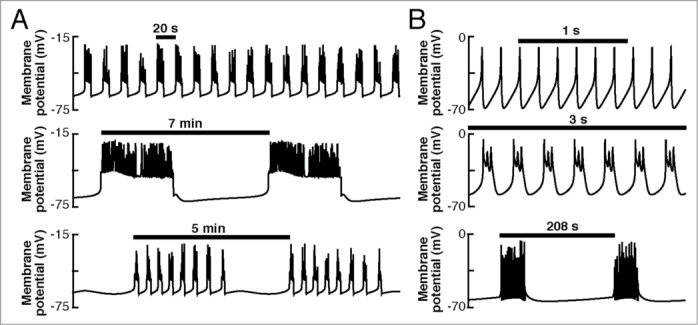
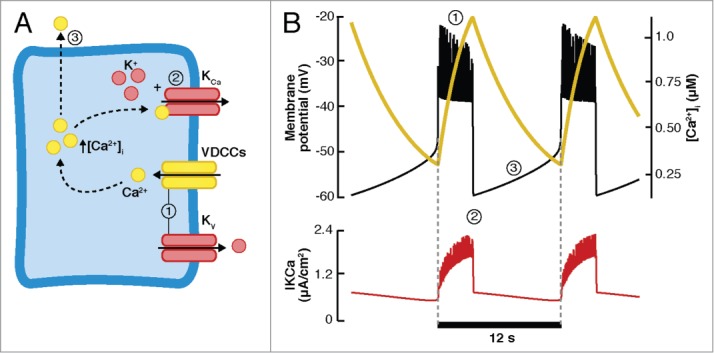
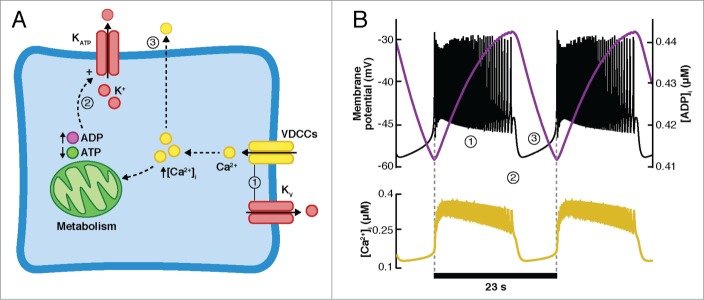
Mathematical modeling of the electrical activity of the pancreatic β-cell has been extremely important for understanding the cellular mechanisms involved in glucose-stimulated insulin secretion. Several models have been proposed over the last 30 y, growing in complexity as experimental evidence of the cellular mechanisms involved has become available. Almost all the models have been developed based on experimental data from rodents. However, given the many important differences between species, models of human β-cells have recently been developed. This review summarizes how modeling of β-cells has evolved, highlighting the proposed physiological mechanisms underlying β-cell electrical activity.
Keywords: ADP, adenosine diphosphate; ATP, adenosine triphosphate; CK, Chay-Keizer; CRAC, calcium release-activated current; Ca2+, calcium ions; DOM, dual oscillator model; ER, endoplasmic reticulum; F6P, fructose-6-phosphate; FBP, fructose-1,6-bisphosphate; GLUT, glucose transporter; GSIS, glucose-stimulated insulin secretion; HERG, human eter à-go-go related gene; IP3R, inositol-1,4,5-trisphosphate receptors; KATP, ATP-sensitive K+ channels; KCa, Ca2+-dependent K+ channels; Kv, voltage-dependent K+ channels; MCU, mitochondrial Ca2+ uniporter; NCX, Na+/Ca2+ exchanger; PFK, phosphofructokinase; PMCA, plasma membrane Ca2+-ATPase; ROS, reactive oxygen species; RyR, ryanodine receptors; SERCA, sarco-endoplasmic reticulum Ca2+-ATPase; T2D, Type 2 Diabetes; TCA, trycarboxylic acid cycle; TRP, transient receptor potential; VDCC, voltage-dependent Ca2+ channels; Vm, membrane potential; [ATP]i, cytosolic ATP; [Ca2+]i, intracellular calcium concentration; [Ca2+]m, mitochondrial calcium; [Na+], Na+ concentration; action potentials; bursting; cAMP, cyclic AMP; calcium; electrical activity; ion channels; mNCX, mitochondrial Na+/Ca2+ exchanger; mathematical model; β-cell.
Figures
Similar articles
-
Ion homeostasis and the functional roles of SERCA reactions in stimulus-secretion coupling of the pancreatic beta-cell: A mathematical simulation.Biophys Chem. 2008 May;134(3):119-43. doi: 10.1016/j.bpc.2008.02.001. Epub 2008 Feb 15. Biophys Chem. 2008. PMID: 18321634
-
Targeting calcium signaling in cancer therapy.Acta Pharm Sin B. 2017 Jan;7(1):3-17. doi: 10.1016/j.apsb.2016.11.001. Epub 2016 Dec 13. Acta Pharm Sin B. 2017. PMID: 28119804 Free PMC article. Review.
-
Effects of caffeine on cytoplasmic free Ca2+ concentration in pancreatic beta-cells are mediated by interaction with ATP-sensitive K+ channels and L-type voltage-gated Ca2+ channels but not the ryanodine receptor.Biochem J. 1995 Mar 15;306 ( Pt 3)(Pt 3):679-86. doi: 10.1042/bj3060679. Biochem J. 1995. PMID: 7702559 Free PMC article.
-
Inhibition of pancreatic β-cell Ca2+/calmodulin-dependent protein kinase II reduces glucose-stimulated calcium influx and insulin secretion, impairing glucose tolerance.J Biol Chem. 2014 May 2;289(18):12435-45. doi: 10.1074/jbc.M114.562587. Epub 2014 Mar 13. J Biol Chem. 2014. PMID: 24627477 Free PMC article.
-
Electrophysiology of islet cells.Adv Exp Med Biol. 2010;654:115-63. doi: 10.1007/978-90-481-3271-3_7. Adv Exp Med Biol. 2010. PMID: 20217497 Review.
Cited by
-
TRPC3 Regulates Islet Beta-Cell Insulin Secretion.Adv Sci (Weinh). 2023 Feb;10(6):e2204846. doi: 10.1002/advs.202204846. Epub 2023 Jan 15. Adv Sci (Weinh). 2023. PMID: 36642838 Free PMC article.
-
A pathway model of glucose-stimulated insulin secretion in the pancreatic β-cell.Front Endocrinol (Lausanne). 2023 Aug 2;14:1185656. doi: 10.3389/fendo.2023.1185656. eCollection 2023. Front Endocrinol (Lausanne). 2023. PMID: 37600713 Free PMC article.
-
Impact of β-Amyloids Induced Disruption of Ca2+ Homeostasis in a Simple Model of Neuronal Activity.Cells. 2022 Feb 10;11(4):615. doi: 10.3390/cells11040615. Cells. 2022. PMID: 35203266 Free PMC article.
-
Pulsatile Basal Insulin Secretion Is Driven by Glycolytic Oscillations.Physiology (Bethesda). 2022 Jul 1;37(4):0. doi: 10.1152/physiol.00044.2021. Epub 2022 Apr 4. Physiology (Bethesda). 2022. PMID: 35378996 Free PMC article. Review.
-
From Isles of Königsberg to Islets of Langerhans: Examining the Function of the Endocrine Pancreas Through Network Science.Front Endocrinol (Lausanne). 2022 Jun 15;13:922640. doi: 10.3389/fendo.2022.922640. eCollection 2022. Front Endocrinol (Lausanne). 2022. PMID: 35784543 Free PMC article. Review.
References
-
- Matthews DR, Lang DA, Burnett MA, Turner RC. Control of pulsatile insulin secretion in man. Diabetologia 1983; 24:231-7; PMID:6345247; http://dx.doi.org/10.1007/BF00282705 - DOI - PubMed
-
- Hellman B. Pulsatility of insulin release – a clinically important phenomenon. Ups J Med Sci 2009; 114:193-205; PMID:19961265; http://dx.doi.org/10.3109/03009730903366075 - DOI - PMC - PubMed
-
- Lang DA, Matthews DR, Burnett M, Turner RC. Brief, irregular oscillations of basal plasma insulin and glucose concentrations in diabetic man. Diabetes 1981; 30:435-9; PMID:7014311; http://dx.doi.org/10.2337/diab.30.5.435 - DOI - PubMed
-
- Michael DJ, Xiong W, Geng X, Drain P, Chow RH. Human insulin vesicle dynamics during pulsatile secretion. Diabetes 2007; 56:1277-88; PMID:17317765; http://dx.doi.org/10.2337/db06-0367 - DOI - PubMed
-
- Henquin JC, Ravier MA, Nenquin M, Jonas JC, Gilon P. Hierarchy of the beta-cell signals controlling insulin secretion. Eur J Clin Invest 2003; 33:742-50; PMID:12925032; http://dx.doi.org/10.1046/j.1365-2362.2003.01207.x - DOI - PubMed
Publication types
MeSH terms
Substances
LinkOut - more resources
Full Text Sources
Other Literature Sources
Research Materials
Miscellaneous