. 2014 Oct 17:4:6666.
doi: 10.1038/srep06666.

A novel crosstalk between BRCA1 and sirtuin 1 in ovarian cancer

Affiliations

A novel crosstalk between BRCA1 and sirtuin 1 in ovarian cancer

Da Li et al. Sci Rep. .

Abstract

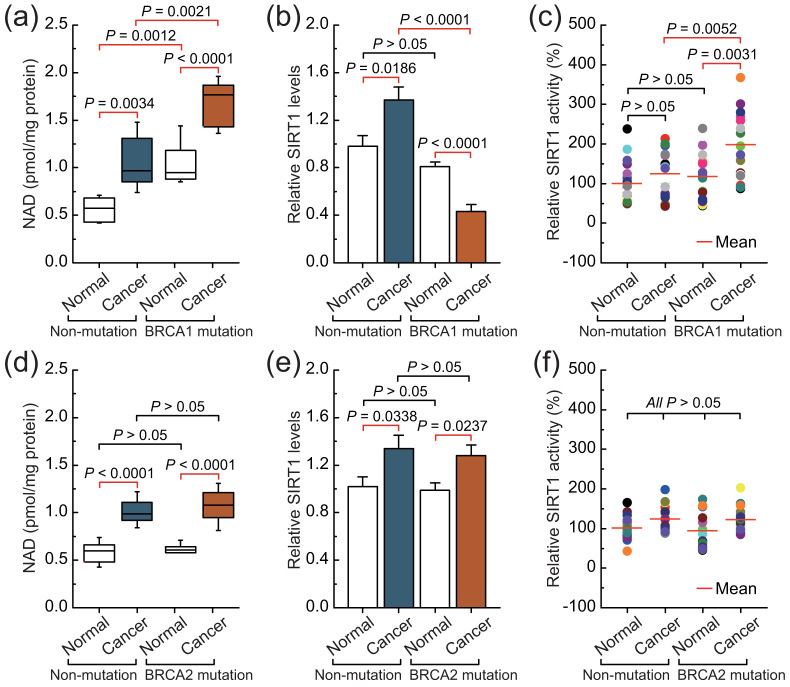
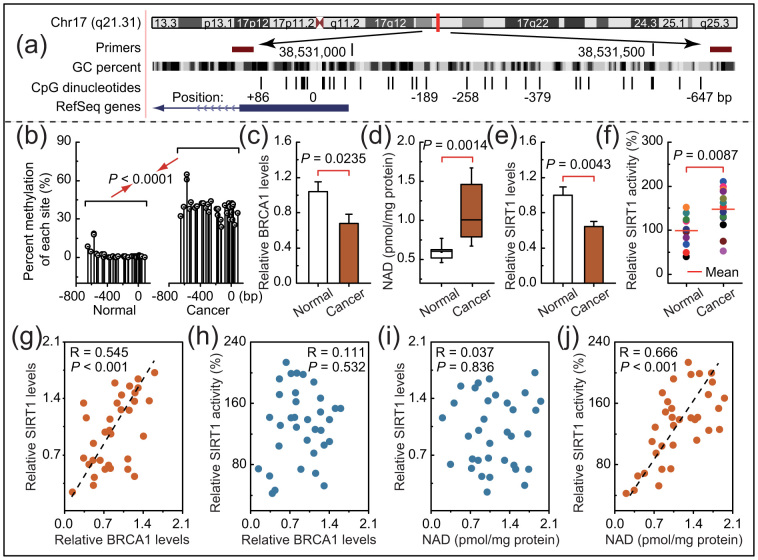
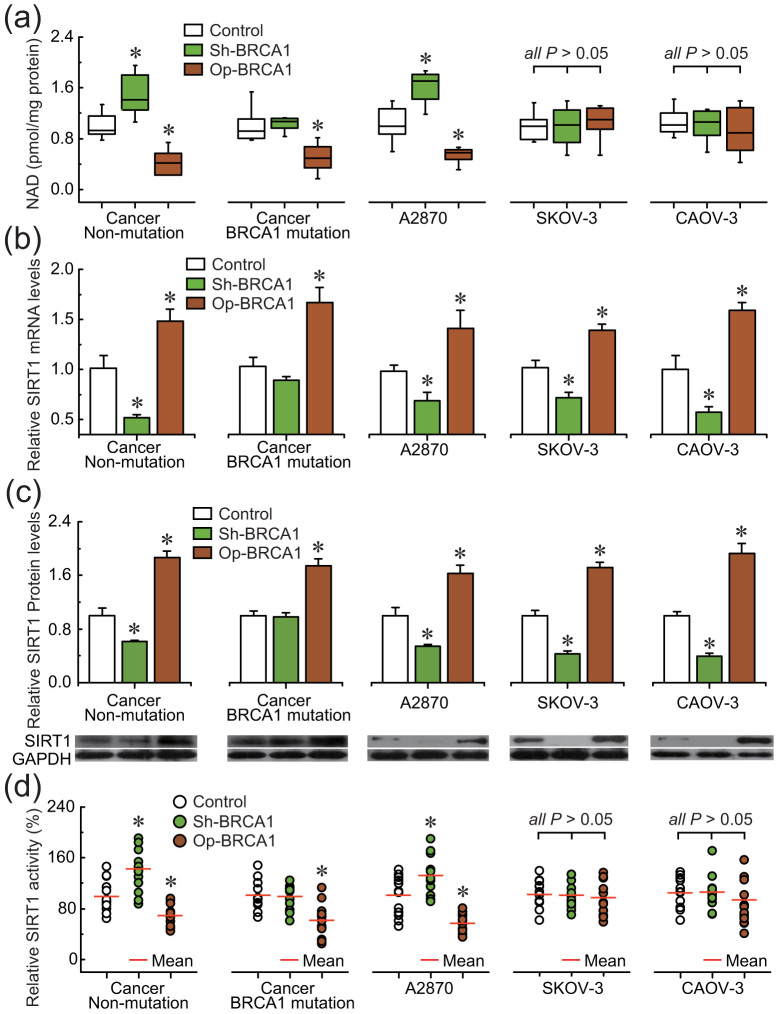
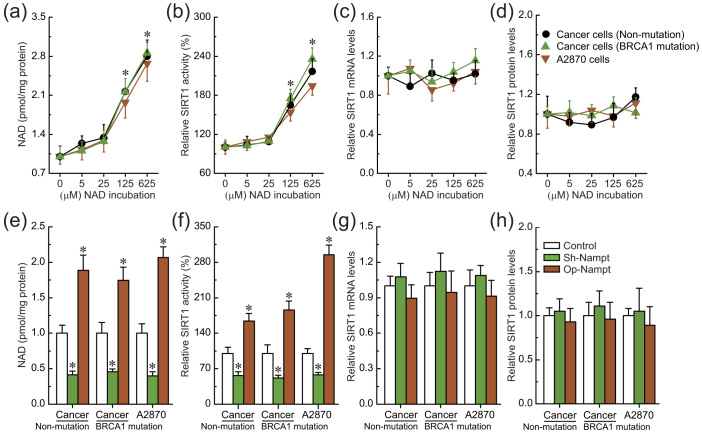
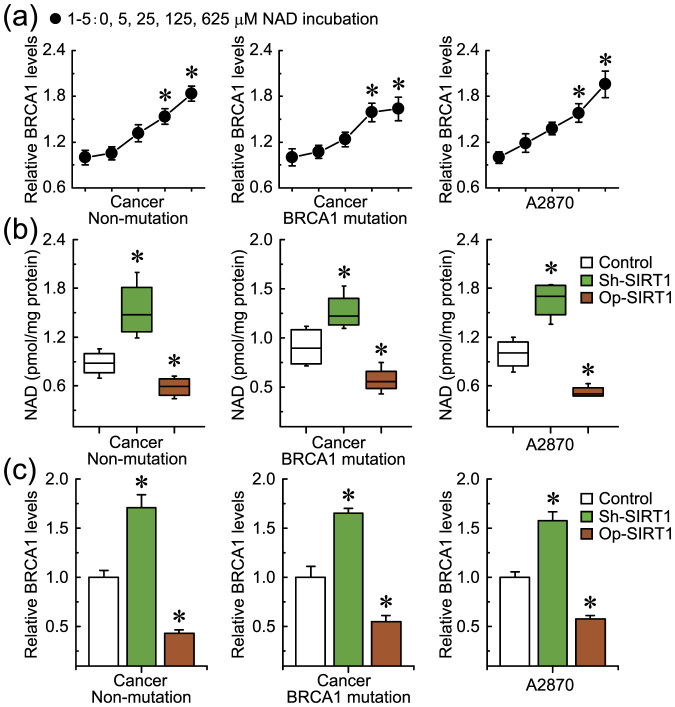
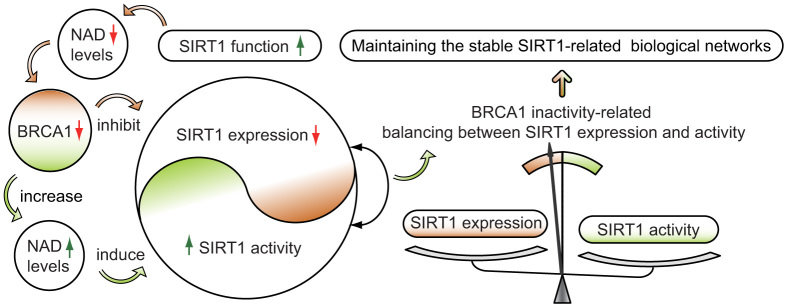
BRCA mutations are the main known hereditary factors for ovarian cancer. Notably, emerging evidence has led to considerable interest in the role of sirtuin 1 (SIRT1) in ovarian cancer development. However, dynamic crosstalk between BRCA1 and SIRT1 is poorly understood. Here, we showed that: (i) BRCA1 inactivation events (mutation, promoter methylation, or knockdown) were accompanied by decreased SIRT1 levels and increased nicotinamide adenine dinucleotide (NAD) levels and a subsequent increase in SIRT1 activity; (ii) overexpression of BRCA1 resulted in increased SIRT1 levels, an impairment in NAD synthesis, and a subsequent inhibition of SIRT1 activity; and (iii) intracellular NAD levels were largely responsible for regulating SIRT1 activity, and BRCA1 expression patterns correlated with SIRT1 levels and NAD levels correlated with SIRT1 activity in human ovarian cancer specimens. Interestingly, although BRCA1 inactivation events inhibited SIRT1 expression, they led to a substantial increase in NAD levels that enhanced NAD-related SIRT1 activity. This is a special BRCA1-mediated compensatory mechanism for the maintenance of SIRT1 function. Therefore, these results highlight a novel interaction between BRCA1 and SIRT1, which may be beneficial for the dynamic balance between BRCA1-related biologic processes and SIRT1-related energy metabolism and stress response.


Figures

Figure 1
Figure 1. Intracellular NAD levels and SIRT1 levels and activity in non-mutated, BRCA1-mutated, and BRCA2-mutated ovarian cancer.
(a–c), NAD levels, and SIRT1 levels and activity were measured in 20 pairs of non-BRCA1-mutated and BRCA1-mutated ovarian cancer and their adjacent normal tissue. Bar graphs show mean ± SD. (d–f), NAD levels, and SIRT1 levels and activity were measured in 16 pairs of non-BRCA2-mutated and BRCA2-mutated ovarian cancer and their adjacent normal tissue. Bar graphs show mean ± SD.
Figure 2
Figure 2. Intracellular NAD levels and SIRT1 levels and activity in ovarian cancer with hypermethylated promoter-mediated BRCA1 inactivation.
(a), The location of CpG sites in the core promoter region of BRCA1. Genomic coordinates are shown, along with the primer-amplified fragments, GC percentage, location of individual CpG dinucleotides (dashes), and BRCA1 RefSeq gene (exon 1 is shown as a blue box and the intron is shown as an arrowed line). The arrow indicates the direction of transcription. (b), Summary of the methylation patterns of the BRCA1 promoter in Fig. 2a. The y-axis shows the mean number of methylation sites. (c–f), BRCA1 levels, NAD levels, and SIRT1 levels and activity were measured in ovarian cancer with an identified hypermethylated BRCA1 promoter and compared with those of adjacent normal tissue (unmethylated BRCA1 promoter). Bar graphs show mean ± SD (each group, n = 13). (g and h), Correlation between BRCA1 levels and SIRT1 levels or SIRT1 activity in ovarian cancer tissues (each group, n = 34). (i and j), Correlation between NAD levels and SIRT1 levels or SIRT1 activity in ovarian cancer tissues (Each group, n = 34).
Figure 3
Figure 3. Effects of BRCA1 on intracellular NAD levels and SIRT1 levels and activity.
(a–d), NAD levels, SIRT1 mRNA and protein levels, and SIRT1 activity after knockdown or overexpression of BRCA1 in A2780, SKOV-3, and CAOV-3 ovarian cancer cell lines (repeated 12 times), and primary non-BRCA1-mutated and BRCA1-mutated ovarian cancer cells (n = 12). Bar graphs show mean ± SD. Sh, shRNAs; Op, overexpression. * P < 0.05 vs. control.
Figure 4
Figure 4. Effects of intracellular NAD on SIRT1 expression and activity.
(a–d), Relative NAD levels, SIRT1 activity, and SIRT1 mRNA and protein levels after incubation with different concentrations of NAD in A2780 cells (repeated 12 times) and primary non-BRCA1-mutated and BRCA1-mutated ovarian cancer cells (n = 12). 1–5: incubation with 0, 5, 25, 125, or 625 μM NAD. Bar graphs show mean ± SD. * P < 0.05 vs. control. (e–h), Relative NAD levels, SIRT1 activity, and SIRT1 mRNA and protein levels after knockdown or overexpression of Nampt in A2780 cells (repeated 12 times) and primary non-BRCA1-mutated and BRCA1-mutated ovarian cancer cells (n = 12). Bar graphs show mean ± SD. Sh, shRNAs; Op, overexpression. * P < 0.05 vs. control.
Figure 5
Figure 5. Effects of SIRT1-mediated intracellular NAD consumption on BRCA1 levels.
(a), BRCA1 levels after incubation with different concentrations of NAD in A2780 cells (repeated 12 times) and primary non-BRCA1-mutated and BRCA1-mutated ovarian cancer cells (n = 12). 1–5: incubation with 0, 5, 25, 125, or 625 μM NAD. Bar graphs show mean ± SD. * P < 0.05 vs. control. (b and c), NAD and BRCA1 levels after knockdown or overexpression of SIRT1 in A2780 cells (repeated 12 times) and primary non-BRCA1-mutated and BRCA1-mutated ovarian cancer cells (n = 12). Bar graphs show mean ± SD. Sh, shRNAs; Op, overexpression. * P < 0.05 vs. control.
Figure 6
Figure 6. Proposed model of crosstalk between BRCA1 and SIRT1 in ovarian cancer.
BRCA1 inactivation events (mutation, promoter methylation, or other pathways) will inhibit SIRT1 expression. However, BRCA1 inactivation induces a substantial increase in NAD levels, and consequently enhances SIRT1 activity. This is a special compensatory mechanism for the loss of SIRT1 expression. The model shows a significant effect of BRCA1 in the maintenance of SIRT1-related biological processes in ovarian cancer. The changes are indicated by red and green arrows.

Similar articles

Cited by

References

    1. Lech A. et al. Ovarian cancer as a genetic disease. Front. Biosci. 18, 543–563 (2013). - PubMed
    1. Pruthi S., Gostout B. S. & Lindor N. M. Identification and Management of Women With BRCA Mutations or Hereditary Predisposition for Breast and Ovarian Cancer. Mayo Clin. Proc. 85, 1111–1120 (2010). - PMC - PubMed
    1. Dacheux E. et al. BRCA1-Dependent Translational Regulation in Breast Cancer Cells. PLoS One 8, e67313 (2013). - PMC - PubMed
    1. Bi F. F., Li D. & Yang Q. Promoter hypomethylation, especially around the E26 transformation-specific motif, and increased expression of poly (ADP-ribose) polymerase 1 in BRCA-mutated serous ovarian cancer. BMC Cancer 13, 90 (2013). - PMC - PubMed
    1. Fang Y. Y., Li D., Cao C., Li C. Y. & Li T. T. Glucocorticoid receptor repression mediated by BRCA1 inactivation in ovarian cancer. BMC Cancer 14, 188 (2014). - PMC - PubMed

Publication types