. 2015 Apr;22(4):654-64.
doi: 10.1038/cdd.2014.152. Epub 2014 Oct 17.

NRF2-driven miR-125B1 and miR-29B1 transcriptional regulation controls a novel anti-apoptotic miRNA regulatory network for AML survival

Affiliations

NRF2-driven miR-125B1 and miR-29B1 transcriptional regulation controls a novel anti-apoptotic miRNA regulatory network for AML survival

N M Shah et al. Cell Death Differ. 2015 Apr.

Abstract

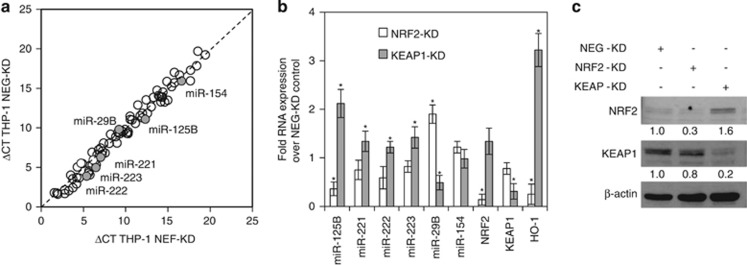
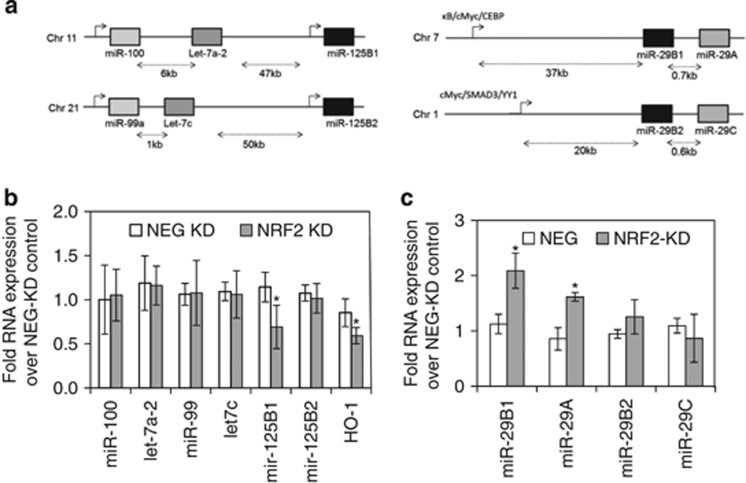
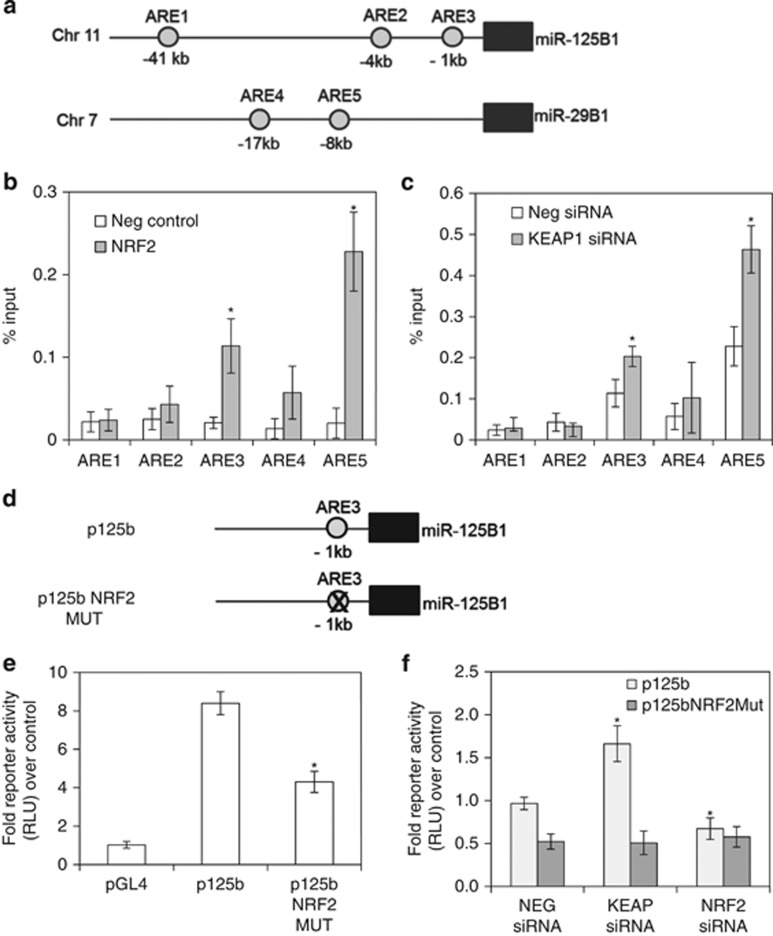
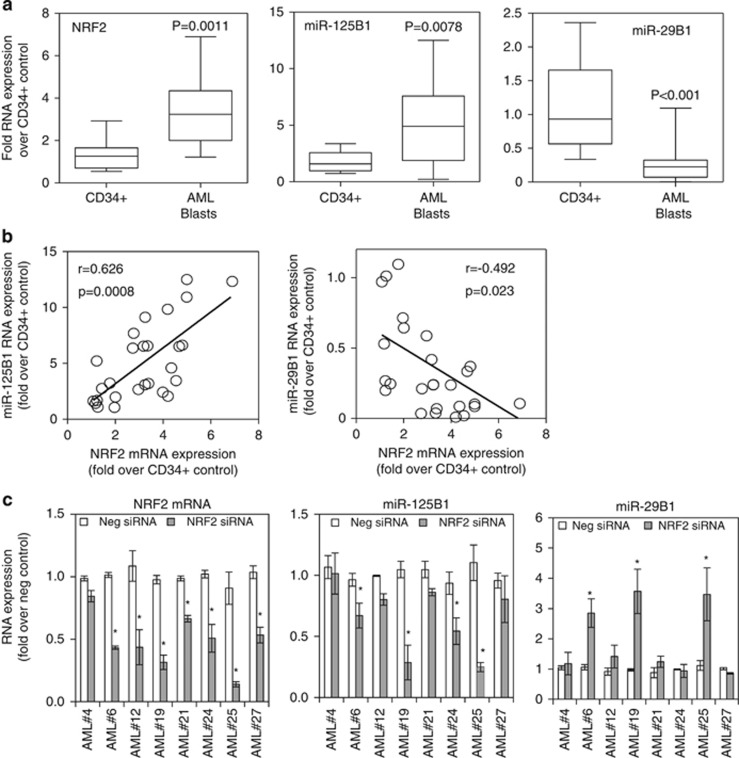
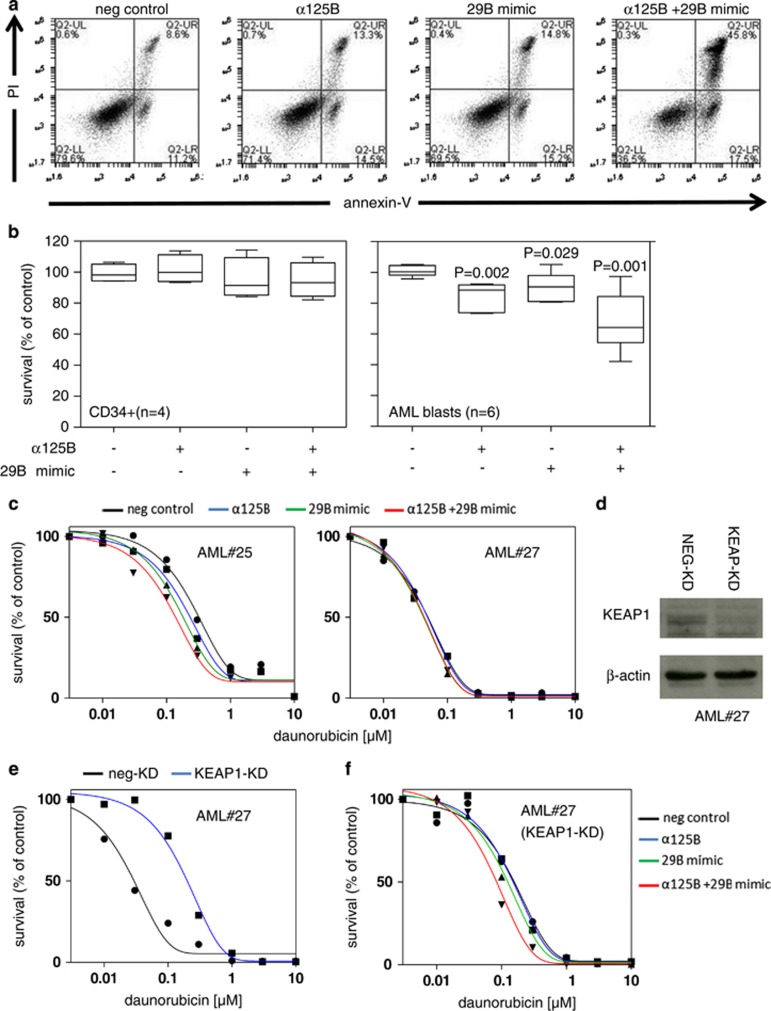
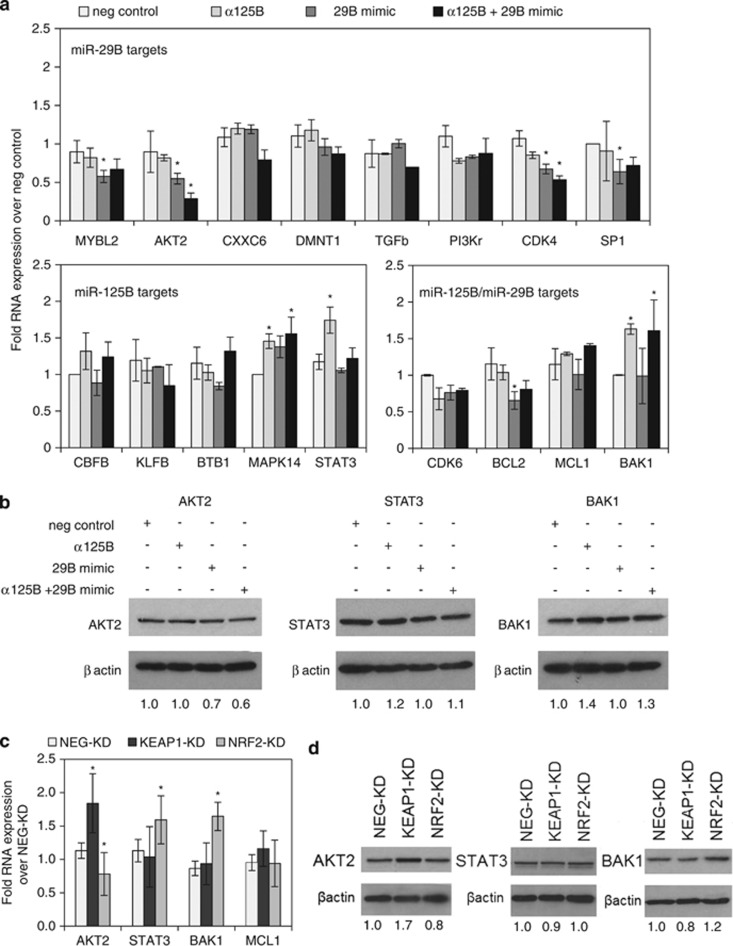
Transcription factor NRF2 is an important regulator of oxidative stress. It is involved in cancer progression, and has abnormal constitutive expression in acute myeloid leukaemia (AML). Posttranscriptional regulation by microRNAs (miRNAs) can affect the malignant phenotype of AML cells. In this study, we identified and characterised NRF2-regulated miRNAs in AML. An miRNA array identified miRNA expression level changes in response to NRF2 knockdown in AML cells. Further analysis of miRNAs concomitantly regulated by knockdown of the NRF2 inhibitor KEAP1 revealed the major candidate NRF2-mediated miRNAs in AML. We identified miR-125B to be upregulated and miR-29B to be downregulated by NRF2 in AML. Subsequent bioinformatic analysis identified putative NRF2 binding sites upstream of the miR-125B1 coding region and downstream of the mir-29B1 coding region. Chromatin immunoprecipitation analyses showed that NRF2 binds to these antioxidant response elements (AREs) located in the 5' untranslated regions of miR-125B and miR-29B. Finally, primary AML samples transfected with anti-miR-125B antagomiR or miR-29B mimic showed increased cell death responsiveness either alone or co-treated with standard AML chemotherapy. In summary, we find that NRF2 regulation of miR-125B and miR-29B acts to promote leukaemic cell survival, and their manipulation enhances AML responsiveness towards cytotoxic chemotherapeutics.


Figures

Figure 1
Figure 1
miRNA profiling of AML cells in response lentiviral NRF2 knockdown. (a) THP-1 cells were transduced with NEG (NEG-KD)- and NRF2 (NRF2-KD)-targeted miRNA lentiviral constructs. QRT-PCR analysis of 92 cancer-associated miRNAs in NRF2-KD THP-1 cells. Values represent change in qRT-PCR cycle threshold normalised to RNU6B (ΔCT). Dashed line indicates no change in expression. A red circle indicates miR-125B, miR221, miR-223, miR222, miR29B and miR154. (b) QRT-PCR of miR-125B, miR221, miR-223, miR222, miR29B, miR154, NRF2, KEAP1 and HO1 in THP-1 cells transduced with NEG-KD, NRF2-KD or KEAP1-KD. Values represent fold change in RNA expression over NEG-KD control. (c) THP-1 were transduced with NEG-KD, NRF2-KD or KEAP1-KD before cells were analysed for NRF2 and KEAP1 using western blotting. Blots were reprobed for β-actin to show sample loading. The numbers under the blots indicate densitometry analysis of the blots using Image J software, and the results are expressed as fold change relative to the NEG-KD control
Figure 2
Figure 2
NRF2 regulates homologues miR-125B1 and miR-29B1 and miR-29A in human AML. (a) Schematic representation of the miRNA chromosomal positioning of miR-125B (1 and 2) and miR-29B (1 and 2). (b) Total RNA was extracted from THP-1 transduced with NEG-KD and NRF2-KD and examined for miRNA expression including immature miR-125B1, miR-125B2 RNA and HO-1 mRNA expression. (c) Total RNA was extracted from THP-1 transduced with NEG-KD and NRF2-KD and examined for miR-29A and miR-29C expression including immature miR-29B1, miR-29B2 RNA and HO-1 mRNA expression
Figure 3
Figure 3
NRF2 binds to ARE sites in the promoters of miR-125B1 and miR-29B1. (a) Schematic presentation of ARE binding sequences in the 5′ region of miR-29B1 on chromosome 7 and miR-125B1 on chromosome 11. (b) Chromatin immunoprecipitation (ChIP) analysis of the miR-29B1 and miR-125B1 promoter using antibodies against NRF2 and normal rabbit IgG was used as a control. QRT-PCR was performed in triplicate on immunoprecipitated DNA and input DNA. Data presented as percent of input. * indicates P<0.05 between the different treatment groups. (c) THP-1 cells were transfected with control siRNA and KEAP1 siRNA for 24 h and ChIP was performed. Real-time PCR was performed in triplicate on immunoprecipitated DNA and input DNA. Data presented as percent of input. * indicates P<0.05 between the different treatment groups. (d) Schematic representation of mutated miR-125B promoter sequence. (e) THP-1 cells were transiently transfected with 0.5 μg of each promoter construct including control plasmid and pRL-TK for normalisation of transfection efficiency. Cell extracts were harvested and luciferase assays were performed. Values are the means±S.D., n=4. * indicates P<0.01 of deleted ARE against PGL4 control. (f) Control, KEAP1 and NRF2 siRNA were transfected at the same time as p125b and p125bNRF2 MUT and incubated for 48 h. Cell extracts were harvested and luciferase assays were performed. Values are the means±S.D., n=4. * indicates P<0.01 of KEAP1 siRNA and NRF2 siRNA against NEG siRNA control
Figure 4
Figure 4
NRF2 regulates miR-29B1 and miR-125B1 in primary AML. (a) Total RNA was extracted from patient AML blasts (n=18) and CD34+ HSC (n=8). NRF2, miR-29B1 and miR-125B1 RNA expression levels were measured using QRT-PCR. (b) Pearson's correlation analysis between miR-125B1 or miR-29B1 and NRF2 mRNA expression in human primary AML cells. (c) Control and NRF2 siRNA were transfected into primary blasts (n=7) for 48 h and RNA extracted. RNA was analysed for NRF2, miR-125B1 and miR-29B RNA expression. Values are the means±S.D., n=3
Figure 5
Figure 5
miR-125B antagomiR and miR-29B mimic induce apoptosis of AML cells and increases there sensitivity to AML chemotherapy. (a) THP-1 were transfected with control miRNA, miR-125B antagomiR (α125B), miR-29B mimic (29B mimic) and miR-125B antagomiR in combination with miR-29B mimic for 48 h before cells were analysed for apoptosis by PI/Annexin V staining. (b) AML blasts (n=6) and CD34+ (n=4) were transfected with control miRNA, miR-125B antagomiR and miR-29B mimic and miR-125B antagomiR in combination with miR-29B mimic for 24 h and then assessed for cell viability by Cell Titer-GLO. (c) AML blasts and CD34+ cells were transfected with control miRNA (miR-mimic negative control and the anti-miR miRNA inhibitor negative control for single experiments and combined miR-mimic negative control and the anti-miR miRNA inhibitor negative control in combined experiments), miR-125B antagomiR, miR-29B mimic and miR-125B antagomiR in combination with miR-29B mimic for 24 h before the addition of increasing doses of daunorubicin for 48 h. Cells assessed for viability by Cell Titer-GLO. (d) AML#27 was transduced with NEG-KD and KEAP1-KD for 48 h before cells before the addition of increasing doses of daunorubicin for 48 h before cells were analysed for KEAP1 using western blotting. Blots were reprobed for β-actin to show sample loading. (e) AML#27 was transduced with NEG-KD and KEAP1-KD for 48 h before the addition of increasing doses of daunorubicin for 48 h. Cells were assessed for viability by Cell Titer-GLO. (f) AML#27 was transduced with KEAP1-KD for 48 h before cells were transfected with control miRNA, miR-125B antagomiR, miR-29B mimic and miR-125B antagomiR in combination with miR-29B mimic for 24 h followed by the addition of increasing doses of daunorubicin for 48 h. Cells were assessed for viability by Cell Titer-GLO
Figure 6
Figure 6
miR-125B antagomiR and miR-29B mimic gene targets in AML cells. (a) THP-1 were transfected with control miRNA, miR-125B antagomiR (α125B), miR-29B mimic (29B mimic) and miR-125B antagomiR in combination with miR-29B mimic for 48 h before cells were analysed for target gene expression using QRT-PCR. (b) THP-1 cells were transfected with control miRNA, miR-125B antagomiR (α125B), miR-29B mimic (29B mimic) and miR-125B antagomiR in combination with miR-29B mimic for 48 h before cells were analysed for AKT2, STAT3 and BAK1 using western blotting. Blots were reprobed for β-actin to show sample loading. (c) QRT-PCR of mRNA for AKT2, STAT3, BAK1 and MCL1 in THP-1 cells transduced with NEG-KD, NRF2-KD or KEAP1-KD. Values represent fold change in RNA expression over NEG-KD control. (d) THP-1 cells were transduced with NEG-KD, NRF2-KD or KEAP1-KD before cells were analysed for AKT2, STAT3 and BAK1 protein expression using western blotting. Blots were reprobed for β-actin to show sample loading. The numbers under the blots indicate densitometry analysis of the blots using Image J software, and the results are expressed as fold change relative to the negative control

References

    1. Estey E, Dohner H. Acute myeloid leukaemia. Lancet. 2006;368:1894–1907. - PubMed
    1. Kvinlaug BT, Chan WI, Bullinger L, Ramaswami M, Sears C, Foster D, et al. Common and overlapping oncogenic pathways contribute to the evolution of acute myeloid leukemias. Cancer Res. 2011;71:4117–4129. - PMC - PubMed
    1. Moi P, Chan K, Asunis I, Cao A, Kan YW. Isolation of NF-E2-related factor 2 (Nrf2), a NF-E2-like basic leucine zipper transcriptional activator that binds to the tandem NF-E2/AP1 repeat of the beta-globin locus control region. Proc Natl Acad Sci USA. 1994;91:9926–9930. - PMC - PubMed
    1. Alam J, Stewart D, Touchard C, Boinapally S, Choi AMK, Cook JL. Nrf2, a Cap'n'Collar transcription factor, regulates induction of the heme oxygenase-1 gene. J Biol Chem. 1999;274:26071–26078. - PubMed
    1. Venugopal R, Jaiswal AK. Nrf1 and Nrf2 positively and c-Fos and Fra1 negatively regulate the human antioxidant response element-mediated expression of NAD(P)H:quinone oxidoreductase1 gene. Proc Natl Acad Sci USA. 1996;93:14960–14965. - PMC - PubMed

Publication types

MeSH terms