. 2014 Nov 10;42(20):12333-51.
doi: 10.1093/nar/gku939. Epub 2014 Oct 16.

Survey of chimeric IStron elements in bacterial genomes: multiple molecular symbioses between group I intron ribozymes and DNA transposons

Affiliations

Survey of chimeric IStron elements in bacterial genomes: multiple molecular symbioses between group I intron ribozymes and DNA transposons

Nicolas J Tourasse et al. Nucleic Acids Res. .

Abstract

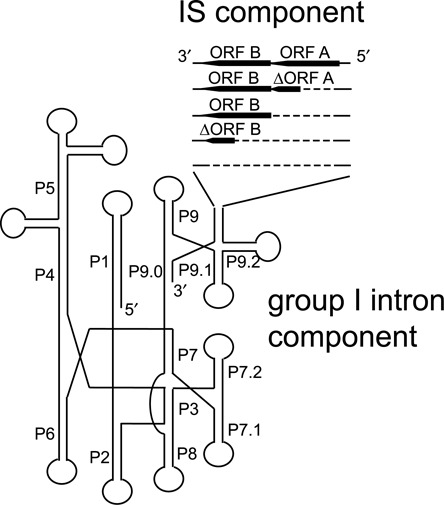
IStrons are chimeric genetic elements composed of a group I intron associated with an insertion sequence (IS). The group I intron is a catalytic RNA providing the IStron with self-splicing ability, which renders IStron insertions harmless to the host genome. The IS element is a DNA transposon conferring mobility, and thus allowing the IStron to spread in genomes. IStrons are therefore a striking example of a molecular symbiosis between unrelated genetic elements endowed with different functions. In this study, we have conducted the first comprehensive survey of IStrons in sequenced genomes that provides insights into the distribution, diversity, origin and evolution of IStrons. We show that IStrons have a restricted phylogenetic distribution limited to two bacterial phyla, the Firmicutes and the Fusobacteria. Nevertheless, diverse IStrons representing two major groups targeting different insertion site motifs were identified. This taken with the finding that while the intron components of all IStrons belong to the same structural class, they are fused to different IS families, indicates that multiple intron-IS symbioses have occurred during evolution. In addition, introns and IS elements related to those that were at the origin of IStrons were also identified.


Figures

Figure 1.
Figure 1.
Schematic representation of the IStron structure. An IStron is made of two components: a group I intron and an IS element. The intron component is a self-splicing ribozyme made up of nine paired regions (P1–P9) which may include additional subdomains (P7.1, P7.2, P9.0, P9.1 and P9.2). The IS component is DNA transposon which encodes two ORFs (A and B; thick black arrowheads), one or both of them may be a transposase. In the majority of cases, variants have been identified, in which ORF A or both ORFs are truncated or missing.
Figure 2.
Figure 2.
The 3-fold bioinformatic search procedure for IStron identification employed in this study (for details see the Materials and Methods section).
Figure 3.
Figure 3.
Multiple sequence alignment showing the IStron target sites, boundaries and sequence ends. Omitted regions are indicated by the sign ‘[…]’. GenBank accession numbers of genomic sequences encoding the IStrons shown are given in parentheses next to IStron names. IStron-less sequences homologous to IStron flanking exons are included to confirm IStron boundaries (sequences named by their GenBank accession numbers only). Also included are IS elements (ISDra2 and ISBth15 from D. radiodurans and B. thuringiensis, respectively, taken from the ISfinder database) and group I introns (GenBank accessions ACJY01000107 and ADMN01000043 from F. periodonticum and T. sanguinis, respectively) with ends and target sites similar to those of IStrons. Group A and B IStrons are inserted next to T-rich pentanucleotide and GG-containing sites, respectively, which are boxed in cyan. Note that the target site of group B IStrons does not end with a U, unlike for virtually all known group I introns. In group A IStrons, the regions corresponding to the subterminal palindromes that are recognized by the ORF A transposase during transposition of IS200/IS605 elements are highlighted in yellow. For group B IStrons, imperfect AT-rich IR motifs that are presumed to be recognized by the ORF A transposase during transposition of IS607 elements are highlighted in light blue. IR motifs forming the IR stem in the group I intron structure of IStrons (see Figure 4) are boxed in black. The direct repeat sequence (3′ DR) that is similar to part of the 5′ IR motif (5′ IR/5′ DR) and that is located immediately upstream of, and is globally complementary to, the 3′ IR motif in group B IStrons is boxed in yellow.
Figure 4.
Figure 4.
Predicted secondary structure of the BcISt1 IStron and comparison of key structural features of group A and B IStrons. In the BcISt1 structure, labels P1 to P9 indicate the group I intron domains and subdomains. The IR and DR motifs in the IR stem-loop region of BcISt1 are colored in red and blue. The boxed inset shows the predicted structure of IRs in the ORF-less copies of BcISt1 that were obtained experimentally in this study (see Figure 7) and that were also identified in the genome sequences of emetic strains of B. cereus. The IGS stem is colored in orange. Exon sequences are in lowercase. Splice sites are indicated by arrows. A comparison of the P1 subdomains of various IStrons is shown to illustrate that the U–G pair that is critical for 5′ splice site recognition is surrounded by flanking base-pairs within the IGS stem in group A IStrons, whereas it is predicted to be immediately followed by an internal loop in group B elements, where it is shifted by one bp relative to the splice site. For group A IStrons, bases corresponding to the subterminal palindromes that are required for IS200/IS605 elements (see Figure 3) are highlighted in purple. A comparison of the IR regions is also shown to illustrate that the IR stem is short and compositionally balanced in group A IStrons, in contrast to the long and extremely AU-rich stem in group B elements. The IS (transposase) component is represented by a circle. The structural models shown are from selected representatives that illustrate the variability in sequence and structure. Sequences of the 5′ and 3′ ends of the other IStrons, which are highly similar to those shown here, can be seen in Figure 3. GenBank accession numbers of genomic sequences encoding the IStrons shown are given in parentheses.
Figure 5.
Figure 5.
Phylogenetic analysis of ORFs A and B from IStrons and IS elements. Trees were reconstructed using the maximum-likelihood method. Only IS ORFs that are the closest relatives to IStron ORFs are included (listed in Table 1). IStrons from groups A and B are labeled in gray and black, respectively, and their target sites are given in parentheses. IS elements are labeled in white over a gray background. IS elements marked with an asterisk are from species in which no IStron could be identified. As can be seen, IStron ORFs usually do not form monophyletic clusters separated from IS elements and IStrons from groups A and B are intermixed, indicating that IStrons have multiple origins. Note also the correlation between IStron ORF phylogeny and target site. Numbers on nodes represent statistical confidence in branchings computed as SH-like support values. Scale bars are in average numbers of amino-acid substitutions per site. The number of amino-acid positions used in the analysis was 135, 206 and 441 for the ORF A (group A), ORF A (group B) and ORF B datasets, respectively.
Figure 6.
Figure 6.
BcISt1 IStron splicing in vivo in B. cereus ATCC 10987. (A) RT-PCR experiments conducted on total RNA with inward primers located in the exons flanking the IStron. For each of the three BcISt1 copies encoded by B. cereus ATCC 10987 (lanes IS1, IS2 and IS3), a product of ∼300–400 bp corresponding to the ligated exons was detected, indicating that the 1.9-kb IStron has spliced out (expected product sizes: 382, 356 and 323 bp for IS1, IS2 and IS3, respectively). Lanes IS1_N, IS2_N and IS3_N represent negative control experiments conducted without RT. Lane M, size marker. (B) RT-PCR experiments conducted with outward primers located in the IStron. Products of ∼400 bp were detected, corresponding to the junction of excised, circular IStron forms. Black and gray arrows indicate junctions corresponding to the full-length (or near full-length, FL) and partial (PC) IStron circles, respectively. IS_N, negative control without RT; M, size marker. DNA marker in A and B: pBR322-MspI (New England Biolabs). (C) Sequences of circular junction products include the full-length IStron circle (FL, bottom sequence) as well as several partial circles (PC) lacking the first one, the first 42, the first 71 or the last base.
Figure 7.
Figure 7.
(A) Constructs made to test the mobility of the BcISt1 IStron. Constructs were cloned into pCR2.1-TOPO TA-cloning vector. The various sequence features are indicated, along with their sizes (in bp) and the locations of restriction sites used for plasmid linearization or digestion. The size indicated for the IS component does not include the DR and IR motifs since it is not known if these motifs belong to the intron or the IS component. The thick horizontal black lines indicate the positions of hybridization probes. Plac is an IPTG-inducible promoter. Features are not drawn to scale. The expected sizes of all constructs are listed in the table underneath. (B and C) Test for BcISt1 IStron mobility using the WT BcISt1 construct at 37°C in a RecA+ (xl–1; panel B) or RecA− (SCS110; panel C) E. coli strain. The various gels show the results of Southern hybridization experiments conducted with labeled dsDNA probes specific for the intron or IS (ORF B) component of BcISt1 or the 5′ exon. Schematic structures of the products in relevant bands are drawn on the left and their expected sizes (in bp) are given in parentheses; white boxes: exons, gray box: intron component, black box: IS component, black horizontal line: vector. The rightmost panel shows ethidium bromide straining of plasmid DNA, with the sizes (in bp) of relevant bands indicated. Plasmid DNA was linearized with NcoI (panels B and C) or digested with EcoRI (panel B). Hybridizations were carried out on plasmid DNA samples extracted from bacterial cultures during 8–12 days of bacterial growth in LBamp media without IPTG or with 1 mM IPTG. Panel B also shows hybridization of genomic DNA isolated at the end of the growth assay and purified of plasmid. Genomic DNA was digested with HincII. A difference among the banding patterns obtained with the various probes would indicate that a DNA rearrangement (i.e. an excision event) involving the IStron has occurred. In panel B, the loss of hybridization signal with the IS ORF B probe for the lower band (corresponding to the ORF-less product) implies excision of part of the IS component. DNA markers: Lambda-BstEII and pBR322-MspI (New England Biolabs).
Figure 8.
Figure 8.
Test for BcISt1 IStron mobility using mutant BcISt1 constructs deleted of the sequence regions covering ORF B (panel A) or the 5′ DR and 3′ DR motifs (panels B and C, respectively). Data shown as explained in the legend to Figure 7. No IPTG, 0.5 mM or 1 mM IPTG was used. In all panels, plasmid DNA was linearized with NcoI. Note the absence of rearrangement events for the ΔORFB and Δ5′DR mutants, whereas events involving the IS component occurred with the Δ3′DR construct. DNA marker: Lambda-BstEII (New England Biolabs).

Similar articles

Cited by

References

    1. Frost L.S., Leplae R., Summers A.O., Toussaint A. Mobile genetic elements: the agents of open source evolution. Nat. Rev. 2005;3:722–732. - PubMed
    1. Aziz R.K., Breitbart M., Edwards R.A. Transposases are the most abundant, most ubiquitous genes in nature. Nucleic Acids Res. 2010;38:4207–4217. - PMC - PubMed
    1. Hazen T.H., Pan L., Gu J.D., Sobecky P.A. The contribution of mobile genetic elements to the evolution and ecology of Vibrios. FEMS Microbiol. Ecol. 2010;74:485–499. - PubMed
    1. Kazazian H.H., Jr Mobile elements: drivers of genome evolution. Science. 2004;303:1626–1632. - PubMed
    1. Lisch D. How important are transposons for plant evolution. Nat. Rev. Genet. 2013;14:49–61. - PubMed

Publication types

LinkOut - more resources