

Air pollution and acute respiratory infections among children 0-4 years of age: an 18-year time-series study
- PMID: 25324558
- PMCID: PMC4224364
- DOI: 10.1093/aje/kwu234
Air pollution and acute respiratory infections among children 0-4 years of age: an 18-year time-series study
Abstract
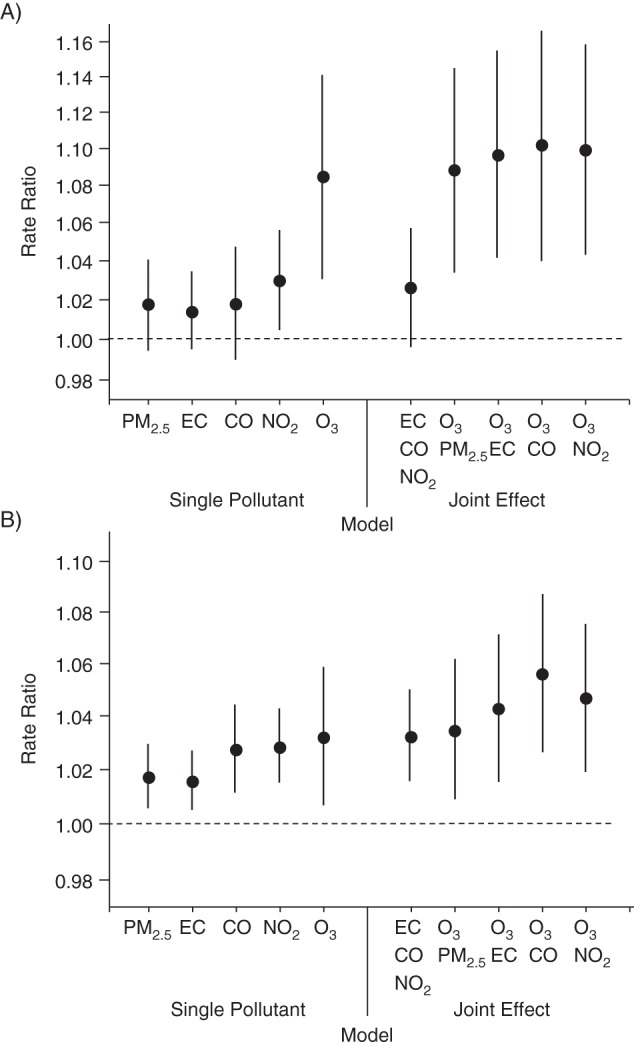
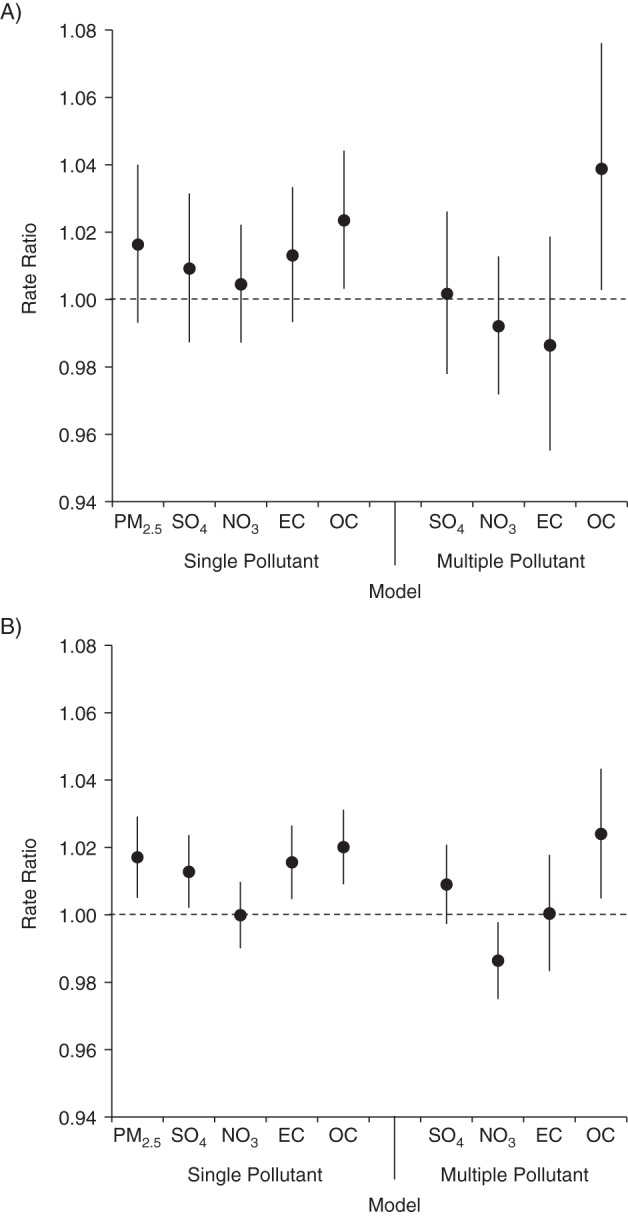
Upper and lower respiratory infections are common in early childhood and may be exacerbated by air pollution. We investigated short-term changes in ambient air pollutant concentrations, including speciated particulate matter less than 2.5 μm in diameter (PM2.5), in relation to emergency department (ED) visits for respiratory infections in young children. Daily counts of ED visits for bronchitis and bronchiolitis (n = 80,399), pneumonia (n = 63,359), and upper respiratory infection (URI) (n = 359,246) among children 0-4 years of age were collected from hospitals in the Atlanta, Georgia, area for the period 1993-2010. Daily pollutant measurements were combined across monitoring stations using population weighting. In Poisson generalized linear models, 3-day moving average concentrations of ozone, nitrogen dioxide, and the organic carbon fraction of particulate matter less than 2.5 μm in diameter (PM2.5) were associated with ED visits for pneumonia and URI. Ozone associations were strongest and were observed at low (cold-season) concentrations; a 1-interquartile range increase predicted a 4% increase (95% confidence interval: 2%, 6%) in visits for URI and an 8% increase (95% confidence interval: 4%, 13%) in visits for pneumonia. Rate ratios tended to be higher in the 1- to 4-year age group compared with infants. Results suggest that primary traffic pollutants, ozone, and the organic carbon fraction of PM2.5 exacerbate upper and lower respiratory infections in early life, and that the carbon fraction of PM2.5 is a particularly harmful component of the ambient particulate matter mixture.
Keywords: air pollution; bronchiolitis; children; lower respiratory infection; pneumonia; upper respiratory infection.
© The Author 2014. Published by Oxford University Press on behalf of the Johns Hopkins Bloomberg School of Public Health. All rights reserved. For permissions, please e-mail: journals.permissions@oup.com.
Figures

References
-
- World Health Organization. World Health Statistics 2013. Geneva, Switzerland: World Health Organization Press; 2013.
-
- Harrod KS, Jaramillo RJ, Rosenberger CL, et al. Increased susceptibility to RSV infection by exposure to inhaled diesel engine emissions. Am J Respir Cell Mol Biol. 2003;28(4):451–463. - PubMed
-
- Pope CA., 3rd Respiratory hospital admissions associated with PM10 pollution in Utah, Salt Lake, and Cache Valleys. Arch Environ Health. 1991;46(2):90–97. - PubMed
Publication types
MeSH terms
Substances
Grants and funding
LinkOut - more resources
Full Text Sources
Other Literature Sources
Medical
