. 2014 Sep 30:8:121.
doi: 10.3389/fncir.2014.00121. eCollection 2014.

Sensory gating of an embryonic zebrafish interneuron during spontaneous motor behaviors

Affiliations

Sensory gating of an embryonic zebrafish interneuron during spontaneous motor behaviors

Laura D Knogler et al. Front Neural Circuits. .

Abstract

In all but the simplest monosynaptic reflex arcs, sensory stimuli are encoded by sensory neurons that transmit a signal via sensory interneurons to downstream partners in order to elicit a response. In the embryonic zebrafish (Danio rerio), cutaneous Rohon-Beard (RB) sensory neurons fire in response to mechanical stimuli and excite downstream glutamatergic commissural primary ascending (CoPA) interneurons to produce a flexion response contralateral to the site of stimulus. In the absence of sensory stimuli, zebrafish spinal locomotor circuits are spontaneously active during development due to pacemaker activity resulting in repetitive coiling of the trunk. Self-generated movement must therefore be distinguishable from external stimuli in order to ensure the appropriate activation of touch reflexes. Here, we recorded from CoPAs during spontaneous and evoked fictive motor behaviors in order to examine how responses to self-movement are gated in sensory interneurons. During spontaneous coiling, CoPAs received glycinergic inputs coincident with contralateral flexions that shunted firing for the duration of the coiling event. Shunting inactivation of CoPAs was caused by a slowly deactivating chloride conductance that resulted in lowered membrane resistance and increased action potential threshold. During spontaneous burst swimming, which develops later, CoPAs received glycinergic inputs that arrived in phase with excitation to ipsilateral motoneurons and provided persistent shunting. During a touch stimulus, short latency glutamatergic inputs produced cationic currents through AMPA receptors that drove a single, large amplitude action potential in the CoPA before shunting inhibition began, providing a brief window for the activation of downstream neurons. We compared the properties of CoPAs to those of other spinal neurons and propose that glycinergic signaling onto CoPAs acts as a corollary discharge signal for reflex inhibition during movement.

Keywords: AMPA receptors; corollary discharge; glycine receptors; reflex inhibition; sensory interneurons; spinal cord; spontaneous behavior; zebrafish.


Figures

FIGURE 1
FIGURE 1
Intrinsic properties of embryonic commissural primary ascending (CoPA) interneurons are similar to other spinal neurons. (A) Representative current injections showing single vs. burst firing of action potentials in CoPAs at 24 and 27 hours post-fertilization (hpf), respectively. Upper traces, current-clamp recording, lower traces, current steps. Note the reduction in action potential threshold at 27 hpf. (B) Quantification of instantaneous firing frequency (Hz) vs. current injection (pA) for CoPA and CoSA neurons in 26–28 hpf embryos (N = 9, 9) and CoPA neurons in 24–25 hpf embryos (N = 5). Inset shows the general morphology of these spinal neurons and the sensory RB neuron that contacts CoPAs. In the drawing, rostral is to the left, dorsal is up, dotted gray lines indicate somite boundaries, and dashed black lines indicate commissural axonal projections. (C) Box plot showing the similarity of firing frequencies between CoPAs, CoSAs, and MNs in 26–28 hpf embryos in response to a 32 pA step of depolarizing current (N = 9, 5, 9; p > 0.05 for all pairwise comparisons). (D) Box plot showing the input resistances for the same classes of neurons as in (C). (N = 9, 7, 9; p > 0.05 for all pairwise comparisons).
FIGURE 2
FIGURE 2
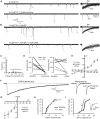
Embryonic CoPAs show spontaneous activity in the form of a long-lasting depolarization that has low strychnine sensitivity and shunts excitation. (A) Large upper trace, representative example of a whole-cell current-clamp recording of a spontaneous depolarizing event in a CoPA interneuron from a 24 hpf embryo that often triggered a small action potential at the onset. Baseline is shown as a dashed gray line for reference and resting membrane potential is –60 ± 5 mV in this and all subsequent current-clamp recordings. Inset upper right, example of a spontaneous depolarizing event in the same neuron that does not produce an action potential (scaled to 50%). Lower trace, a spontaneous depolarizing event recorded from an older 27 hpf embryo. (B) A significant positive correlation was found between embryonic age and the duration of depolarizing events in CoPAs. Pearson’s correlation coefficient r = 0.49 (p < 0.05; N = 25). The best linear fit is shown as a gray dashed line. (C) Representative whole-cell voltage-clamp recording from a CoPA neuron showing that the spontaneous currents are reversed at less negative holding potentials (–20 mV) compared to baseline (–65 mV) and that the net current is zero at –34 mV, the approximate chloride reversal potential. Timescale same as in (A).(D) Average peak currents (not including initial spike) for CoPAs at three different holding potentials (N = 4). (E) Line graph showing that spontaneous depolarizing events do not change in duration (black lines) or frequency (gray lines) following addition of 1 μM strychnine (p > 0.05; N = 3). (F) Middle trace, a four-minute excerpt of a current-clamp recording of spontaneous CoPA activity in a 27.5 hpf embryo showing how 10 μM strychnine washing into the extracellular solution eliminates all spontaneous depolarizations over the course of several minutes. Events in dashed boxes i–iii are shown on an expanded timescale for clarity. Scale for i–iii same as in (A). (G) Line graph showing that spontaneous depolarizing events are maintained in 1 μM strychnine (black lines; p > 0.05; N = 3) but completely lost in 10 μM strychnine (gray lines; ∗∗∗p < 0.001; Student’s t-test for each neuron pre- and post-drug application; N = 3). (H) An example of an injection of positive current in a CoPA from a 27 hpf embryo that normally results in sustained action potential firing at baseline (beginning and end of trace) but fails to elicit any action potentials during a spontaneous depolarizing event (middle of trace). Scale for upper trace same as in (A), scale for current injection is shown. The measure of latency used for the subsequent is indicated. (I) Scatterplot of the reduction in firing frequency as a percentage of baseline when a positive current injection arrives during a spontaneous depolarizing event at various delays. N = 11 events from five embryos.
FIGURE 3
FIGURE 3
Embryonic CoPAs have slow glycinergic miniature post-synaptic currents (mPSCs). (A) Representative excerpt of a whole-cell voltage-clamp recording from a CoPA interneuron in a 29 hpf embryo showing the presence of two distinct categories of mPSCs in the presence of 0.75 μM tetrodotoxin (TTX) alone (upper trace, left) labeled “s” and “f” to denote slow and fast events, respectively. Following the additional wash-in of 10 μM strychnine (lower trace, left), slow events are lost but fast events remain, indicating that slow events are glycinergic. Insets at the right show the vertically scaled overlay of all events from the recording excerpt at the left on an expanded timescale. (B) Representative excerpt of a whole-cell voltage-clamp recording of mPSCs from a CoPA interneuron in a 28 hpf embryo in the presence of 0.9 μM TTX and 2 μM (2R)-amino-5-phosphonovaleric acid (APV; upper trace) with events labeled as in (A). Following the additional wash-in of 10 μM CNQX (lower trace), fast events are lost but slow events remain, indicating that fast events are glutamatergic. Scale for traces and inset same as for (A). (C) Frequency histogram of the first 50 events from the recording in TTX only in (A) showing a clear bimodal distribution of the decay time constants for mPSCs. (D) Left, line graph showing that the frequency of slow glycinergic mPSCs (black lines) is abolished with 10 μM strychnine (∗∗∗p < 0.001; for comparison of mini frequency from each neuron pre- and post-drug application) while fast glutamatergic mPSCs (gray lines) are unaffected (p > 0.20; N = 3). Right, line graph showing that fast mPSCs are abolished with 10 μM CNQX (∗∗∗p < 0.001; for comparison of mini frequency from each neuron pre- and post-drug application) while slow mPSC frequency is unaffected (p > 0.20; N = 3). (E) I–V curve of the average peak amplitude for glycinergic mPSCs as a function of membrane holding potential. (F) Representative example of an averaged glycinergic mPSC from a recording in a CoPA (left trace, N = 19 events), a motoneuron (middle trace, N = 30 events), and a CoSA neuron (right trace, N = 13 events) in a 29 hpf embryo in the presence of 1 μM TTX and 0.7 μM CNQX. See Table 1 for quantification of mPSC properties. (G) I–V curve of the average peak amplitude for AMPAergic mPSCs as a function of membrane holding potential. See Table 2 for quantification of mEPSC properties. (H) Cumulative histogram of AMPAergic mEPSC amplitudes at baseline (black trace) and following 10 μM PhTX treatment (gray trace; p > 0.05; N = 3). (I) Cumulative histogram of evoked AMPAergic EPSC amplitudes at baseline (black trace) and following 20 μM PhTX treatment (gray trace; p < 0.05; Kolmorgorov-Smirnov test for distributions pre- and post-drug application; N = 3). Inset, overlay of averaged evoked AMPAergic EPSCs from one recording.
FIGURE 4
FIGURE 4
Embryonic CoPAs are inactive during fictive ipsilateral coils and are depolarized by glycinergic inputs during fictive contralateral coils. (A) Image of filled neurons from a simultaneous whole-cell recording of a CoPA and ipsilateral MN. The upper image shows the filled cell bodies in fluorescence against the spinal cord in brightfield. The lower image shows the inverted fluorescent image of rhodamine-filled ipsilateral cell bodies with the ascending contralateral CoPA axon in focus spanning several somites (the ventral MN axon is obscured by the recording electrode). Rostral is to the left and dorsal is to the top. (B) Simultaneous whole-cell recordings from a 26 hpf embryo of activity in a CoPA (current clamp, top trace in all pairs) and a MN (voltage-clamp, bottom trace in all pairs) during a spontaneous fictive ipsilateral single coil. The CoPA is inactive during a gap junction-driven current (periodic inward current, PIC) in the ipsilateral MN. Holding potential of MN was –65 mV and baseline is shown as a dotted gray line. Arrowheads in MN trace denote large glutamatergic peaks. (C) Depolarizing glycinergic events in CoPAs coincide with glycinergic synaptic bursts (SBs) in ipsilateral MNs during a spontaneous fictive contralateral single coil. Scale same as in (B) but note different vertical scale for MN trace. A vertical dashed line marks the end of the SB in the MN trace. (D) A depolarizing glycinergic event in a CoPA during a spontaneous fictive double coil (synaptic burst, SB, followed by PIC) in a MN resembles the activity seen during a single coil and coincides with the glycinergic portion of the mixed event in the MN. Scale same as in (C) but note different time scale. (E) Same conditions as (D) but here for a fictive double coil beginning on the ipsilateral side (PIC preceding SB). All recordings are from the same pair of neurons pictured in (A). (F) Comparison of the average change in membrane potential for CoPAs during each type of activity in the MN (∗∗∗p < 0.001; Mann-Whitney U-test for each neuron between event types).
FIGURE 5
FIGURE 5
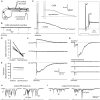
EmbryonicCoPAs receive brief glutamatergic excitation then long lasting, shunting glycinergic inputs in response to touch. (A) Cartoon depicting the experimental set-up for recording touch-evoked responses. (B) Representative cell-attached recording of single spikes consistently elicited in CoPAs (upper trace) in response to touch stimuli (lower trace). No spontaneous spikes were seen in the absence of stimuli. N = 3. (C) Representative current-clamp recordings of a spontaneous event (upper trace, gray) and an evoked event (middle trace, black, and lower stimulus trace, gray) in a 26.5 hpf embryo. Inset, expanded view of the overlapping traces to show the presence of a large amplitude action potential (e*) occurring in the evoked event only and a second smaller action potential (s#) occurring in both events. (D) Comparison of the average overshoot reached by the first spike in an evoked vs. spontaneous event (∗∗∗p < 0.001; Student’s t-test for each neuron between event types). (E) Comparison of the average peak slow depolarization during an evoked vs. spontaneous event (p > 0.20). (F) Voltage-clamp recording from the same neuron as in C showing that the evoked response is mediated by two different synaptic inputs: a short-latency glutamatergic EPSP that decreases in amplitude at less negative holding potentials (–20 mV) but does not reverse, and a later, long duration glycinergic input that reverses beyond –34 mV. (G) Voltage-clamp CoPA recording from a 26 hpf embryo showing that the wash-in in 10 μM strychnine selectively blocks the glycinergic currents but leaves the short latency, fast glutamatergic currents unaffected. Scale same as for (F). (H,I) Voltage-clamp recordings of synaptic currents in a motoneuron (H) and a CoSA (I) evoked by an ipsilateral touch stimuli in a 27.5 hpf embryo. Scale same as in (F). Glycinergic synaptic bursts are labeled SB and coincident electrical PICs and glutamatergic currents are labeled PIC/glut.
FIGURE 6
FIGURE 6
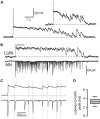
Commissural primary ascending interneurons receive rhythmic inhibition in phase with excitation to ipsilateral MNs during burst swimming episodes. (A) Two examples of activity patterns in CoPAs from embryos at 27–29 hpf that have longer durations than fictive coiling events and whose durations resemble those of bouts of immature swimming at this age. (B) Example of a simultaneous whole-cell recording from a 29 hpf embryo of activity in a CoPA (in current clamp) and an ipsilateral motoneuron (in voltage-clamp) during a spontaneous bout of fictive burst swimming. Scale for CoPA trace same as for (A), vertical scale shown for MN trace. (C) Ten times horizontally expanded view of the burst from the indicated region in (B). Dotted vertical lines indicate local maxima (peaks) in the CoPA trace that correlate with MN peaks. (D) Quantification of the latency between peaks in the CoPA trace relative to peaks in the MN trace. N = 20 peaks from one event.

Similar articles

Cited by

References

    1. Aizenman C. D., Mu noz-Elías G., Cline H. T. (2002). Visually driven modulation of glutamatergic synaptic transmission is mediated by the regulation of intracellular polyamines. Neuron 34 623–634 10.1016/S0896-6273(02)00674-8 - DOI - PubMed
    1. Ali D. W., Buss R. R., Drapeau P. (2000a). Properties of miniature glutamatergic EPSCs in neurons of the locomotor regions of the developing zebrafish. J. Neurophysiol. 83 181–191 - PubMed
    1. Ali D. W., Drapeau P., Legendre P. (2000b). Development of spontaneous glycinergic currents in the Mauthner neuron of the zebrafish embryo. J. Neurophysiol. 84 1726–1736 - PubMed
    1. Becker C. M., Hoch W., Betz H. (1988). Glycine receptor heterogeneity in rat spinal cord during postnatal development. EMBO J. 7 3717–3726 - PMC - PubMed
    1. Ben-Ari Y. (2002). Excitatory actions of GABA during development: the nature of the nurture. Nat. Rev. Neurosci. 3 728–739 10.1038/nrn920 - DOI - PubMed

Publication types

MeSH terms

LinkOut - more resources