. 2015 May 1;38(5):815-28.
doi: 10.5665/sleep.4682.

Unsupervised online classifier in sleep scoring for sleep deprivation studies

Affiliations

Unsupervised online classifier in sleep scoring for sleep deprivation studies

Paul-Antoine Libourel et al. Sleep. .

Abstract

Study objective: This study was designed to evaluate an unsupervised adaptive algorithm for real-time detection of sleep and wake states in rodents.

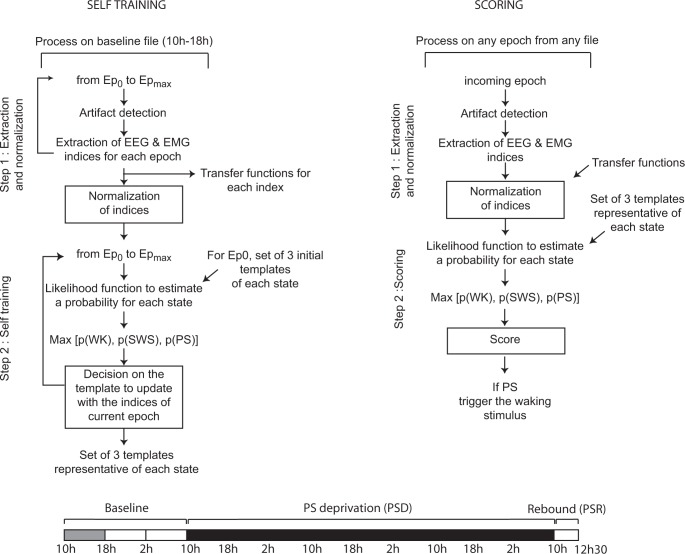
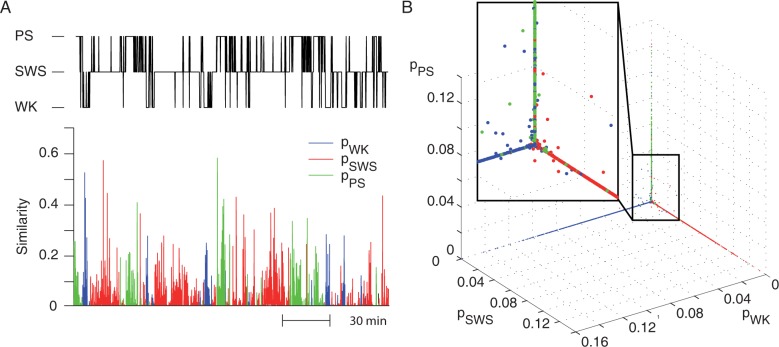
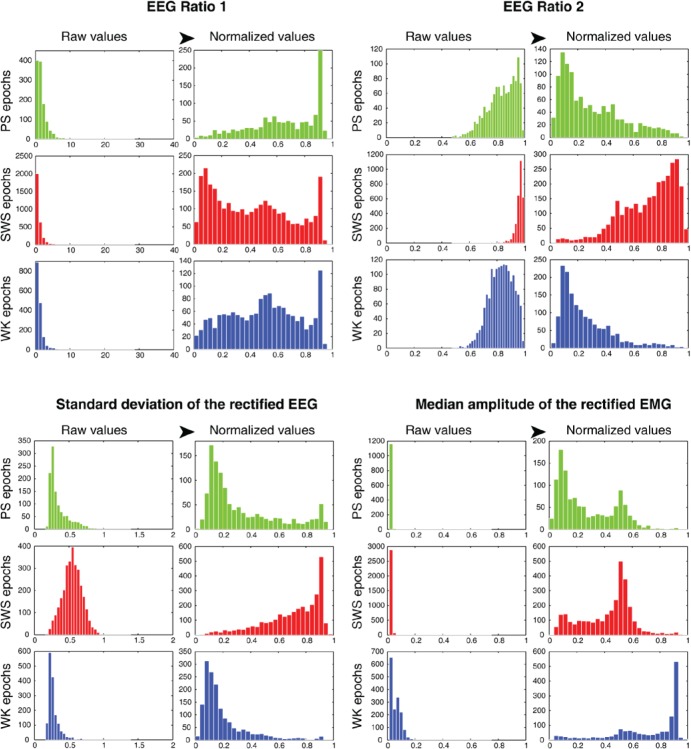
Design: We designed a Bayesian classifier that automatically extracts electroencephalogram (EEG) and electromyogram (EMG) features and categorizes non-overlapping 5-s epochs into one of the three major sleep and wake states without any human supervision. This sleep-scoring algorithm is coupled online with a new device to perform selective paradoxical sleep deprivation (PSD).

Settings: Controlled laboratory settings for chronic polygraphic sleep recordings and selective PSD.

Participants: Ten adult Sprague-Dawley rats instrumented for chronic polysomnographic recordings.

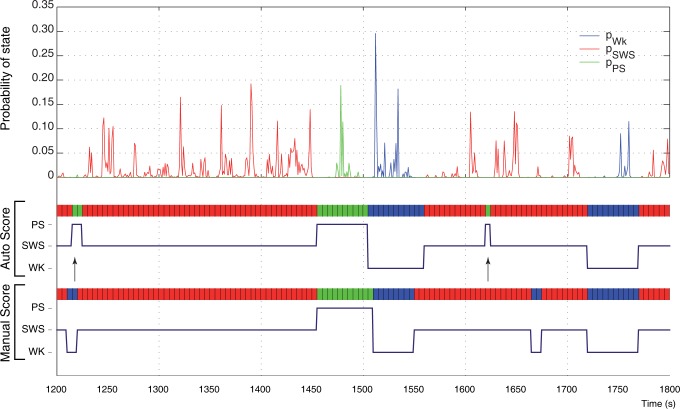
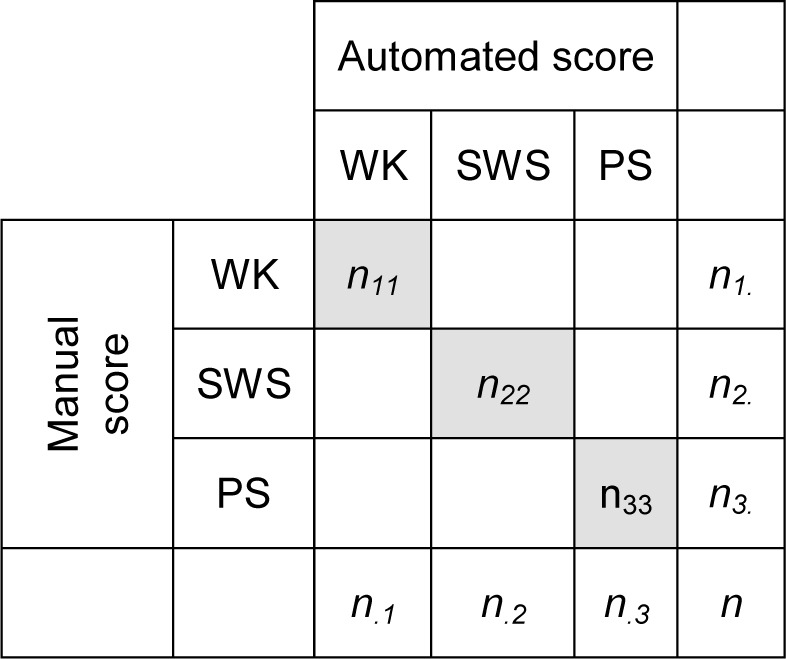
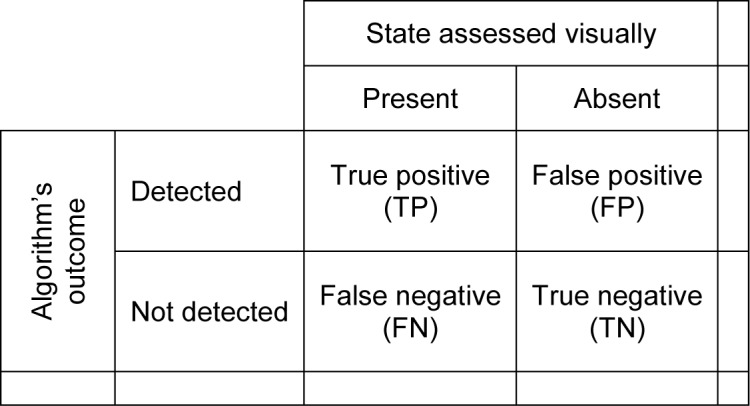
Measurements: The performance of the algorithm is evaluated by comparison with the score obtained by a human expert reader. Online detection of PS is then validated with a PSD protocol with duration of 72 hours.

Results: Our algorithm gave a high concordance with human scoring with an average κ coefficient > 70%. Notably, the specificity to detect PS reached 92%. Selective PSD using real-time detection of PS strongly reduced PS amounts, leaving only brief PS bouts necessary for the detection of PS in EEG and EMG signals (4.7 ± 0.7% over 72 h, versus 8.9 ± 0.5% in baseline), and was followed by a significant PS rebound (23.3 ± 3.3% over 150 minutes).

Conclusions: Our fully unsupervised data-driven algorithm overcomes some limitations of the other automated methods such as the selection of representative descriptors or threshold settings. When used online and coupled with our sleep deprivation device, it represents a better option for selective PSD than other methods like the tedious gentle handling or the platform method.

Keywords: automatic scoring; paradoxical sleep deprivation; sleep staging; unsupervised algorithm.


Figures

Figure 1
Figure 1
Block diagram of the algorithm. The self-training phase is done on a baseline file recorded between 10:00 18:00 (gray rectangle in the timeline at the bottom). The first step of this phase performs the extraction of the 5 indices over 5 s from the first to the last epoch (Ep0 to Epmax), establishes their distribution, and computes the normalization of these cumulative distributions by a piecewise cubic Hermite polynomial fitting of the quantiles. The transfer functions generated to normalize the indices are exported in a text file for use in the real time scoring and PS deprivation. The second step, self-training, starts with a set of indices with a mean initially set to either 0.9 (high) or 0.1 (low), based on the a priori knowledge of their high or low level for a given state. The standard deviation for each index is initially set to 1. The state templates are incrementally updated with the values of individual epochs after the calculation of a probability of each state by way of a likelihood function. The maximal probability among the probability of WK, SWS, and PS sets the state template to be updated if the maximal probability is higher than 0.1 and at least 10 times higher than the others. At the end of the training phase, state templates are saved and exported in a text file. The scoring phase is done in real time for the PS deprivation (black rectangles in the timeline). During this phase and for every incoming epoch, the same processes as those described in the training phase are carried out. The main differences are that the normalization is done from the transfer function generated during the training phase and the likelihood is evaluated from the templates obtain at the end of the training phase. The final score of the epoch under consideration is then obtained by taking the maximum of likelihood among WK, SWS, and PS probabilities.
Figure 2
Figure 2
Distribution of the five indices extracted from 5-s epochs as a function of state. Each index allows a distinction between one state and the 2 others. EEG power ratios 1 and 2 are obtained from fast Fourier transform (FFT). The standard error of the rectified EEG is an index of dispersion of the EEG that is lower during both WK and PS and high during SWS, and has therefore a distribution across states that is similar to the one of the EEG power ratio 2 (0.5–20Hz)/(0.5–55Hz). What can appear as a redundancy is, however, not detrimental to the distinction between SWS and activated states. Taken individually these 5 indices show distinct discriminative power, inversely related to the overlap of the distribution across states. Importantly, the one-dimensional overlap disappears when considering all indices in a 5-dimensional space.
Figure 3
Figure 3
Distribution of EEG zero-crossing values before and after the multinomial normalization. The histograms show the distribution of the raw (left side) and normalized (right side) zero crossing values observed in all epochs, and separately in PS, SWS, and WK epochs. The number and width of classes in the histograms are the same within a column. Note that numbers on the Y scales are different between states, reflecting their distinct prevalence.
Figure 4
Figure 4
Convergence of the five template values during the training phase. For each index, template values are initially set to either 0.1 (low) or 0.9 (high), with a standard deviation of 1. Subsequently, a probability is calculated for each state and the max likelihood is use to select which state template is updated. The average and standard deviation of the five indices are recalculated accordingly for that state. At the end of the training phase a 5-dimensional set of parameters is obtained for the 3 states. This process is adaptive in the sense that templates are updated with new data sample.
Figure 5
Figure 5
For each epoch and each state the likelihood function combined the probabilities calculated from the five indices in a single value. In terms of statistical inference, the result of the likelihood function is the probability that a given epoch belongs to the class WK, SWS, or PS, and thus reflected the similarity to the representative template of each state. Panel A illustrates the evolution of the 3 probabilities across time, and the hypnogram resulting from the decision rule based on the maximum likelihood. Even when the values of probabilities are low, all epochs are labeled with the state for which the likelihood value is maximal. Panel B shows the 3-dimensional distribution of the values of probabilities for each epoch. Each dot represents a single epoch with its probabilities to resemble to WK, SWS and PS as X, Y, and Z coordinates, and is color-coded with the state visually assigned. The great majority of dots are clustered along the axes, demonstrating the high concordance between the state manually assigned and the result of the selection based on the maximum probability. Note that the rare dots that appear misplaced (insert) have very low probability values.
Figure 6
Figure 6
Comparison of the score obtained with the algorithm and the ones obtained from a human expert. Sporadic differences are clearly visible on these color-coded hypnograms, with most of them coinciding with very low probabilities, i.e., high uncertainty. In this example PS is erroneously attributed to two consecutive epochs, manually scored as WK (first arrow), that correspond to a micro-arousal (activated EEG) without concomitant muscle activity. Similarly another epoch with a low amplitude EEG and very low EMG was detected as PS (second arrow). What can appear as an over detection of PS illustrates the originality of the method aimed at not missing any PS occurrence in the context of a selective PS deprivation.
None
None
None
None
None

References

    1. Robert C, Guilpin C, Limoge A. Automated sleep staging systems in rats. J Neurosci Methods. 1999;88:111–22. - PubMed
    1. Karasinski P, Stinus L, Robert C, Limoge A. Real-time sleep-wake scoring in the rat using a single EEG channel. Sleep. 1994;17:113–9. - PubMed
    1. Koley B, Dey D. An ensemble system for automatic sleep stage classification using single channel EEG signal. Comput Biol Med. 2012;42:1186–95. - PubMed
    1. Mendelson WB, Vaughn WJ, Walsh MJ, Wyatt RJ. A signal analysis approach to rat sleep scoring instrumentation. Waking Sleeping. 1980;4:1–8. - PubMed
    1. Gandolfo G, Glin L, Lacoste G, Rodi M, Gottesmann G. Automatic sleep-wake scoring in the rat on microcomputer APPLE II. Int J Biomed Comput. 1988;23:83–95. - PubMed

Publication types