. 2014 Dec;29(6):391-400.
doi: 10.1177/0748730414553029. Epub 2014 Oct 17.

Detecting rhythms in time series with RAIN

Affiliations

Detecting rhythms in time series with RAIN

Paul F Thaben et al. J Biol Rhythms. 2014 Dec.

Abstract

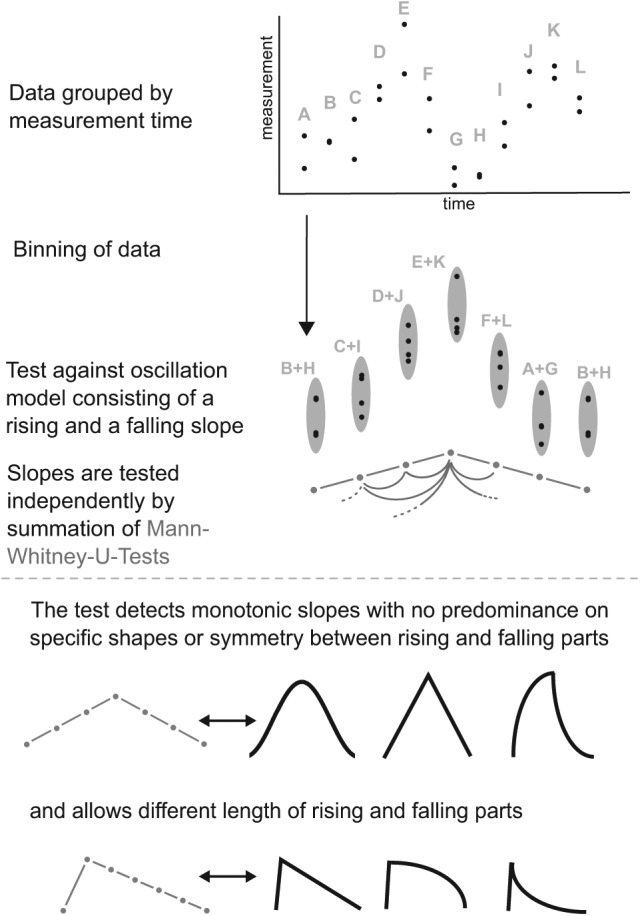
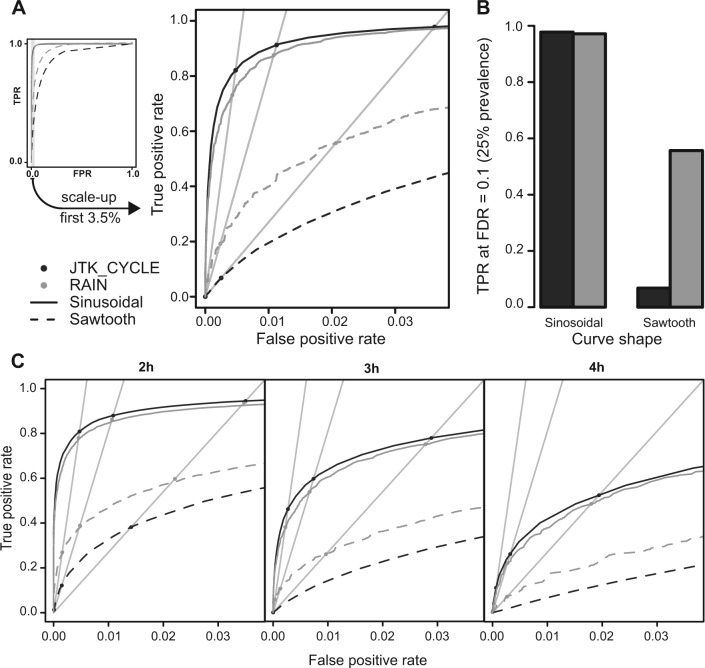
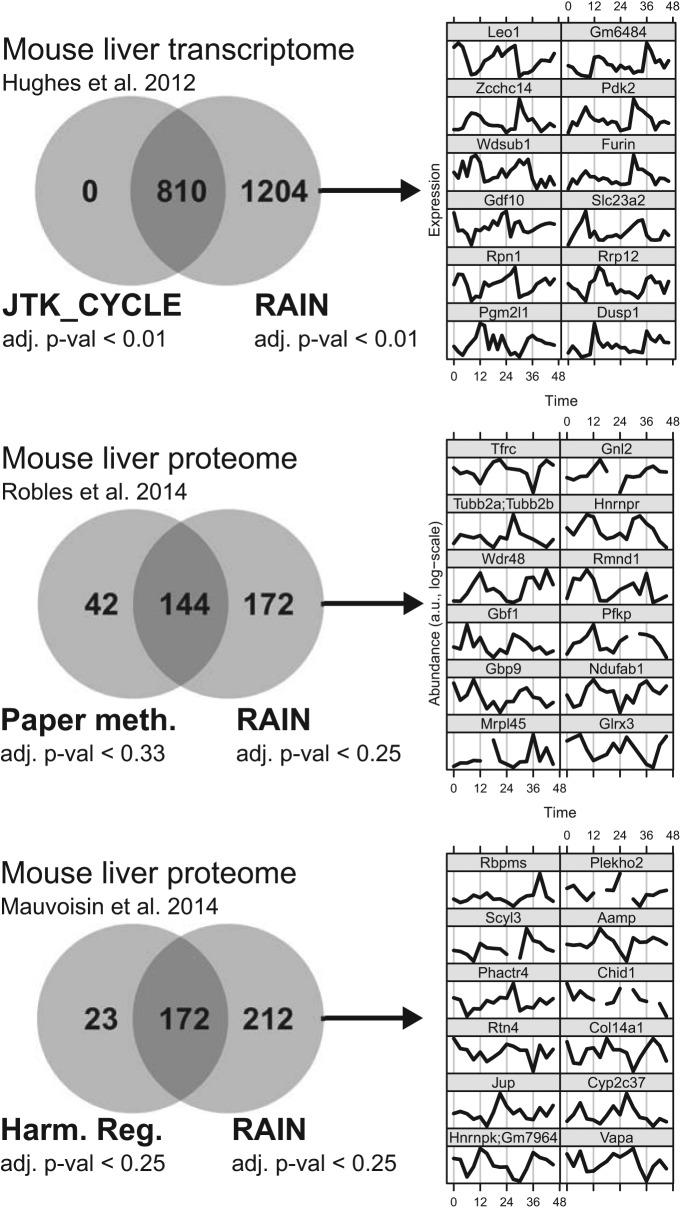
A fundamental problem in research on biological rhythms is that of detecting and assessing the significance of rhythms in large sets of data. Classic methods based on Fourier theory are often hampered by the complex and unpredictable characteristics of experimental and biological noise. Robust nonparametric methods are available but are limited to specific wave forms. We present RAIN, a robust nonparametric method for the detection of rhythms of prespecified periods in biological data that can detect arbitrary wave forms. When applied to measurements of the circadian transcriptome and proteome of mouse liver, the sets of transcripts and proteins with rhythmic abundances were significantly expanded due to the increased detection power, when we controlled for false discovery. Validation against independent data confirmed the quality of these results. The large expansion of the circadian mouse liver transcriptomes and proteomes reflected the prevalence of nonsymmetric wave forms and led to new conclusions about function. RAIN was implemented as a freely available software package for R/Bioconductor and is presently also available as a web interface.

Keywords: algorithm; biological oscillations; circadian; data analysis; gene expression; statistics.


Conflict of interest statement

Conflict of Interest Statement: The author(s) have no potential conflicts of interest with respect to the research, authorship, and/or publication of this article.

Figures

Figure 1.
Figure 1.
Description of RAIN. RAIN works by grouping measurements by time point (such as circadian or zeitgeber time). The ranks rather than the values are used, and groups are compared with each other against the alternative hypothesis of a rising pattern followed by a falling pattern. Only groups belonging to the same pattern (either rising or falling) are compared with each other. This releases many constraints on shape, allowing detection of, for example, “shark fin” wave forms. By cyclically reordering groups, and by further varying the umbrella peak location, further asymmetries and phases are tested against.
Figure 2.
Figure 2.
RAIN benchmarking. Synthetic data and ROC curves were used to assess the power and accuracy of RAIN compared with those of JTK_CYCLE. (A) ROC curve showing results for 100,000 sine curves and sawtooth-shaped curves, respectively, with an amplitude-to-noise ratio of 0.2 and sampled every 3 h for two full 24-h periods. The straight lines correspond to an FDR of 0.1 with (from steepest to least steep slope) prevalences of 5%, 10%, and 25%, or equivalently due to the symmetry of Equation 2, a prevalence of 10% and FDRs of 0.05, 0.1, and 0.25, respectively. True positive rates (TPRs) for these criteria can be read off the diagrams at the intersections between the straight lines and the ROC curves. (B) TPRs for FDR=0.1 and a prevalence of 25% (or vice versa). (C) Effect of different sampling rates. Here, amplitude-to-noise ratios were sampled from estimates coming from mouse liver microarray experiments (Methods and Suppl. Fig. S3). Thus, the result for a 3-h sampling interval is different from that depicted in panel A. Many more such panels are provided in Supplementary Figure S4.
Figure 3.
Figure 3.
Significantly expanded circadian transcriptomes and proteomes. With an FDR of 0.01, RAIN detects more than twice as many circadian transcripts in a mouse liver microarray data set (Hughes et al., 2012) as does JTK_CYCLE. Rhythms only detected by RAIN were validated using a control data set (Hughes et al., 2009) and an independent method (harmonic regression). The 12 transcripts with the lowest (adjusted) p-values that were only detected by RAIN under the FDR cutoff are shown and exhibit clear oscillations with asymmetric wave forms. Data from 2 studies using mass spectrometry to chart the mouse liver circadian proteome (Mauvoisin et al., 2014; Robles et al., 2014) were similarly analyzed, resulting in more than twice as many circadian proteins compared with the original studies.

References

    1. Benjamini Y, Hochberg Y. (2000) On the adaptive control of the false discovery rate in multiple testing with independent statistics. J Educ Behav Stat 25:60-83.
    1. Cornelissen G. (2014) Cosinor-based rhythmometry. Theor Biol Med Model 11:16. - PMC - PubMed
    1. Dai M, Wang P, Boyd AD, Kostov G, Athey B, Jones EG, Bunney WE, Myers RM, Speed TP, Akil H, et al. (2005) Evolving gene/transcript definitions significantly alter the interpretation of GeneChip data. Nucleic Acids Res 33:e175. - PMC - PubMed
    1. Futschik ME, Herzel H. (2008) Are we overestimating the number of cell-cycling genes? The impact of background models on time-series analysis. Bioinformatics 24:1063-1069. - PubMed
    1. Halberg F, Tong YL, Johnson EA. (1967) Circadian system phase—an aspect of temporal morphology; procedures and illustrative examples. In The Cellular Aspects of Biorhythms, von Mayersbach H, ed, pp 20-48. Berlin and Heidelberg: Springer.

Publication types