. 2014 Oct 17;3(11):1045-56.
doi: 10.1242/bio.201410165.

Nucleotide synthesis is regulated by cytoophidium formation during neurodevelopment and adaptive metabolism

Affiliations

Nucleotide synthesis is regulated by cytoophidium formation during neurodevelopment and adaptive metabolism

Gabriel N Aughey et al. Biol Open. .

Abstract

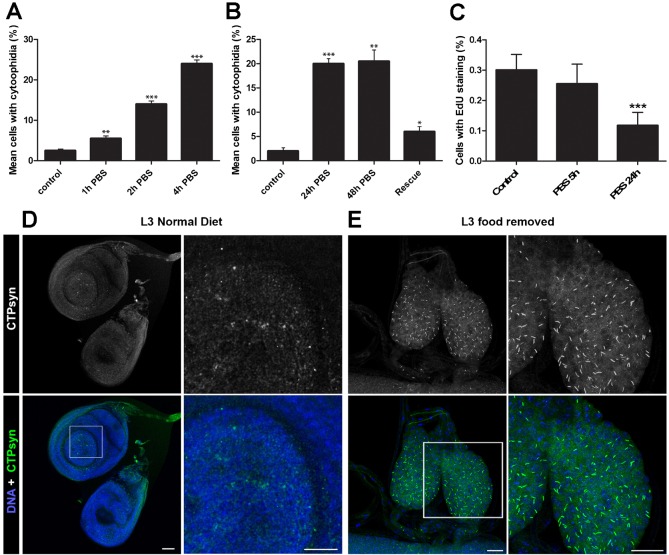
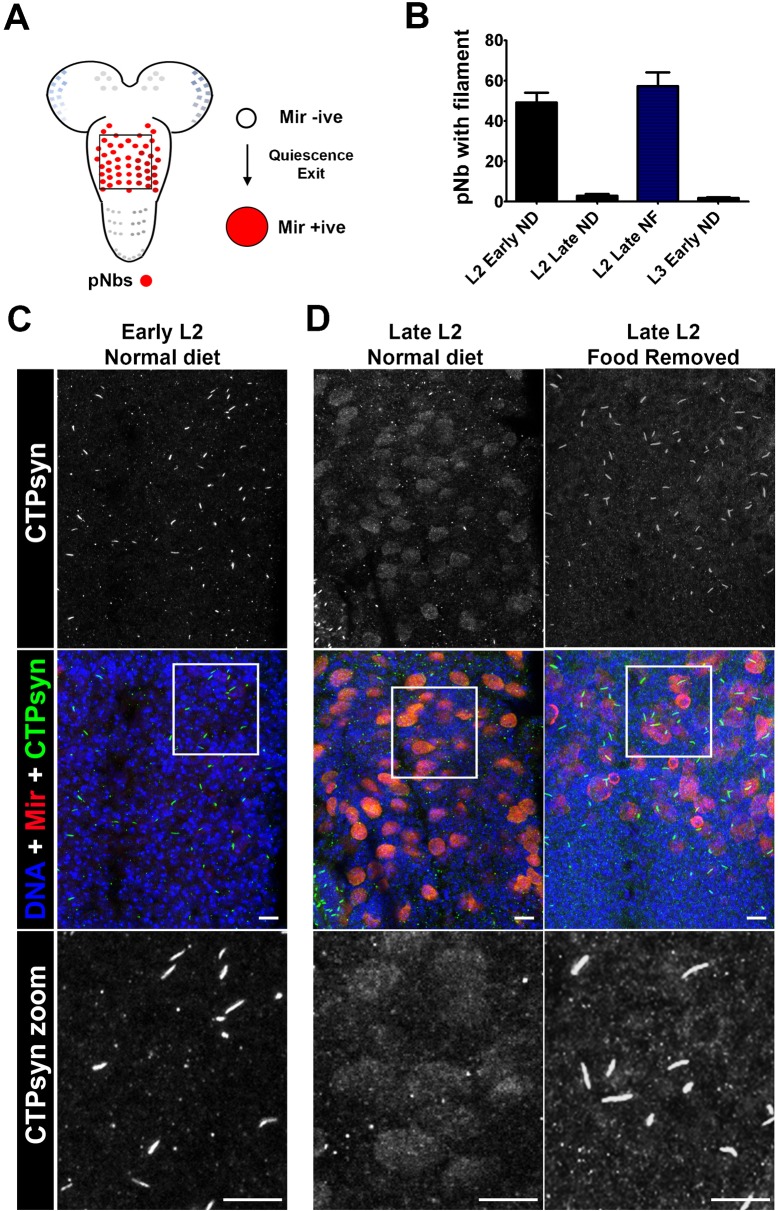
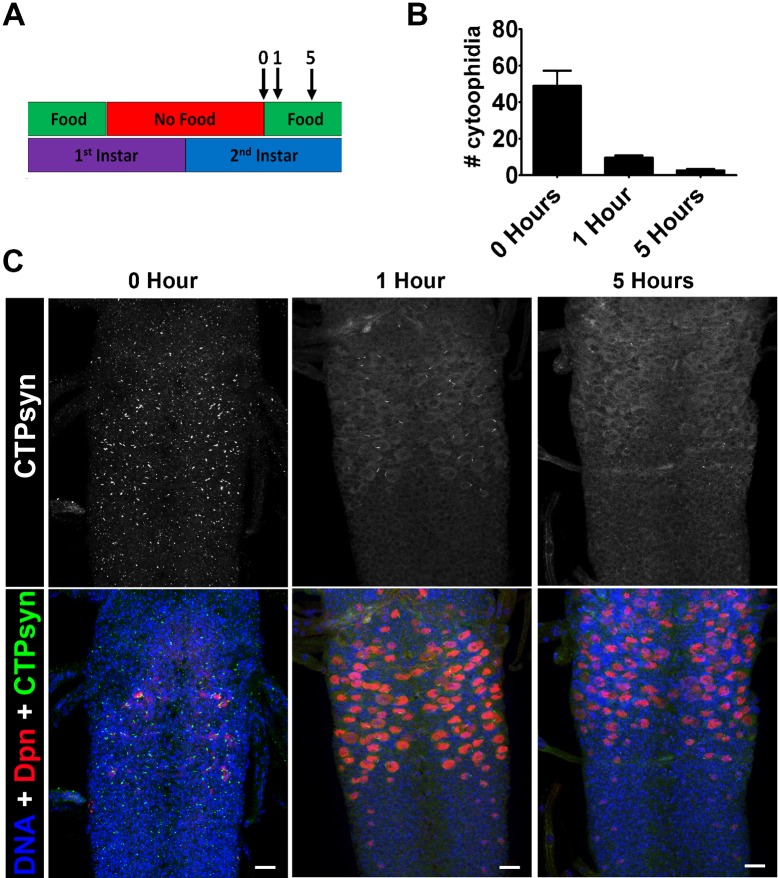
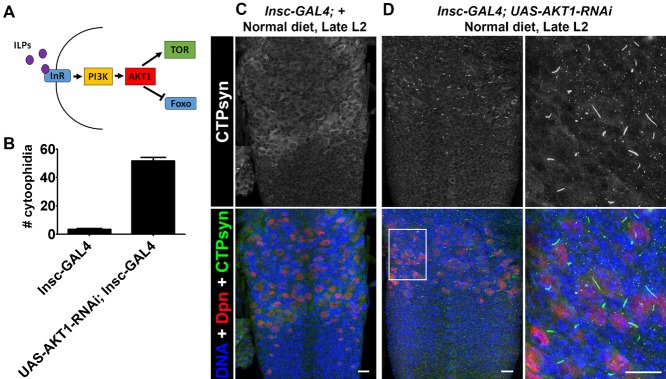
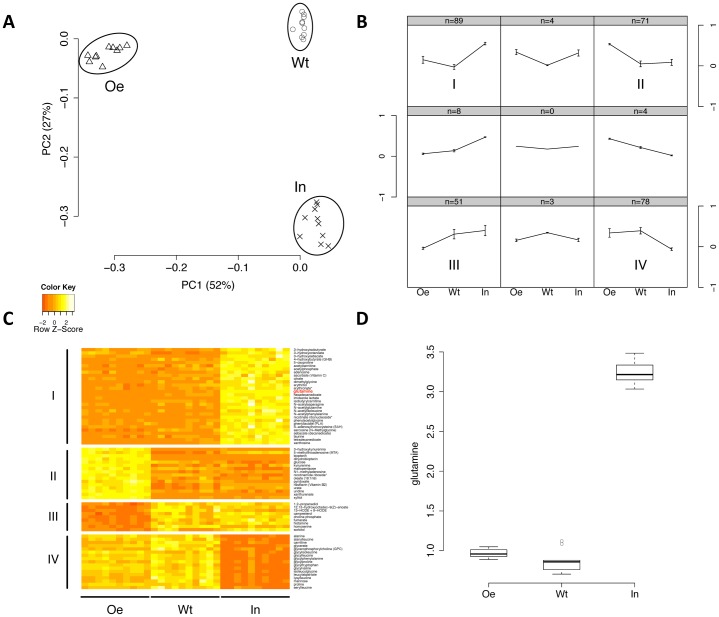
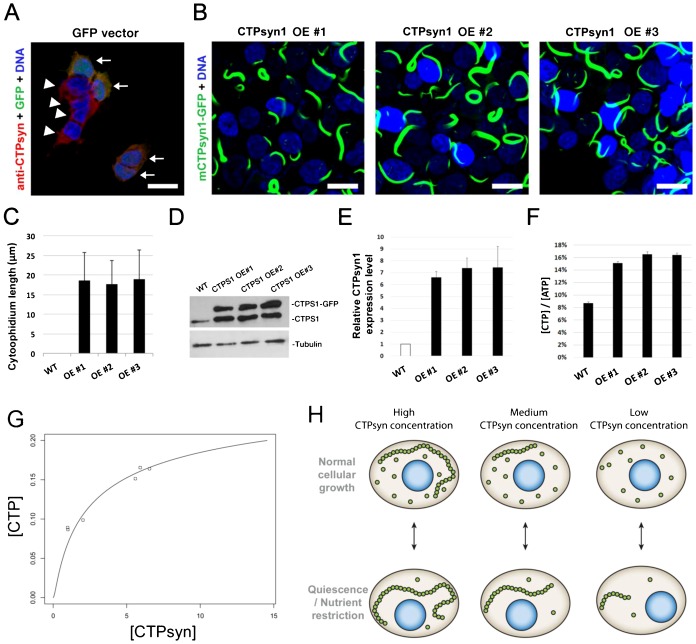
The essential metabolic enzyme CTP synthase (CTPsyn) can be compartmentalised to form an evolutionarily-conserved intracellular structure termed the cytoophidium. Recently, it has been demonstrated that the enzymatic activity of CTPsyn is attenuated by incorporation into cytoophidia in bacteria and yeast cells. Here we demonstrate that CTPsyn is regulated in a similar manner in Drosophila tissues in vivo. We show that cytoophidium formation occurs during nutrient deprivation in cultured cells, as well as in quiescent and starved neuroblasts of the Drosophila larval central nervous system. We also show that cytoophidia formation is reversible during neurogenesis, indicating that filament formation regulates pyrimidine synthesis in a normal developmental context. Furthermore, our global metabolic profiling demonstrates that CTPsyn overexpression does not significantly alter CTPsyn-related enzymatic activity, suggesting that cytoophidium formation facilitates metabolic stabilisation. In addition, we show that overexpression of CTPsyn only results in moderate increase of CTP pool in human stable cell lines. Together, our study provides experimental evidence, and a mathematical model, for the hypothesis that inactive CTPsyn is incorporated into cytoophidia.

Keywords: CTP; CTP synthase; Drosophila; cytoophidium; intracellular compartmentation; neurogenesis.


Conflict of interest statement

Competing interests: The authors declare that they have no conflict of interest.

Figures

Fig. 1.
Fig. 1.. Cytoophidium assembly occurs in response to nutrient stress.
(A) Mean number of cells containing visible cytoophidia increases in nutrient restricted cells. Significantly more cytoophidia are seen in S2R+ cells in PBS after just one hour. Control cells are maintained in complete Drosophila Schneider's medium. At least 100 cells were counted from ten sites per well from at least three independent replicates. (B) Cells with increased numbers of cytoophidia following nutrient restriction can be rescued by addition of whole media. Cells were examined two hours after re-introduction of whole media. (C) No significant change in EdU marked cells is observed after 5 hours, indicating that cell cycle arrest is not necessary for cytoophidia formation in S2 cells. (D) Response to nutrient restriction in imaginal disc tissue in vivo. Imaginal discs of L3 larvae display only diffuse cytoophidia when fed a normal diet. (E) In larvae raised on a nutrient restricted diet, the imaginal discs are smaller and cytoophidia are highly prevalent. Scale bars: 10 µm. ***P<0.001, **P<0.01, *P<0.05.
Fig. 2.
Fig. 2.. CTPsyn distribution in Drosophila larval post embryonic neuroblasts (pNbs).
(A) A schematic of the larval CNS showing the location of the pNbs. The box represents the section of the CNS represented in panels C and D. The majority of larval pNbs exit quiescence during the late L1 (1st instar) and early L2 (2nd instar) stages. This is characterised by pNb enlargement and the expression of markers such as Miranda (Mir). (B) Counts of pNbs containing cytoophidia in L2 early, L2 late and L3 larvae early reared under different feeding conditions (ND, normal diet; FR, food removed). n>10 animals per group. (C) CTPsyn localisation in early and late L2 when on a normal diet (see Materials and Methods). CTPsyn forms cytoophidia in quiescent pNbs (Mir negative). (D) As neuroblasts exit quiescence (late L2, normal diet) and begin to divide CTPsyn becomes diffuse. (E) CTPsyn localisation in late L2 when food is removed (late L2, food removed) after 24 hrs. CTPsyn aggregates into filaments when nutritional stresses are present. These images are representative of all 10 animals imaged. Scale bars: 10 µm.
Fig. 3.
Fig. 3.. Re-feeding starved larvae promotes cytoophidia disassembly.
(A) 1st instar larvae were starved for 1 day. Larvae were then transferred to food and the number of neuroblasts with cytoophidia were scored after 1 and 5 hours. (B) Re-feeding induces the dissociation of the cytoophidia in neuroblasts that accumulated during starvation. After 5 hours cytoophidia numbers are comparable with those seen in well fed L2 larvae. (C) Representative pictures CNS from larvae that have been re-fed for 0 hr, 1 hr and 5 hrs. These images are representative of >6 animals imaged. Scale bars: 10 µm.
Fig. 4.
Fig. 4.. AKT1 knockdown induces Cytoophida formation.
(A) When nutrients are available insulin-like peptides (ILPs) bind the insulin receptor (InR), activating the PI3K/AKT pathway. This in turn inhibits the growth inhibitor Foxo and activates TOR, leading to growth and division of cells, including neuroblasts. (B) AKT1 was knocked down in neuroblasts using Insc-GAL4, UAS-AKT1-RNAi to mimic nutritional stress. AKT1 knockdown induces cytophidia formation. (C) Insc-GAL4 controls displayed very few neuroblasts with cytophidia. (D) Cytophidia in Insc-GAL4, UAS-AKT1-RNAi neuroblasts. These images are representative of >6 animals imaged. Scale bars: 10 µm.
Fig. 5.
Fig. 5.. Global metabolomic profiling indicates negligible changes in CTPsyn activity in vivo.
(A) Principle component analysis shows that the samples of wild-type (Wt), CTPsyn inhibition (In), and CTPsyn overexpression (Oe) groups are clearly segregated. Two principal components (PC1 and PC2) are plotted and their proportions of variance are labeled. (B) The mean values of compounds in each state were normalized to (−1,1) and clustered into nine patterns by self-organizing mapping. The numbers of compounds in each pattern are showed on the top of the grids. The patterns that contain the most compounds are indicated by (I, II, III, V). (C) The heat map shows metabolites in major patterns that have significantly differential levels in three groups. Seventy-two metabolites in major patterns of (B) SOM (I, II, III, IV) were selected by one-way ANOVA with Bonferroni adjusted P<10−5. (D) The levels of glutamine in three groups are shown in the boxplot. Glutamine belongs to pattern I and is also colored in red in panel C.
Fig. 6.
Fig. 6.. CTPsyn, cytoophidia and CTP production.
(A) Cytoophidia are undetectable in wild-type and GFP vector transfected human 293T cells. (B) The mCTPsyn1-GFP proteins were stably expressed by CTPsyn1 OE#1, CTPsyn1 OE#2 and CTPsyn1 OE#3 cell lines. Almost every cell contains one or more cytoophidia. (C) Quantification of length of cytoophidia expressed by three independent cell lines. (D) Western blot of CTPsyn1 protein in wild-type, and mCTPsyn1-GFP expressing 293T cell lines. (E) Quantification of the relative protein abundance of endogenous CTPsyn1 and exogenous mCTPsyn1-GFP in CTPsyn1 OE#1, CTPsyn1 OE#2 and CTPsyn1 OE#3 cell lines. (F) The relative CTP concentration in cell lysates of wild-type, and three CTPsyn1 overexpression 293T cell lines. Overexpression of CTPsyn moderately increased intracellular CTP concentration in human cells. (G) The fitting of total CTPsyn and CTP concentration using the non-linear relationship derived from our mathematical model (see text). The x axis is total CTPsyn and y axis is CTP concentration. Data points represent experimentally measured values in wild type and CTPsyn overexpressing human 293T cells. (H) Proposed model of cytoophidia assembly in response to nutrient or developmental conditions. Scale bars: 20 µm.

Similar articles

Cited by

References

    1. An S., Kumar R., Sheets E. D., Benkovic S. J. (2008). Reversible compartmentalization of de novo purine biosynthetic complexes in living cells. Science 320, 103–106 10.1126/science.1152241 - DOI - PubMed
    1. Aronow B., Ullman B. (1987). In situ regulation of mammalian CTP synthetase by allosteric inhibition. J. Biol. Chem. 262, 5106–5112. - PubMed
    1. Azzam G., Liu J. L. (2013). Only one isoform of Drosophila melanogaster CTP synthase forms the cytoophidium. PLoS Genet. 9, e1003256 10.1371/journal.pgen.1003256 - DOI - PMC - PubMed
    1. Barry R. M., Bitbol A. F., Lorestani A., Charles E. J., Habrian C. H., Hansen J. M., Li H. J., Baldwin E. P., Wingreen N. S., Kollman J. M. et al. (2014). Large-scale filament formation inhibits the activity of CTP synthetase. eLife 3, e03638 10.7554/eLife.03638 - DOI - PMC - PubMed
    1. Beaty N. B., Lane M. D. (1983a). Kinetics of activation of acetyl-CoA carboxylase by citrate. Relationship to the rate of polymerization of the enzyme. J. Biol. Chem. 258, 13043–13050. - PubMed

LinkOut - more resources