. 2014 Dec;46(12):1293-302.
doi: 10.1038/ng.3120. Epub 2014 Oct 19.

Palindromic GOLGA8 core duplicons promote chromosome 15q13.3 microdeletion and evolutionary instability

Affiliations

Palindromic GOLGA8 core duplicons promote chromosome 15q13.3 microdeletion and evolutionary instability

Francesca Antonacci et al. Nat Genet. 2014 Dec.

Abstract

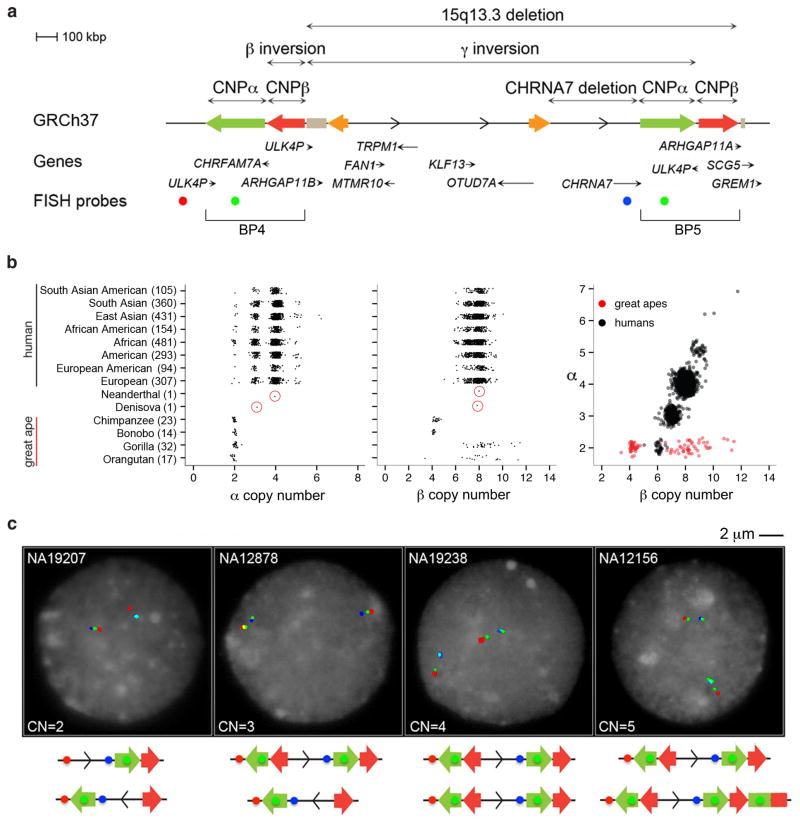
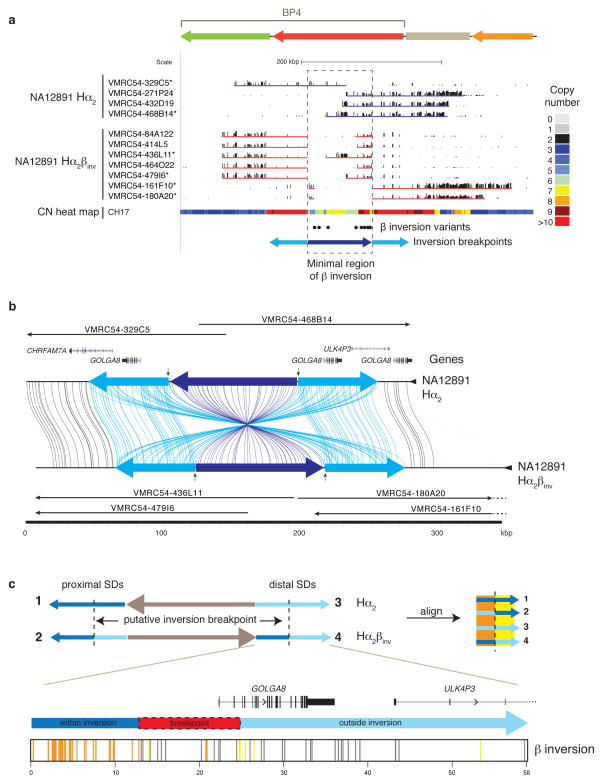
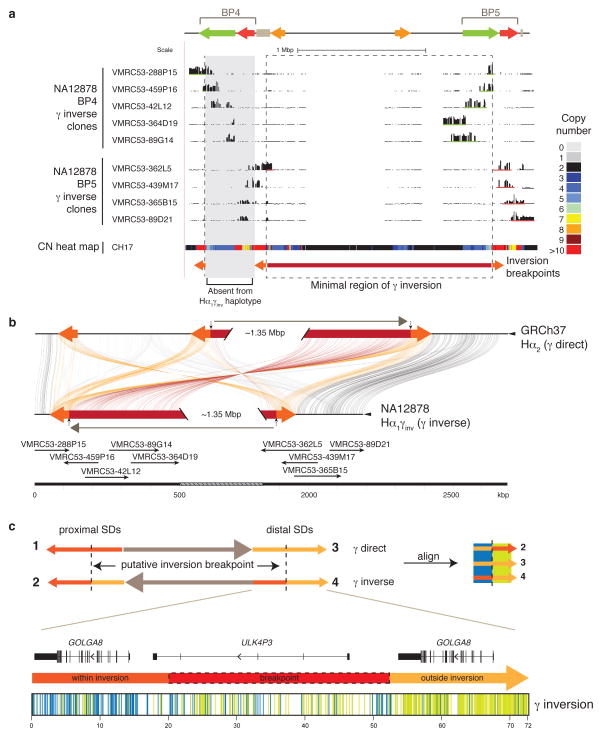
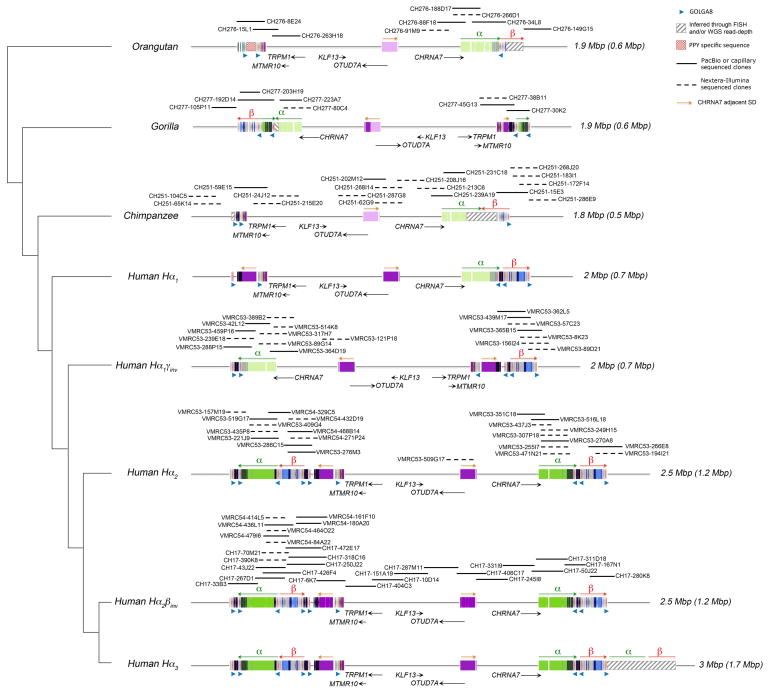
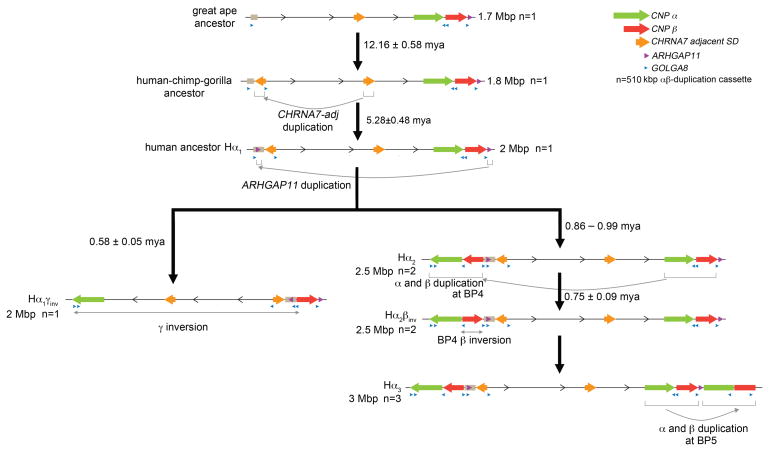
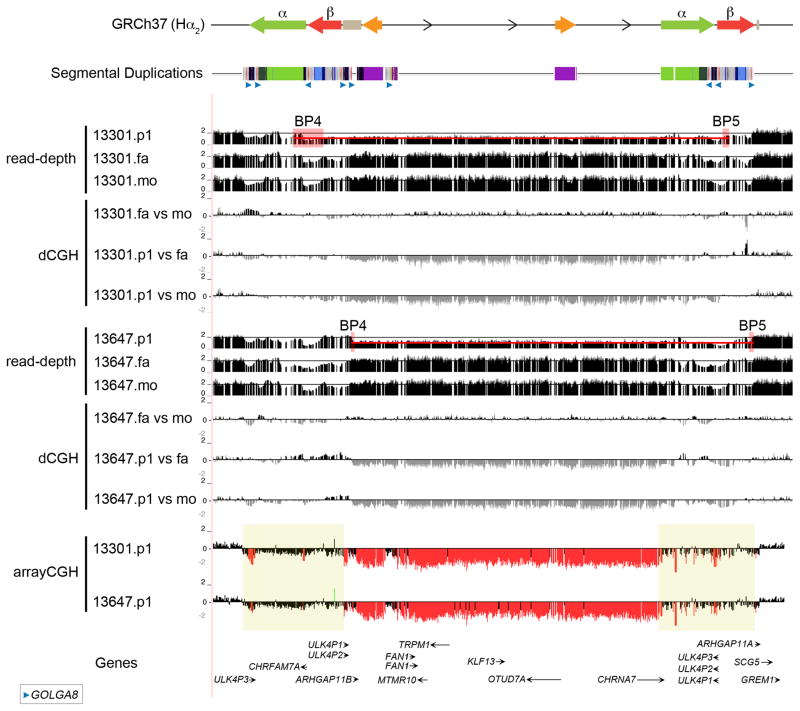
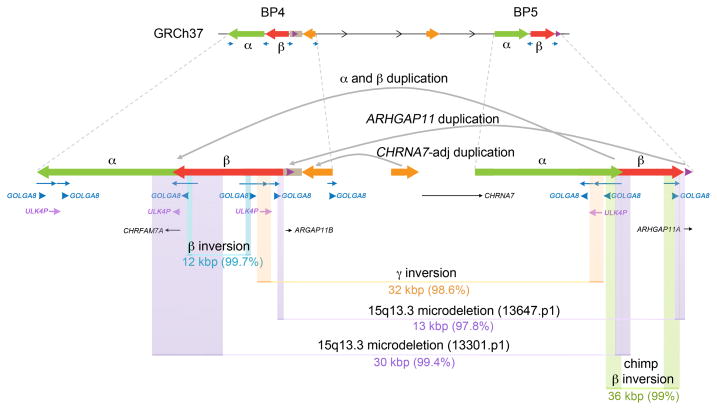
Recurrent deletions of chromosome 15q13.3 associate with intellectual disability, schizophrenia, autism and epilepsy. To gain insight into the instability of this region, we sequenced it in affected individuals, normal individuals and nonhuman primates. We discovered five structural configurations of the human chromosome 15q13.3 region ranging in size from 2 to 3 Mb. These configurations arose recently (∼0.5-0.9 million years ago) as a result of human-specific expansions of segmental duplications and two independent inversion events. All inversion breakpoints map near GOLGA8 core duplicons-a ∼14-kb primate-specific chromosome 15 repeat that became organized into larger palindromic structures. GOLGA8-flanked palindromes also demarcate the breakpoints of recurrent 15q13.3 microdeletions, the expansion of chromosome 15 segmental duplications in the human lineage and independent structural changes in apes. The significant clustering (P = 0.002) of breakpoints provides mechanistic evidence for the role of this core duplicon and its palindromic architecture in promoting the evolutionary and disease-related instability of chromosome 15.


Conflict of interest statement

COMPETING FINANCIAL INTERESTS

E.E.E. is on the scientific advisory board (SAB) of DNAnexus, Inc. and was an SAB member of Pacific Biosciences, Inc. (2009–2013) and SynapDx Corp. (2011–2013). J.A.R. is an employee of Signature Genomic Laboratories, a subsidiary of PerkinElmer, Inc. L.G.S. was an employee of Signature Genomic Laboratories and is now an employee of Genetic Veterinary Sciences, Inc.

Figures

Figure 1
Figure 1. 15q13.3 structural variation
(a) Different structural rearrangements at the 15q13.3 region include a 2 Mbp microdeletion between BP4 and BP5, a 430 kbp microdeletion involving the CHRNA7 gene, a 1.8 Mbp polymorphic inversion of the same region (γ inversion),,, two CNP SDs (CNPα and CNPβ) mapping at BP4 and BP5 of the 15q13.3 microdeletion, and a small inversion (β inversion) overlapping CNPβ at BP4. (b) Read-depth-based copy number estimates of CNPα and CNPβ in 2225 HapMap individuals from the 1000 Genome Project and 86 nonhuman ape, Neanderthal and Denisova genomes (circled in red). The number of individuals from each population is indicated in parentheses. A strong correlation (r=0.82, Pearson correlation which is significant using an F test) in copy number is observed between CNPα and CNPβ in humans but not apes. (c) FISH analysis using a probe mapping at CNPα (WIBR2-1388I24, green) and two probes mapping in the unique sequence (WIBR2-1462O20, red; WIBR2-3158E16, blue) shows a variable copy number between 0 and 1 at BP4 and between 0 and 2 at BP5.
Figure 2
Figure 2. Sequence refinement of β inversion breakpoints
(a) A 210 kbp β inversion was identified, validated, and sequenced using the VMRC54 BAC library (NA12891 individual). Illumina-generated sequences of clones spanning the BP4 CNPβ were mapped to human reference GRCh37. Clones sequenced using PacBio are indicated with asterisks. The copy number (CN) heat map shows the total diploid CN of a region in the CH17 hydatidiform mole cell line. The locations of the β inversion haplotype-tagging variants are pictured as dots. The blue arrows represent the BP4 CNPβ (dark blue) with the flanking 58 kbp inverted SDs (light blue). (b) Homologous sequences of clones, generated using PacBio and assembled into sequence contigs, are connected with colored lines between the direct (Hα2) and inverted (Hα2βinv) haplotypes from NA12891 using Miropeats. Vertical arrows indicate the minimal inversion breakpoints. (c) Homologous sequences (58 kbp) from the BP4 CNPβ flanking inverted SDs were aligned from multiple individuals (NA12891 and CH17) and haplotypes (β direct: SDs 1 and 3, and β inverse: SDs 2 and 4; see Supplementary Figure 5 for a more detailed alignment) and variant sites compared. Variant positions showing signatures of being within or outside of the β inversion breakpoints are indicated as colored lines under the picture of the distal β inverse SD including: within the inversion (orange; consensus of SDs 1 & 4 and SDs 2 & 3), outside the inversion (yellow; consensus of SDs 1 & 2 and SDs 3 & 4), and gene conversion (gray; consensus of SDs 1 & 3 and SDs 2& 4). The inversion breakpoint, refined to a region in which we observe a transition from orange to yellow lines, is highlighted with a dash-outlined red box.
Figure 3
Figure 3. Sequence refinement of γ inversion breakpoints
(a) The γ inversion was identified, validated, and sequenced using the VMRC53 BAC library (NA12878 individual). Illumina-generated sequences of clones spanning the 15q13.3 BP4 (green bars) and BP5 (red bars) loci were mapped to the human reference GRCh37. The nine clones pictured were sequenced using PacBio. The copy number (CN) heat map shows total diploid CN of a region in the CH17 hydatidiform mole cell line. The minimal region of the inversion spans ~1.8 Mbp (highlighted with a dashed box and a red bar). The orange arrows represent the flanking 72 kbp flanking inverted SDs that mediate the γ inversion. The Hα1γinv haplotype likely arose from the Hα1 haplotype, which does not harbor CNPα and CNPβ at BP4. (b) Homologous sequences of clones, generated using PacBio and assembled into contigs, and the human reference are connected with colored lines between γ direct (Hα2) and inverse (Hα1γinv) haplotypes using Miropeats. Vertical arrows indicate the minimal inversion breakpoints. (c) Homologous sequences (72 kbp) from the orange flanking inverted SDs were aligned from multiple individuals (NA12878, CH17, and GRCh37) and haplotypes (γ direct: SD 3, and γ inverse: SDs 2 and 4; see Supplementary Figure 9 for a more detailed alignment) and variant sites compared. Variant positions showing signatures of being within or outside of the γ inversion breakpoints are indicated as colored lines under the picture of the distal γ inverse SD including: within the inversion (blue; consensus of SDs 2 & 3), and outside the inversion (green; consensus of SDs 3 & 4). The inversion breakpoint, refined to a region in which we observe a transition from blue to green lines, is highlighted with a dash-lined red box.
Figure 4
Figure 4. Comparative sequence analysis of the 15q13.3 region among apes
The genomic structure is schematized within the context of a generally accepted phylogeny of orangutan, gorilla, chimpanzee and human. A tiling path of BAC clones was sequenced for each haplotype (dashed lines Illumina/solid lines PacBio or capillary finished sequence). A total of 66 BACs were completely sequenced and used to determine the SD organization (colored boxes). Colored boxes with lighter shades indicate segments that are single copy but duplicated in other species. Nonhuman primates lack most of the larger duplications (including CNPα and CNPβ) observed in humans but do carry ancestral GOLGA8 repeats. The region has expanded from 1.8–1.9 Mbp in nonhuman apes to 2–3 Mbp in humans as a result of SD accumulation (colored rectangles). The size of each haplotype is indicated on the right, with the size of the duplicated bases in parentheses. The addition of a polymorphic 500 kbp at BP4 occurred specifically in the human lineage, associated with an expansion of the GOLGA8 repeats at BP4 (CN=6 compared to CN=2 in human simpler haplotypes and nonhuman primates). Sequence and FISH data indicate that chimpanzee and orangutan were found to be in direct orientation while gorilla was found to be in inverse orientation for the γ inversion suggesting separate inversion events occurred at this locus across primate species.
Figure 5
Figure 5. Model of chromosomal 15q13.3 evolution
Based on comparisons to outgroup primates, we propose a simpler human ancestral organization (Hα1)—a configuration that is found enriched in contemporary African populations. A 510 kbp duplicative transposition from BP5 to BP4 (α and β duplications) occurred potentially in a palindromic configuration (Hα2), followed by an inversion of β at BP4 (Hα2βinv) between 700–900 thousand years ago. NAHR within BP5 leads to tandemization of the 510 kbp duplication (Hα3) and larger configurations primarily in East Asian populations. Approximately 500 thousand years ago, the 1.8 Mbp γ inversion independently rearranged to the Hα1γinv inverted haplotype.
Figure 6
Figure 6. 15q13.3 microdeletion breakpoints analysis
Array CGH data for two 15q13.3 microdeletion patient samples are mapped against the GRCh37 human reference. The microdeletion breakpoints map within a 500 kbp region (yellow boxes) where both α and β SDs are mapping. Digital comparative genomic hybridization (dCGH) was used to detect regions of gain or loss in probands (p1) compared to their parents (mo, mother; fa, father). The method measures differences in Illumina sequence read-depth compared to a reference genome to define sites of copy number variation. Paralog-specific read-depth analysis in each proband and their parents was performed at all sites where both parents had the expected copy number of 2. This allowed us to refine proband 13647.p1 breakpoints to a 13 kbp segment and proband 13301.p1 breakpoints to a 30 kbp between BP4 and BP5 (red boxes). The two probands have different breakpoints but in both cases the breakpoints map at or adjacent to the GOLGA8 repeats.
Figure 7
Figure 7. Summary of 15q13.3 rearrangements mediated by GOLGA8 repeats
Shown are eight independent rearrangements at the 15q13.3 region. Colored boxes indicate the breakpoints identified for each rearrangement (Supplementary Table 10). The size and the percent of similarity of the paralogous sequences at the rearrangement breakpoints are shown.

References

    1. Cooper GM, et al. A copy number variation morbidity map of developmental delay. Nat Genet. 2011;43:838–46. - PMC - PubMed
    1. Kaminsky EB, et al. An evidence-based approach to establish the functional and clinical significance of copy number variants in intellectual and developmental disabilities. Genetics in medicine: official journal of the American College of Medical Genetics. 2011;13:777–84. - PMC - PubMed
    1. Sharp AJ, et al. A recurrent 15q13.3 microdeletion syndrome associated with mental retardation and seizures. Nat Genet. 2008;40:322–8. - PMC - PubMed
    1. Helbig I, et al. 15q13.3 microdeletions increase risk of idiopathic generalized epilepsy. Nat Genet. 2009;41:160–2. - PMC - PubMed
    1. Consortium IS. Rare chromosomal deletions and duplications increase risk of schizophrenia. Nature. 2008;455:237–41. - PMC - PubMed

Publication types

MeSH terms

Supplementary concepts