. 2014 Dec;15(12):1116-25.
doi: 10.1038/ni.3023. Epub 2014 Oct 19.

Chitinase-like proteins promote IL-17-mediated neutrophilia in a tradeoff between nematode killing and host damage

Affiliations

Chitinase-like proteins promote IL-17-mediated neutrophilia in a tradeoff between nematode killing and host damage

Tara E Sutherland et al. Nat Immunol. 2014 Dec.

Abstract

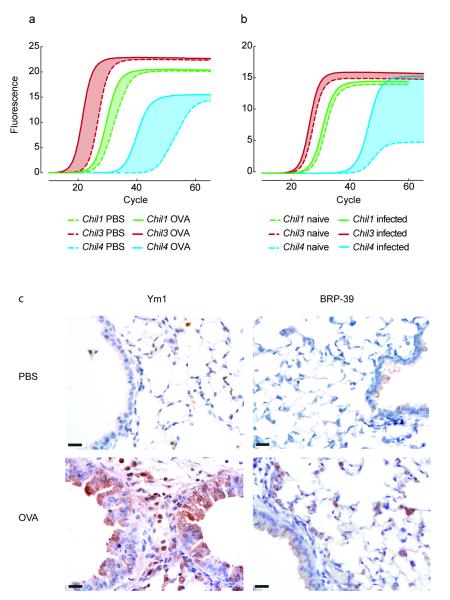
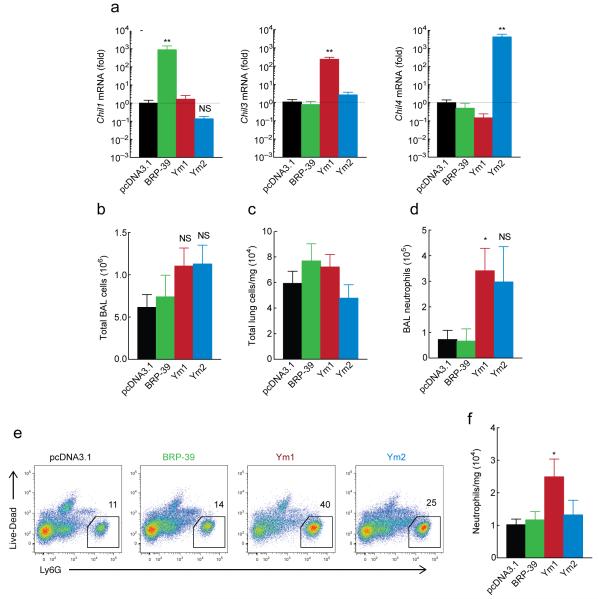
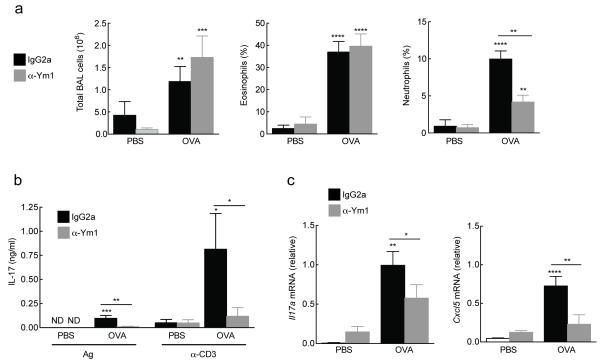
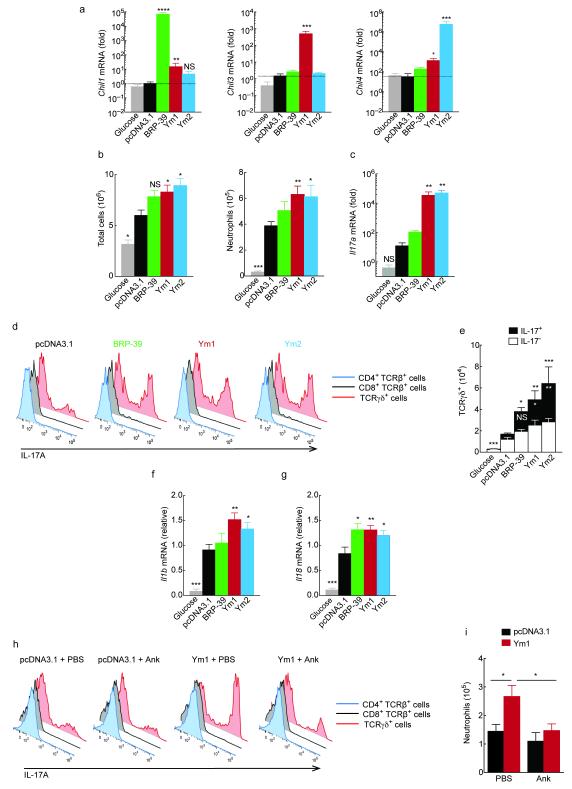
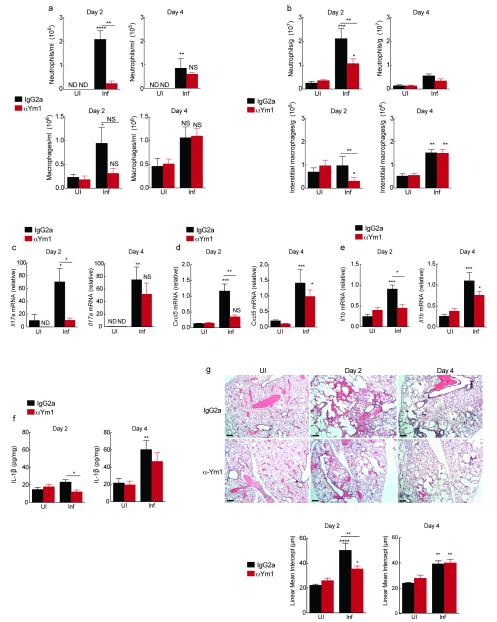
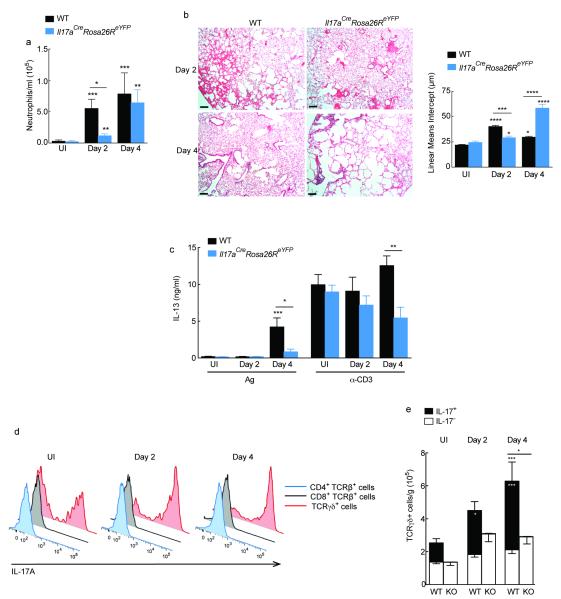
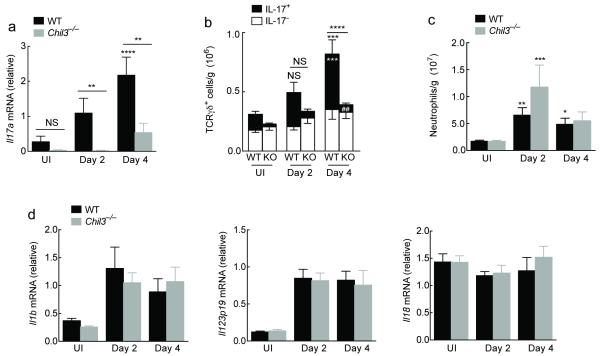
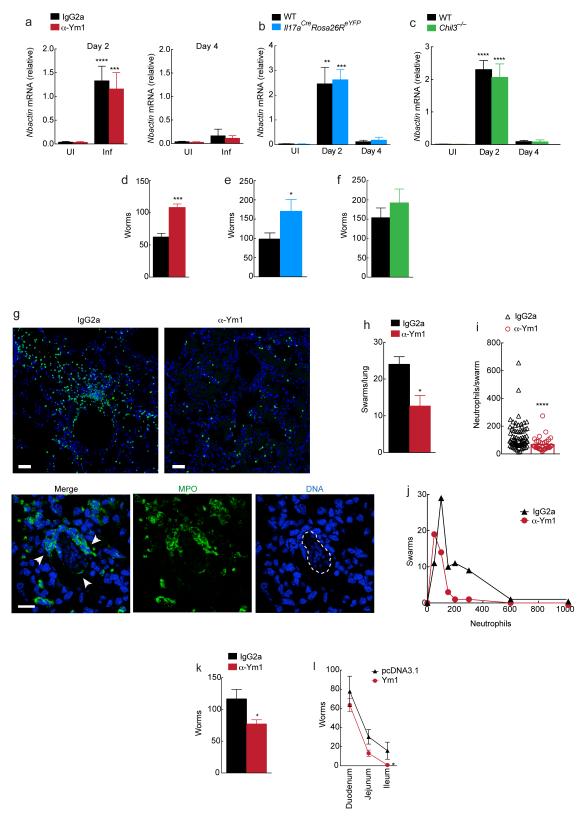
Enzymatically inactive chitinase-like proteins (CLPs) such as BRP-39, Ym1 and Ym2 are established markers of immune activation and pathology, yet their functions are essentially unknown. We found that Ym1 and Ym2 induced the accumulation of neutrophils through the expansion of γδ T cell populations that produced interleukin 17 (IL-17). While BRP-39 did not influence neutrophilia, it was required for IL-17 production in γδ T cells, which suggested that regulation of IL-17 is an inherent feature of mouse CLPs. Analysis of a nematode infection model, in which the parasite migrates through the lungs, revealed that the IL-17 and neutrophilic inflammation induced by Ym1 limited parasite survival but at the cost of enhanced lung injury. Our studies describe effector functions of CLPs consistent with innate host defense traits of the chitinase family.


Figures

Figure 1
Figure 1. The expression of CLPs in the lungs of mice
(a-b) mRNA amplification in lung tissue from PBS or OVA-challenged BALB/c mice (a) or uninfected or N. brasiliensis infected BALB/c mice (day 2 after infection) (b). Graphs show mean SYBR green fluorescence over cycle number with cycle number reflecting the relative abundance of the gene and the shaded area between the curves reflecting mean up-regulation of each gene. (c) Anti-Ym1 or anti-BRP-39 stained lung sections from PBS- or OVA-challenged mice. Scale bar, 20 μm. Data are representative of three independent experiments.
Figure 2
Figure 2. Over-expression of Ym1 in the lungs induces neutrophil accumulation
(a) Gene expression in total BAL cells from mice 48 h after intranasal transfection with 20 μg pcDNA3.1 or plasmids encoding BRP-39, Ym1 or Ym2, shown as the fold increase over pcDNA3.1. (b-c) Absolute number of total BAL cells (b) and total lung cells/mg tissue (c) from mice as in a. (d) Absolute numbers of BAL neutrophils as identified from DiffQuick stained cytospins from mice as in a. (e) Expression of Ly6G by single cell lung suspensions from mice as in a. Numbers above outlined area indicate percentages of Ly6G+ CD11b+ neutrophils. (f) Absolute numbers of neutrophils in the lungs of mice, normalized to lung weight as identified from mice as in e. *P <0.05, **P <0.0001 and NS not significant compared to pcDNA3.1 transfected mice (analysis of variance with (a) Tukey-Kramer HSD multiple comparison test or (b,d,f) Kruskal-Wallis post-hoc test). Data are pooled (a-d, f; mean ± s.e.m) or representative (e) from two individual experiments with five to nine mice per group.
Figure 3
Figure 3. Ym1 promotes OVA-induced neutrophilia and regulates IL-17A abundance
(a-c) Cells from BAL of PBS or OVA-challenged mice treated with IgG2a or anti-Ym1 (200 μg, i.p.). showing total numbers and percentage of eosinophils and neutrophils as calculated from DiffQuick stained cytospins. (b) IL-17A secreted from thoracic lymph node cells cultured with OVA antigen (Ag, 500 μg) or α-CD3 (1 μg/mL) from mice as in a. Data show IL-17A responses normalized to amount of IL-17A secreted in medium controls for each individual mouse. (c) Gene expression in lung tissue of mice as in a. ND, not detected. *P < 0.05, **P < 0.01, ***P < 0.001 and ****P < 0.0001 (analysis of variance with (a, d) Tukey-Kramer HSD multiple comparison test or (c) Kruskal-Wallis test). Data are pooled (a; mean ± s.e.m.) or representative (c, d; mean ± s.e.m.) from two independent experiments of eleven to twelve mice per group.
Figure 4
Figure 4. CLPs alter neutrophil recruitment in the peritoneal cavity
(a) Gene expression in PEC collected at 48 h from mice administered with pCDNA3.1, plasmids encoding BRP-39, Ym1 or Ym2 (20 μg) or glucose (i.p.). Data show fold change over pcDNA3.1. (b) Absolute numbers of viable cells and Ly6G+ Cd11b+ F4/80 neutrophils in PEC from mice as in a. (c) Relative gene expression in PEC from mice as in a. (d) Expression of IL-17A in PMA and ionomycin restimulated PEC from mice as in a. (e) Absolute number of IL-17 or IL-17+ TCRγδ cells from mice as in a. Statistics depicts significance of IL-17A+ γδ T cells in black, and total γδ T cells in white. (f-g) Relative gene expression in PEC from mice as in a. (h) Expression of IL-17A in PMA and ionomycin restimulated PEC from mice collected 48 h after intraperitoneal transfection with pcDNA3.1 or a plasmid encoding Ym1 and treated with 100 mg/kg anakinra (Ank) or PBS (i.p.). (i) Absolute numbers of neutrophils in PEC from mice as in h and analysed as in b. NS not significant; *P < 0.05; **P < 0.01; ***P < 0.001 and ****P < 0.0001 compared to pcDNA3.1 transfected mice (analysis of variance with Tukey-Kramer HSD multiple comparison test). Data are pooled from two independent experiments with eight to eleven mice per group (a-c, e-g; mean ± s.e.m) or are representative of two independent experiments with five to seven mice per group (d, h-i; mean ± s.e.m. in i).
Figure 5
Figure 5. Ym1 induced neutrophil recruitment contributes to acute lung injury following N. brasiliensis infection
(a) Absolute numbers of neutrophil and macrophages in BAL counted on Diffquick stained cytospins from BALB/c mice uninfected (UI) or infected (Inf) with 500 N. brasiliensis L3s (day 0) and treated with anti-Ym1 or IgG2a isotype (i.p., days −1 to 1) harvested at day 2 or 4 after infection. (b) Absolute numbers of Ly6G+ Cd11b+ F4/80 neutrophils and F4/80+ Cd11b+ CD11c interstitial macrophages per g of lung tissue from mice as in a. (c-e) Relative gene expression in lungs of mice as in a. (f) IL-1β per mg of total lung protein in lung homogenates from mice as in a. (g) H&E staining lung sections, scale bar: 200 μm. Graph shows lung damage calculated by the linear means intercept. ND not detected. NS not significant; *P < 0.05; **P < 0.01; ***P < 0.001 and ****P < 0.0001 compared to UI IgG2a or Inf IgG2a (analysis of variance with Tukey-Kramer HSD multiple comparison test). All data are representative from three individual experiments (mean ± SEM, six mice per group).
Figure 6
Figure 6. IL-17A production by γδ T cells contributes to N. brasiliensis mediated lung injury
(a) Absolute numbers of neutrophils in the BAL counted on DiffQuick stained cytospins from C57BL6 (WT) or homozygote Il17aCreRosa26ReYFP mice uninfected (UI) or infected with N. brasiliensis (500 L3s) harvested day 2 or 4 after infection. (b) H&E staining of lung sections from infected mice as in a; Scale bar: 200 μm. Graph shows lung damage calculated by the linear means intercept. (c) IL-13 secretion in splenocytes cultured with NES antigen (Ag; 1 μg/mL) or α-CD3 (1 μg/mL) from mice as in a. Data show Ag and α-CD3 specific responses normalized to the amount of IL-13 secreted in medium for individual mice. (d) Expression of IL-17A in PMA and ionomycin restimulated single cell lung suspensions from mice in a. (e) Absolute number of IL-17A or IL-17A+ TCRγδ+ cells uninfected or infected WT or Il17aCreRosa26ReYFP (KO) mice as in a. Statistics depicting significance of IL-17A+ γδ T cells in black, and total γδ T cells in white. NS not significant *P < 0.05; **P < 0.01; ***P < 0.001 and ****P < 0.0001 compared to UI WT or infected WT on day 2 or day 4 (analysis of variance with (a) Kruskal-Wallis or (b-e) Tukey-Kramer HSD multiple comparison test). Data are pooled (a-c, e; mean ± s.e.m.) or representative from two individual experiments of five to twelve mice per group.
Figure 7
Figure 7. BRP-39 regulates IL-17A production in γδ T cells within the lung
(a) Relative gene expression in lungs of uninfected (UI) or N. brasiliensis infected (500 L3s) C57BL6 (WT) or Chil1−/− mice at day 2 or 4 after infection. (b) Absolute number of IL-17 or IL-17+ γδ T cells following infection in WT or Chil1−/− (KO) mice as in a. Statistics depicting significance of IL-17A+ γδ T cells in black, and total γδ T cells in white. (c) Absolute numbers of Ly6G+ CD11b+ F4/80 neutrophils per gram of lung tissue in WT and Chil1−/− mice as in a. (d) Relative gene expression in lungs of mice as in a. NS not significant; *P < 0.05; **P < 0.01 and ***P < 0.001, compared to UI WT or infected WT on day 2 or day 4 (a-c) and ##P < 0.01 compared to infected WT on day 4 (c) (analysis of variance with Tukey-Kramer HSD multiple comparison test). Data are representative of two individual experiments with twelve to six mice per group (mean ± s.e.m.).
Figure 8
Figure 8. IL-17A and Ym1 limit worm burden
(a-c) Relative gene expression in whole lung tissue from uninfected (UI) or N. brasiliensis infected (Inf) (500 L3s) BALB/c wild-type treated with anti-Ym1 or IgG2a isotype (i.p., days -1 to 1) (a); C57BL6 (WT) or homozygote Il17aCreRosa26ReYFP(b); or C57BL6 (WT) or Chil1−/− mice (c) at day 2 or 4. (d-f) Larvae in the small intestine (day 4) in BALB/c mice (d) as in a; C57BL6 (WT) or homozygote Il17aCreRosa26ReYFP mice (e) as in b; C57BL6 (WT) or Chil1−/− mice (f) as in c. (g) Myeloperoxidase (MPO) and DAPI staining of lung sections from infected mice (day 2) as in a. White arrows, neutrophils; dotted line, N. brasiliensis larvae. Scale bar, 50 μm (top), 100 μm (bottom). (h-j) Lung sections from g analyzed for (h) neutrophil swarms per section, (i) neutrophils per swarm; and (j) distribution frequency of neutrophils within swarms. (k-l) Larvae (day 4) in the (k) small intestine and (l) sections of the intestine of BALB/c wild-type mice transfected intranasally with pcDNA3.1 or plasmid encoding Ym1 and infected with N. brasiliensis (500 L3s). *P < 0.05, **P < 0.01, ***P < 0.001 and ****P < 0.0001; (a-c i) analysis of variance with Tukey-Kramer HSD multiple comparison test; (d-f) unpaired t-test; (h & i) Wilcoxin non-parametric t-test. Data are representative of two independent experiments (a-f; six to eight mice per group, mean ± s.e.m.; k-l; nine mice per group, mean ± s.e.m.) or representative of one experiment with three mice per group (g; h-j; mean ± s.e.m.).

Comment in

References

    1. Sutherland TE, Maizels RM, Allen JE. Chitinases and chitinase-like proteins: potential therapeutic targets for the treatment of T-helper type 2 allergies. Clin. Exp. Allergy. 2009;39:943–955. - PubMed
    1. Labadaridis I, et al. Chitotriosidase in neonates with fungal and bacterial infections. Arch. Dis. Child Fetal Neonatal Ed. 2005;90:F531–532. - PMC - PubMed
    1. Barone R, et al. Plasma chitotriosidase activity in acute Plasmodium falciparum malaria. Clin. Chim. Acta. 2003;331:79–85. - PubMed
    1. Nance JP, et al. Chitinase dependent control of protozoan cyst burden in the brain. PLoS Pathog. 2012;8:e1002990. - PMC - PubMed
    1. Bussink AP, Speijer D, Aerts JM, Boot RG. Evolution of mammalian chitinase(-like) members of family 18 glycosyl hydrolases. Genetics. 2007;177:959–970. - PMC - PubMed

Publication types

MeSH terms