. 2014 Nov;20(11):1315-20.
doi: 10.1038/nm.3707. Epub 2014 Oct 19.

Megakaryocytes regulate hematopoietic stem cell quiescence through CXCL4 secretion

Affiliations

Megakaryocytes regulate hematopoietic stem cell quiescence through CXCL4 secretion

Ingmar Bruns et al. Nat Med. 2014 Nov.

Abstract

In the bone marrow, hematopoietic stem cells (HSCs) lodge in specialized microenvironments that tightly control the proliferative state of HSCs to adapt to the varying needs for replenishment of blood cells while also preventing HSC exhaustion. All putative niche cells suggested thus far have a nonhematopoietic origin. Thus, it remains unclear how feedback from mature cells is conveyed to HSCs to adjust their proliferation. Here we show that megakaryocytes (MKs) can directly regulate HSC pool size in mice. Three-dimensional whole-mount imaging revealed that endogenous HSCs are frequently located adjacent to MKs in a nonrandom fashion. Selective in vivo depletion of MKs resulted in specific loss of HSC quiescence and led to a marked expansion of functional HSCs. Gene expression analyses revealed that MKs are the source of chemokine C-X-C motif ligand 4 (CXCL4, also named platelet factor 4 or PF4) in the bone marrow, and we found that CXCL4 regulates HSC cell cycle activity. CXCL4 injection into mice resulted in a reduced number of HSCs because of their increased quiescence. By contrast, Cxcl4(-/-) mice exhibited an increased number of HSCs and increased HSC proliferation. Combined use of whole-mount imaging and computational modeling was highly suggestive of a megakaryocytic niche capable of independently influencing HSC maintenance by regulating quiescence. These results indicate that a terminally differentiated cell type derived from HSCs contributes to the HSC niche, directly regulating HSC behavior.


Figures

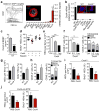
Figure 1
Figure 1. Spatial relationships between HSCs and megakaryocytes in the BM
(ac) Representative whole-mount images of mouse sternal BM. White arrowheads denote phenotypic Lin CD48 CD41 CD150+ HSCs. Mk are distinguished by their size, morphology and CD41 expression. Vascular endothelial cells are stained with antibodies against CD31 and CD144. (d,e) Percentages of HSCs in direct contact with a Mk (distance = 0 μm; Student's t-test *P < 0.05) (d) and distances between HSCs and Mk (e) in the sternal BM. Grey bars depict the mean distances between simulated randomly distributed HSCs and Mk and red bars depict actual mean distances between HSCs and Mk observed in situ. n = 252 HSCs. Two-sample Kolmogorov–Smirnov test; P = 1.6 × 10⁻¹⁰. (f) Probability distributions of mean distances from simulations of randomly positioned HSCs on maps of sternal BM in relation to Mk. Mean distances observed in situ (red line) are shown in relation to the grand mean +/− 2 s.d. (solid and dotted lines, respectively). Probability P (μ < 24.7 μm) = 0.0082. Scale bars: 100 μm (a) and 20 μm (b,c).
Figure 2
Figure 2. Megakaryocytes maintain quiescence of HSCs in vivo
(a,b) Representative whole-mount images of sternal BM from control (a) and Cxcl4-cre;iDTR mice (b) after 7 days of DT treatment. Arrowheads denote Lin CD48 CD41 CD150+ phenotypic HSCs. Mk are distinguished by their size, morphology and CD41 expression. Vascular endothelial cells are stained with antibodies against CD31 and CD144. Scale bars: 50 μm. (c) Quantification of Mk per cross section of whole-mount images of transverse-shaved femoral BM of control and Cxcl4-cre;iDTR mice after 7 days of DT treatment (representative images are shown in Supplementary Fig. 3a). n = 8 cross sections from four male mice. (d,e) Number of HSCs per femur in control and Cxcl4-cre;iDTR mice (d) and representative FACS plots (e). n = 5 male mice per group. (f) Percentage of CD45.2+ cells in the blood of CD45.1+ mice competitively transplanted with total BM cells purified from the mice analysed in d. (g) Extreme limiting dilution analysis showing the estimated HSC frequency (solid bar) and confidence intervals (dashed lines) in the BM of control or Cxcl4-cre;iDTR mice after 7 days of DT treatment. n = 4 (control group) and n = 5 (Cxcl4-cre;iDTR group) female recipient mice per dilution, except for the 0.2% BM dose (control group n = 5 and Cxcl4-cre;iDTR group n = 4). (h,i) Percentage of proliferating HSCs in the BM of control and Cxcl4-cre;iDTR mice (as determined by BrdU incorporation) (h) and representative FACS plots (i). n = 5 male mice per group. (j) Q-PCR analysis of cell cycle-related genes within sorted HSCs. n = 4 independent experiments per group. *P < 0.05, **P < 0.01, ***P < 0.001 (Student's t-test).
Figure 3
Figure 3. Megakaryocytes control HSC quiescence via Cxcl4
(a) Left, gating strategy for sorting of Mk and immunofluorescence image of a Mk sorted accordingly. Right, Q-PCR analysis of HSC quiescence or proliferation-related genes in Mk. n = 3-7 independent experiments. (b) Bar graphs shows Cxcl4 mRNA levels in BM cell populations. n = 3 samples per cell type, except for Mk (n = 6) and total BM (n = 5). The upper panels show high power images of sorted Mk from C57BL/6 wild-type (WT) and Cxcl4−/− mice stained with anti-Cxcl4 antibody and DAPI. (c) Concentration of Cxcl4 in BMEF of control and Cxcl4-cre;iDTR mice after DT treatment, determined by ELISA. n = 5 independent samples per group. (d) Percentage of proliferating BrdU+ HSCs in cultures of Lineage cells. (e) Number of HSCs per femur in male mice treated with PBS (n = 5) or 0.2 μg and 1 μg Cxcl4 (n = 4). (f) Percentage of CD45.2+ cells in the blood of CD45.1+ mice competitively transplanted with total BM cells purified from the mice analysed in (e). n = 5 (PBS group and 0.2 μg Cxcl4 group) and n = 4 (1 μg Cxcl4 group) female recipient mice. (g) Number of HSCs per femur and percentage of proliferating HSCs, in WT and Cxcl4−/− mice. n = 3 (WT) and n = 5 (Cxcl4−/−) female mice per group. (h) Percentage of CD45.2+ cells in the blood of CD45.1+ mice competitively transplanted with total BM cells purified from the mice analysed in (g). n = 5 female recipient mice per group. (i,j) Number of HSCs per femur and percentage of proliferating HSCs in the BM of Cxcl4−/− (i) and Cxcl4-cre; iDTR (j) mice injected with either PBS or 1 μg Cxcl4 during seven days. n = 3 (Cxcl4−/−) and n = 4 (Cxcl4-cre;iDTR) male mice per group. *P < 0.05, **P < 0.01, ***P < 0.001, ****P < 0.0001 (Student's t-test). Scale bars: 20 μm.
Figure 4
Figure 4. Megakaryocytes regulate HSC quiescence independently from arterioles
(ac) Representative whole-mount image of a sternum compartment (a) and magnified high power views (b,c). Arterioles are identified by CD31+ CD144+ Sca-1+ expression. Yellow arrowheads denote Lin CD48 CD41 CD150+ phenotypic HSCs and Mk are distinguished by their size, morphology and CD41 expression. (b,c) Illustrative images of the measured distances (yellow dashed lines) between HSCs and Mk as well as arterioles in the BM. Scale bars: 100 μm. (d) Two dimensional probability distribution of the distances between HSCs and Mk or arterioles in the sternal BM. From left to right: HSC distribution model in wild-type control animals (Actual; n = 260 HSCs), randomized HSC distribution models generated by computational simulations of random HSC localization (Random 1; n = 1000 HSCs) and random HSC and Mk localizations (Random 2; n = 1000 HSCs) and HSC distribution model in Cxcl4−/− mice (n = 128 HSCs). (e,f) Localization of HSCs relative to arterioles (e) and to Mk (f) in Cxcl4−/− and control mice. Two–sample Kolmogorov-Smirnov test: (e) P = 0.9865 and (f) P < 0.0001. (g) Localization of HSCs relative to arterioles in control (n = 268 HSCs) and Cxcl4-cre;iDTR mice (n = 544 HSCs) after 7 days of DT treatment. Two–sample Kolmogorov-Smirnov test; P = 0.2837. (hj) Absolute numbers of HSCs adjacent (h; 0 μm), in close proximity (i; <20 μm) and distant from arterioles (j; >20 μm) per sternal segment. The student's t-test was used to determine statistical significance in hj; *P < 0.05; ns, non-significant.

Similar articles

Cited by

References

    1. Orford KW, Scadden DT. Deconstructing stem cell self-renewal: genetic insights into cell-cycle regulation. Nat Rev Genet. 2008;9:115–128. - PubMed
    1. Bianco P. Bone and the hematopoietic niche: a tale of two stem cells. Blood. 2011;117:5281–5288. - PubMed
    1. Mercier FE, Ragu C, Scadden DT. The bone marrow at the crossroads of blood and immunity. Nat Rev Immunol. 2012;12:49–60. - PMC - PubMed
    1. Yamazaki S, et al. Nonmyelinating schwann cells maintain hematopoietic stem cell hibernation in the bone marrow niche. Cell. 2011;147:1146–1158. - PubMed
    1. Ding L, Saunders TL, Enikolopov G, Morrison SJ. Endothelial and perivascular cells maintain haematopoietic stem cells. Nature. 2012;481:457–462. - PMC - PubMed

Publication types

Substances