

Aggravation of ovalbumin-induced murine asthma by co-exposure to desert-dust and organic chemicals: an animal model study
- PMID: 25326908
- PMCID: PMC4216376
- DOI: 10.1186/1476-069X-13-83
Aggravation of ovalbumin-induced murine asthma by co-exposure to desert-dust and organic chemicals: an animal model study
Abstract
Background: The organic chemicals present in Asian sand dust (ASD) might contribute to the aggravation of lung eosinophila. Therefore, the aggravating effects of the Tar fraction from ASD on ovalbumin (OVA)-induced lung eosinophilia were investigated.
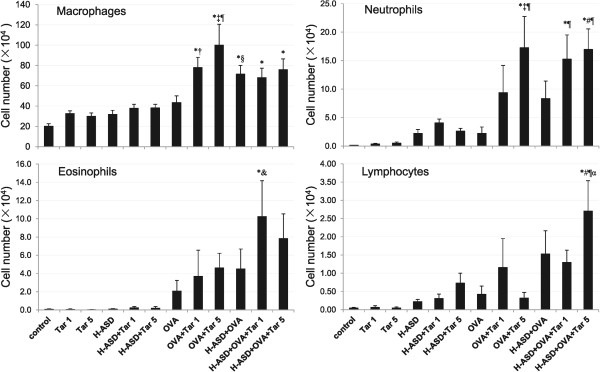
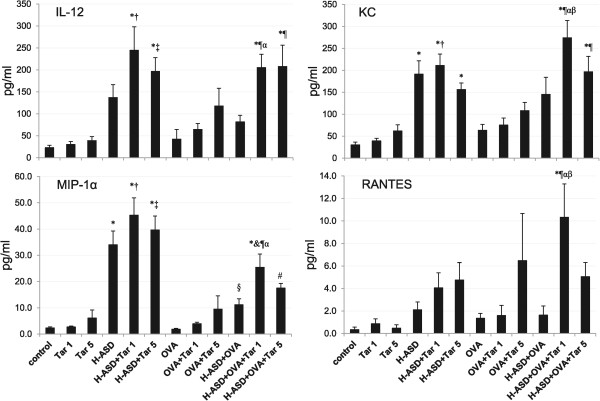
Methods: The Tar fraction was extracted from ASD collected from the atmosphere in Fukuoka, Japan. ASD collected from the Gobi desert was heated at 360°C to inactivate toxic organic substances (H-ASD). ICR mice were instilled intratracheally with 12 different test samples prepared with Tar (1 μg and 5 μg), H-ASD, and OVA in a normal saline solution containing 0.02% Tween 80. The lung pathology, cytological profiles in the bronchoalveolar lavage fluid (BALF), inflammatory cytokines/chemokines in BALF and OVA-specific immunoglobulin in serum were investigated.
Results: Several kinds of polycyclic aromatic hydrocarbons (PAHs) were detected in the Tar sample. H-ASD + Tar 5 μg induced slight neutrophilic lung inflammation. In the presence of OVA, Tar 5 μg increased the level of eosinophils slightly and induced trace levels of Th2 cytokines IL-5 and IL-13 in BALF. Also mild to moderate goblet cell proliferation and mild infiltration of eosinophils in the submucosa of airway were observed. These pathological changes caused by H-ASD + OVA were relatively small. However, in the presence of OVA and H-ASD, Tar, at as low a level as 1 μg, induced severe eosinophil infiltration and proliferation of goblet cells in the airways and significantly increased Th2 cytokines IL-5 and IL-13 in BALF. The mixture showed an adjuvant effect on OVA-specific IgG1 production.
Conclusions: These results indicate that H-ASD with even low levels of Tar exacerbates OVA-induced lung eosinophilia via increases of Th2-mediated cytokines. These results suggest that ASD-bound PAHs might contribute to the aggravation of lung eosinophila.
Figures


Similar articles
-
Mechanisms underlying the health effects of desert sand dust.Environ Int. 2021 Dec;157:106790. doi: 10.1016/j.envint.2021.106790. Epub 2021 Jul 29. Environ Int. 2021. PMID: 34333291 Free PMC article. Review.
-
Enhancement of OVA-induced murine lung eosinophilia by co-exposure to contamination levels of LPS in Asian sand dust and heated dust.Allergy Asthma Clin Immunol. 2014 Jun 9;10(1):30. doi: 10.1186/1710-1492-10-30. eCollection 2014. Allergy Asthma Clin Immunol. 2014. PMID: 24982682 Free PMC article.
-
Differences in allergic inflammatory responses between urban PM2.5 and fine particle derived from desert-dust in murine lungs.Toxicol Appl Pharmacol. 2016 Apr 15;297:41-55. doi: 10.1016/j.taap.2016.02.017. Epub 2016 Feb 23. Toxicol Appl Pharmacol. 2016. PMID: 26917405
-
The effects of microbial materials adhered to Asian sand dust on allergic lung inflammation.Arch Environ Contam Toxicol. 2008 Oct;55(3):348-57. doi: 10.1007/s00244-007-9128-8. Epub 2008 Jan 29. Arch Environ Contam Toxicol. 2008. PMID: 18227959
-
PM2.5-rich dust collected from the air in Fukuoka, Kyushu, Japan, can exacerbate murine lung eosinophilia.Inhal Toxicol. 2015;27(6):287-99. doi: 10.3109/08958378.2015.1045051. Epub 2015 May 28. Inhal Toxicol. 2015. PMID: 26017186
Cited by
-
Interactions between polycyclic aromatic hydrocarbons and epoxide hydrolase 1 play roles in asthma.Environ Geochem Health. 2019 Feb;41(1):191-210. doi: 10.1007/s10653-018-0201-1. Epub 2018 Oct 6. Environ Geochem Health. 2019. PMID: 30293161 Review.
-
Development and evaluation of a physics-based windblown dust emission scheme implemented in the CMAQ modeling system.J Adv Model Earth Syst. 2017 Mar;9(1):585-608. doi: 10.1002/2016MS000823. J Adv Model Earth Syst. 2017. PMID: 30245776 Free PMC article.
-
Mechanisms underlying the health effects of desert sand dust.Environ Int. 2021 Dec;157:106790. doi: 10.1016/j.envint.2021.106790. Epub 2021 Jul 29. Environ Int. 2021. PMID: 34333291 Free PMC article. Review.
-
Co-exposure to lipopolysaccharide and desert dust causes exacerbation of ovalbumin-induced allergic lung inflammation in mice via TLR4/MyD88-dependent and -independent pathways.Allergy Asthma Clin Immunol. 2019 Dec 18;15:82. doi: 10.1186/s13223-019-0396-4. eCollection 2019. Allergy Asthma Clin Immunol. 2019. PMID: 31889961 Free PMC article.
-
Assessing susceptibility for polycyclic aromatic hydrocarbon toxicity in an in vitro 3D respiratory model for asthma.Front Toxicol. 2024 Apr 19;6:1287863. doi: 10.3389/ftox.2024.1287863. eCollection 2024. Front Toxicol. 2024. PMID: 38706568 Free PMC article.
References
-
- Cadelis G, Tourres R, Molinie J. Short-term effects of the particulate pollutants contained in saharan dust on the visits of children to the emergency department due to asthmatic conditions in Guadeloupe (French Archipelago of the Caribbean) PLoS One. 2014;6(9):e91136. doi: 10.1371/journal.pone.0091136. - DOI - PMC - PubMed
Publication types
MeSH terms
Substances
LinkOut - more resources
Full Text Sources
Other Literature Sources
