. 2015 Jul;42(1):136-44.
doi: 10.1002/jmri.24773. Epub 2014 Oct 18.

Sensitivity and specificity of univariate MRI analysis of experimentally degraded cartilage under clinical imaging conditions

Affiliations

Sensitivity and specificity of univariate MRI analysis of experimentally degraded cartilage under clinical imaging conditions

Vanessa A Lukas et al. J Magn Reson Imaging. 2015 Jul.

Abstract

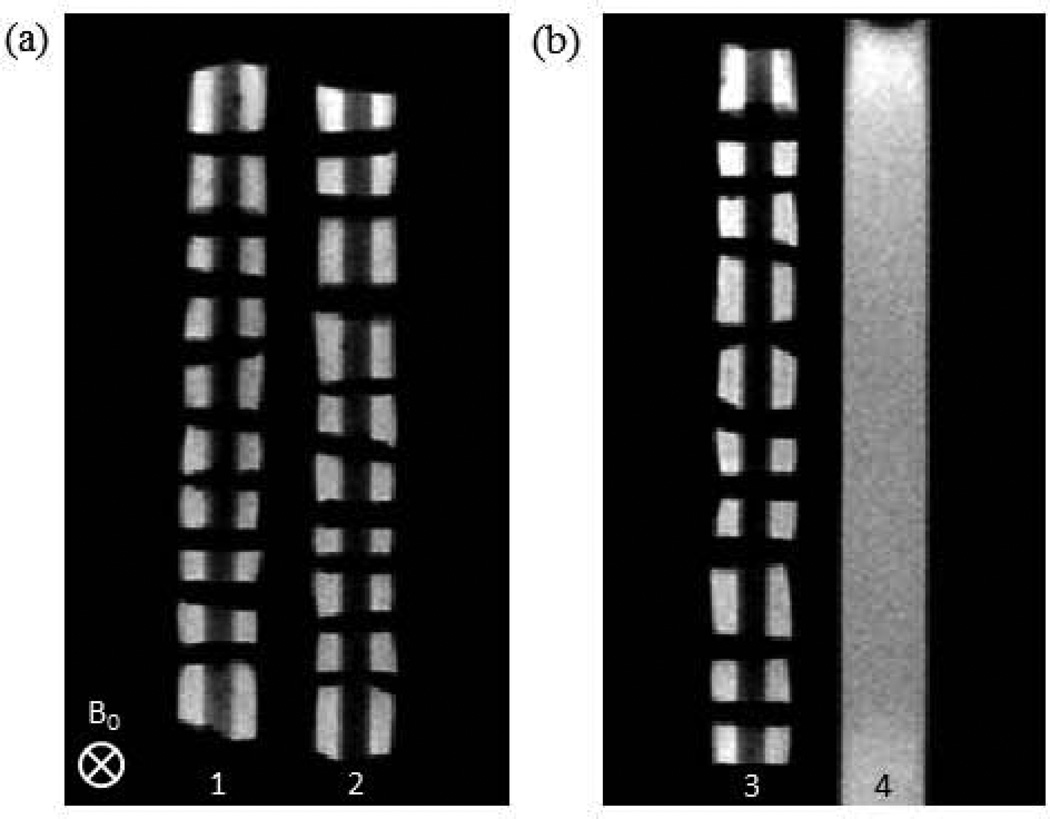
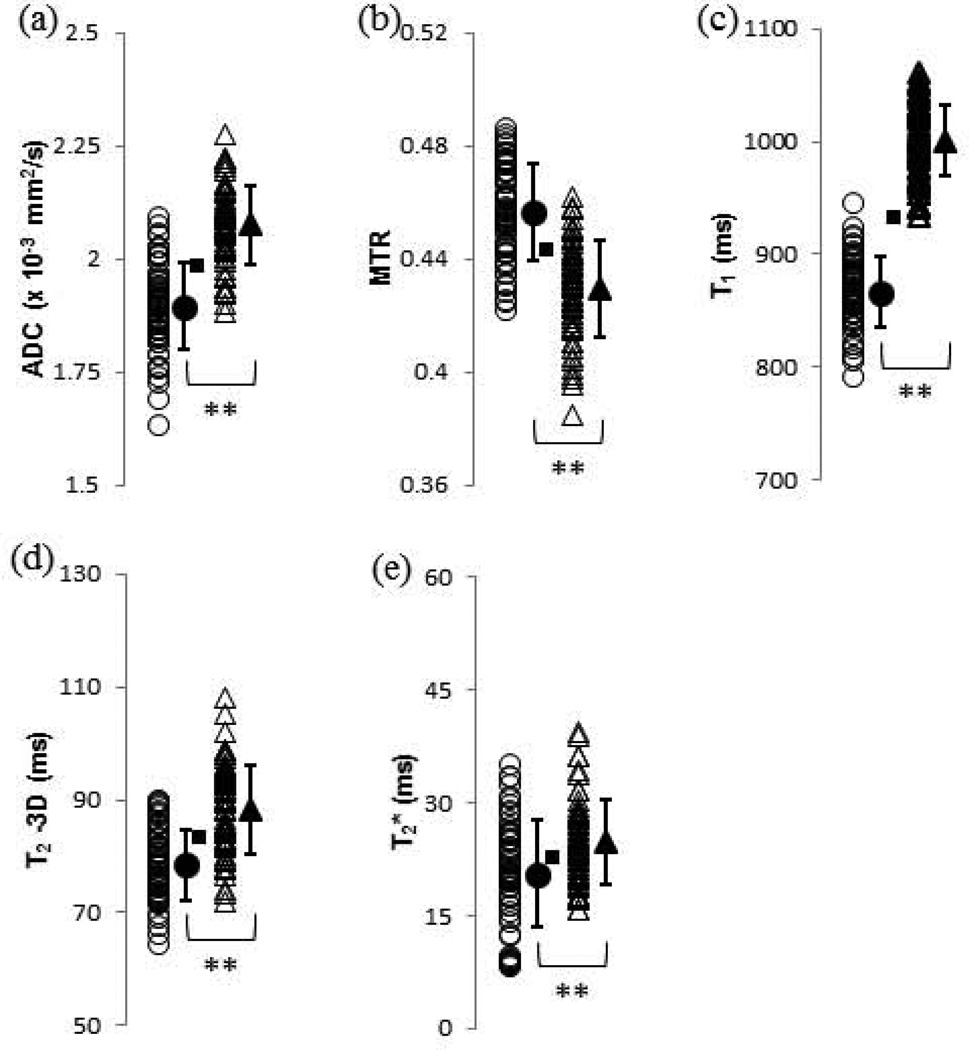
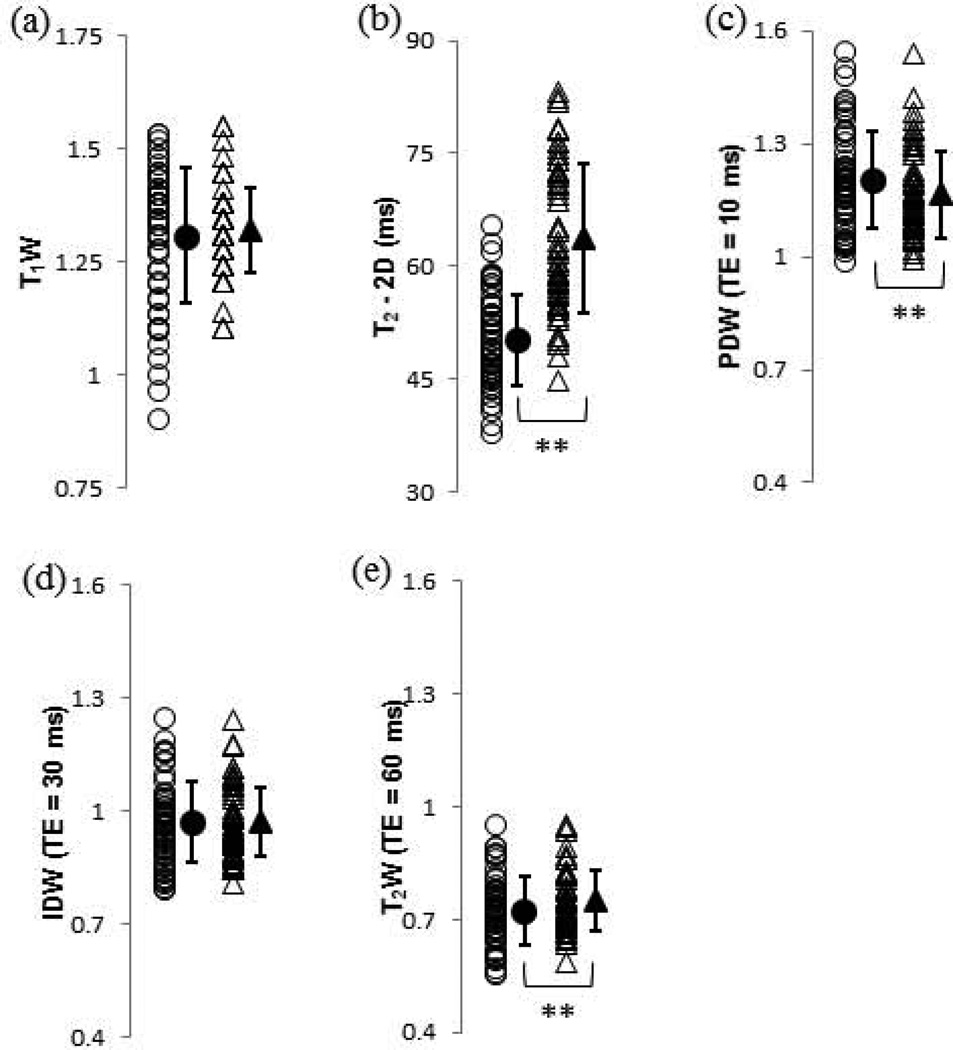
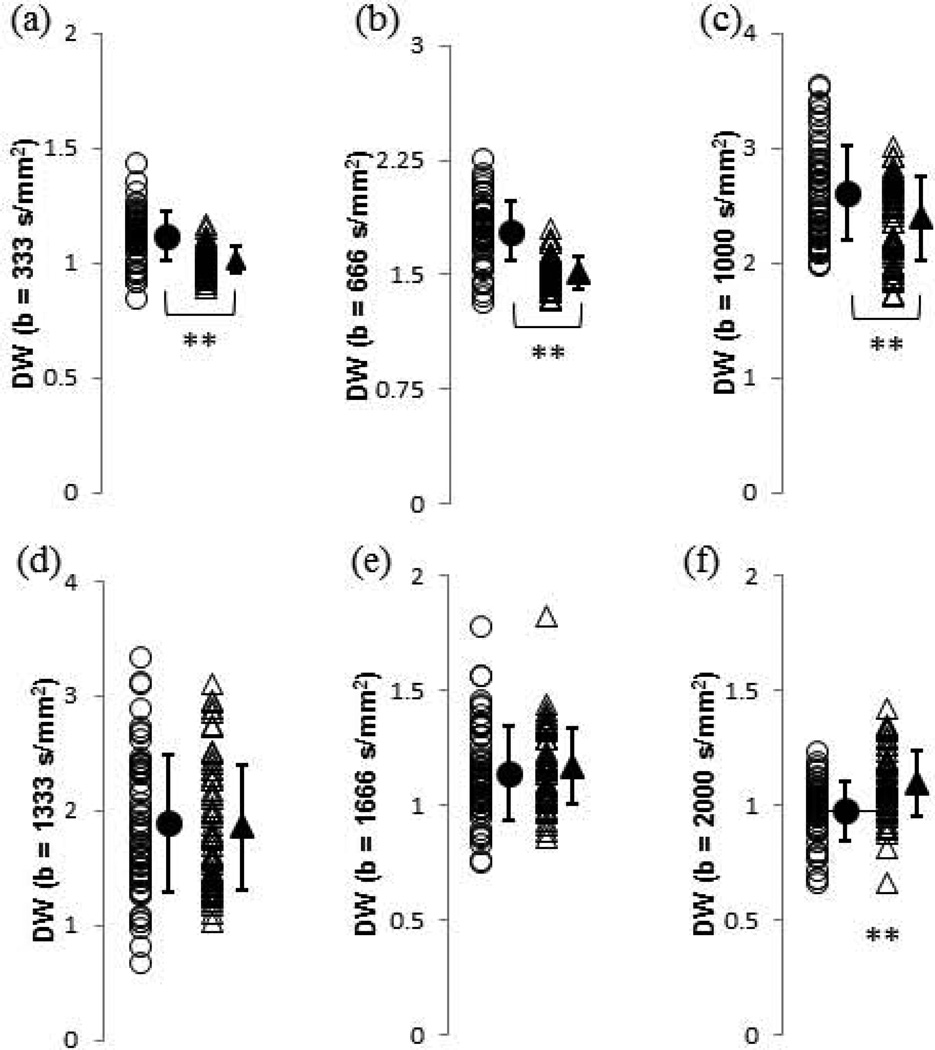
Background: To evaluate the sensitivity and specificity of classification of pathomimetically degraded bovine nasal cartilage at 3 Tesla and 37°C using univariate MRI measurements of both pure parameter values and intensities of parameter-weighted images.

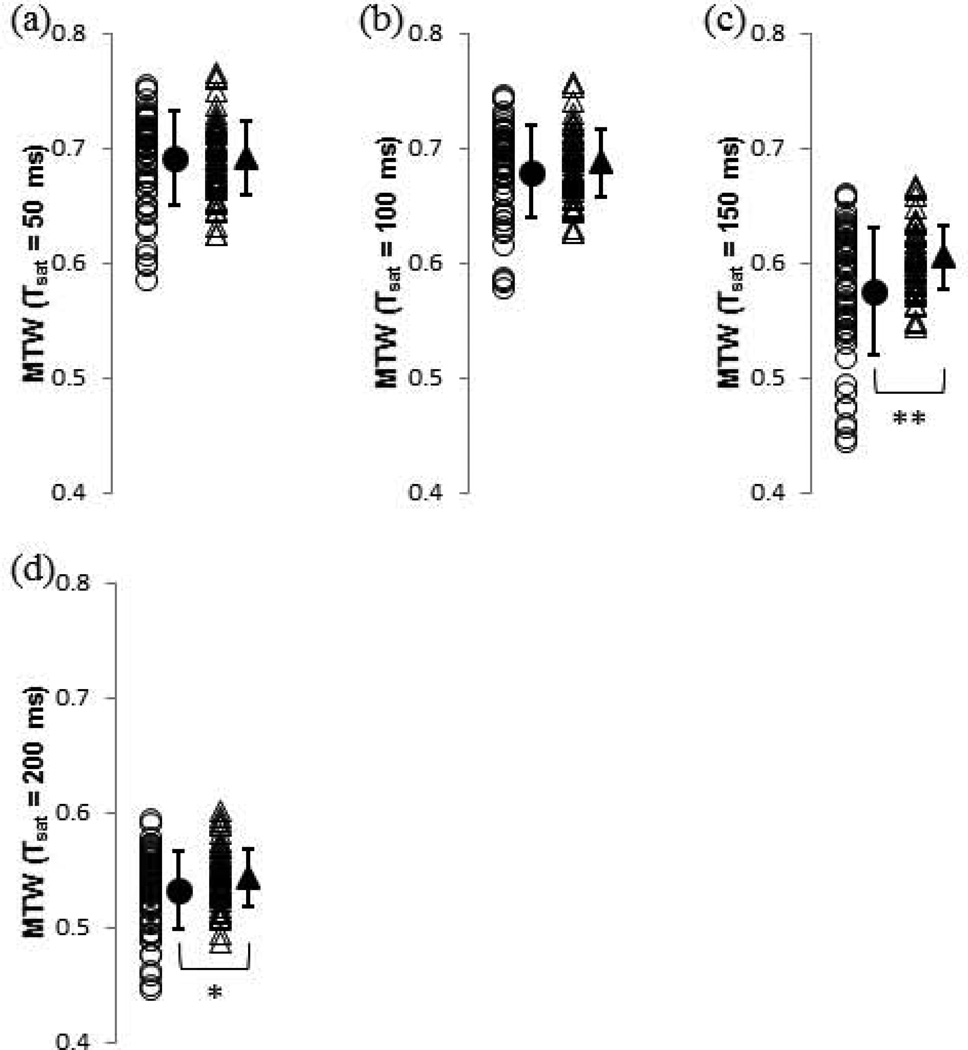
Methods: Pre- and posttrypsin degradation values of T1 , T2 , T2 *, magnetization transfer ratio (MTR), and apparent diffusion coefficient (ADC), and corresponding weighted images, were analyzed. Classification based on the Euclidean distance was performed and the quality of classification was assessed through sensitivity, specificity and accuracy (ACC).

Results: The classifiers with the highest accuracy values were ADC (ACC = 0.82 ± 0.06), MTR (ACC = 0.78 ± 0.06), T1 (ACC = 0.99 ± 0.01), T2 derived from a three-dimensional (3D) spin-echo sequence (ACC = 0.74 ± 0.05), and T2 derived from a 2D spin-echo sequence (ACC = 0.77 ± 0.06), along with two of the diffusion-weighted signal intensities (b = 333 s/mm(2) : ACC = 0.80 ± 0.05; b = 666 s/mm(2) : ACC = 0.85 ± 0.04). In particular, T1 values differed substantially between the groups, resulting in atypically high classification accuracy. The second-best classifier, diffusion weighting with b = 666 s/mm(2) , as well as all other parameters evaluated, exhibited substantial overlap between pre- and postdegradation groups, resulting in decreased accuracies.

Conclusion: Classification according to T1 values showed excellent test characteristics (ACC = 0.99), with several other parameters also showing reasonable performance (ACC > 0.70). Of these, diffusion weighting is particularly promising as a potentially practical clinical modality. As in previous work, we again find that highly statistically significant group mean differences do not necessarily translate into accurate clinical classification rules.

Keywords: bovine nasal cartilage; classification; osteoarthritis; quantitative MRI; sensitivity; specificity.


Figures

FIGURE 1
FIGURE 1
Proton density weighted images (2D spin echo with TE = 10 ms) of the ULTEM sample holder containing ten BNC plugs per well (wells 1, 2, and 3), along with a DPBS standard (well 4) for intensity normalization of weighted images. BNC plugs were threaded onto hollow polyethylene tubes and separated by Teflon spacers. A single ROI consisted of two BNC regions, on either side of a polyethylene tube, from a single plug. These images indicate the slice orientation for each contrast modality. Note that the first slice bisected wells 1 and 2 (a), while the second bisected wells 3 and 4 (b).
FIGURE 2
FIGURE 2
Values of pure MR parameters for control (open circles) and 2.5-h trypsin-degraded (open triangles) BNC samples. Group means and standard deviations are shown as adjacent solid shapes and error bars. The classification boundary based on the Euclidean distance metric is indicated with a square to indicate which samples which would have been misclassified based on the group means of the total set of control (n = 60) and 2.5-h trypsin degraded (n = 60) datasets. The actual classification results were obtained using a cross-validation procedure as described in the text. (a) ADC, with 12 control and 9 degraded misclassified samples; (b) MTR, with 15 control and 12 degraded misclassified samples; (c) T1, with 1 control and 0 degraded misclassified samples; (d) T2 – 3D, with 13 control and 17 degraded misclassified samples; and (e) T2*, with 22 control and 23 degraded misclassified samples. * p < 0.05 control vs. 2.5-h trypsin, ** p < 0.01 control vs. 2.5-h trypsin
FIGURE 3
FIGURE 3
Values of the DPBS-normalized T1 weighted MRI measurements, T2 relaxation time, and T2 weighted MRI measurements obtained using the OAI protocol for control (open circles) and 2.5-h trypsin degraded (open triangles) BNC samples. Group means and standard deviations are shown as adjacent solid shapes and error bars. (a) T1W; (b) T2 – 2D (ms); (c) PDW (TE = 10 ms); (d) IDW (TE = 30 ms) and (e) T2W (TE = 60 ms). * p < 0.05 control vs. 2.5-h trypsin, ** p < 0.01 control vs. 2.5-h trypsin
FIGURE 4
FIGURE 4
Values of DPBS-normalized diffusion-weighted MRI measurements for control (open circles) and 2.5-h trypsin degraded (open triangles) BNC samples. Group means and standard deviations are shown as adjacent solid shapes and error bars. (a) DW (b = 333 s/mm2); (b) DW (b = 666 s/mm2); (c) DW (b = 1000 s/mm2); (d) DW (b = 1333 s/mm2); (e) DW (b = 1666 s/mm2); and (f) DW (b = 2000 s/mm2). * p < 0.05 control vs. 2.5-h trypsin, ** p < 0.01 control vs. 2.5-h trypsin
FIGURE 5
FIGURE 5
Values of DPBS-normalized magnetization transfer-weighted MRI measurements for control (open circles) and 2.5-h trypsin degraded (open triangles) BNC samples. Group means and standard deviations are shown as adjacent solid shapes and error bars. (a) MTW (Tsat = 50 ms); (b) MTW (Tsat = 100 ms); (c) MTW (Tsat = 150 ms); and (d) MTW (Tsat = 200 ms). * p < 0.05 control vs. 2.5-h trypsin, ** p < 0.01 control vs. 2.5-h trypsin

References

    1. Regatte RR, Akella SV, Reddy R. Depth-dependent proton magnetization transfer in articular cartilage. J Magn Reson Imaging. 2005;22:318–323. - PubMed
    1. Mlynarik V, Sulzbacher I, Bittsansky M, Fuiko R, Trattnig S. Investigation of apparent diffusion constant as an indicator of early degenerative disease in articular cartilage. Journal of Magnetic Resonance Imaging. 2003;17:440–444. - PubMed
    1. Lin PC, Reiter DA, Spencer RG. Classification of degraded cartilage through multiparametric MRI analysis. Journal Of Magnetic Resonance. 2009;201:61–71. - PMC - PubMed
    1. Nissi MJ, Toyras J, Laasanen MS, et al. Proteoglycan and collagen sensitive MRI evaluation of normal and degenerated articular cartilage. Journal of Orthopaedic Research. 2004;22:557–564. - PubMed
    1. Wiener E, Pfirrmann CW, Hodler J. Spatial variation in T1 of healthy human articular cartilage of the knee joint. Br J Radiol. 2010;83:476–485. - PMC - PubMed

Publication types

MeSH terms