

Functional connectivity in the resting-state motor networks influences the kinematic processes during motor sequence learning
- PMID: 25328043
- PMCID: PMC4396877
- DOI: 10.1111/ejn.12755
Functional connectivity in the resting-state motor networks influences the kinematic processes during motor sequence learning
Abstract
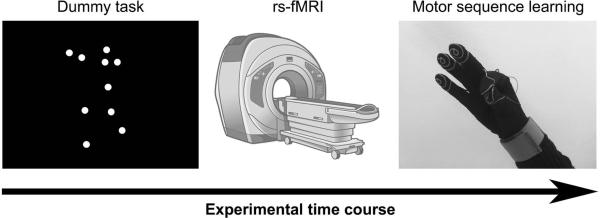
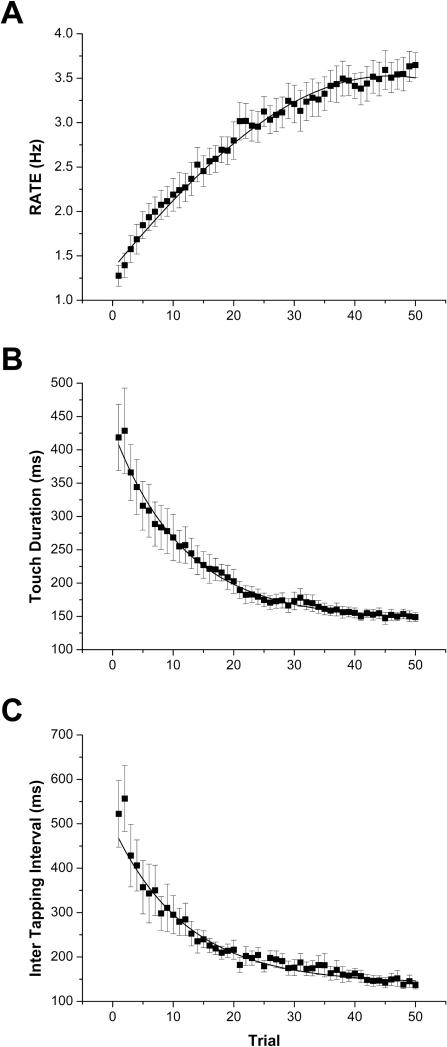
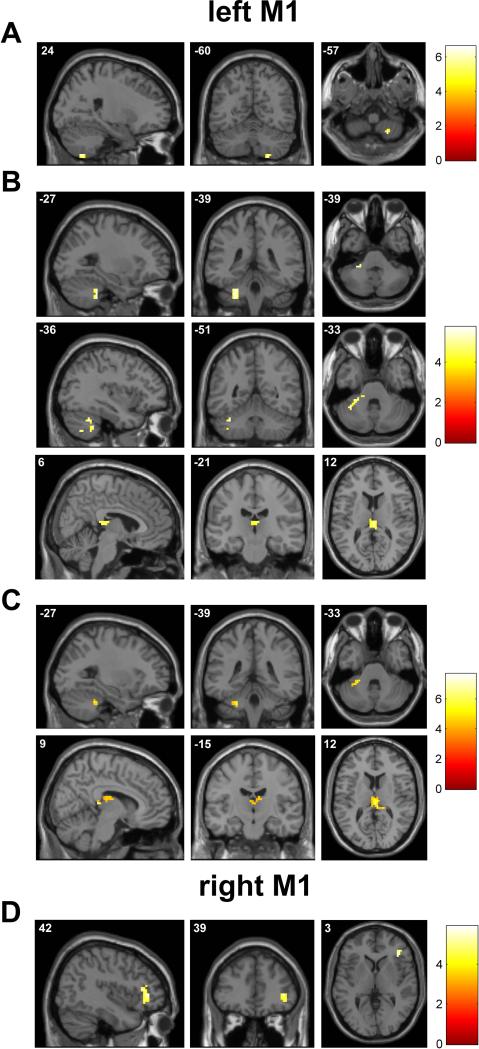
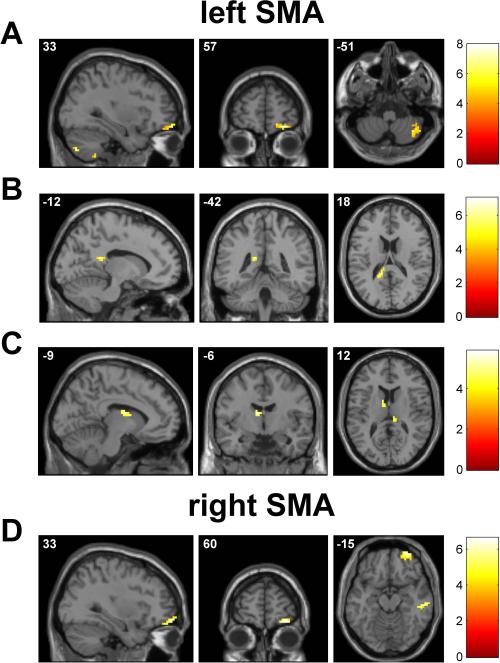
Neuroimaging studies support the involvement of the cerebello-cortical and striato-cortical motor loops in motor sequence learning. Here, we investigated whether the gain of motor sequence learning could depend on a-priori resting-state functional connectivity (rsFC) between motor areas and structures belonging to these circuits. Fourteen healthy subjects underwent a resting-state functional magnetic resonance imaging session. Afterward, they were asked to reproduce a verbally-learned sequence of finger opposition movements as fast and as accurately as possible. All subjects increased their movement rate with practice, by reducing the touch duration and/or intertapping interval. The rsFC analysis showed that, at rest, the left and right primary motor cortex (M1) and left and right supplementary motor area (SMA) were mainly connected with other motor areas. The covariate analysis taking into account the different kinematic parameters indicated that the subjects achieving greater movement rate increase were those showing stronger rsFC of the left M1 and SMA with the right lobule VIII of the cerebellum. Notably, the subjects with greater intertapping interval reduction showed stronger rsFC of the left M1 and SMA with the association nuclei of the thalamus. Conversely, the regression analysis with the right M1 and SMA seeds showed only a few significant clusters for the different covariates not located in the cerebellum and thalamus. No common clusters were found between the right M1 and SMA. All of these findings indicated important functional connections at rest of those neural circuits responsible for motor learning improvement, involving the motor areas related to the hemisphere directly controlling the finger movements, the thalamus and cerebellum.
Keywords: cerebellum; finger movement; human; learning; motor areas; thalamus.
© 2014 Federation of European Neuroscience Societies and John Wiley & Sons Ltd.
Figures

References
-
- Aertsen AM, Gerstein GL, Habib MK, Palm G. Dynamics of neuronal firing correlation: modulation of “effective connectivity”. J Neurophysiol. 1989;61:900–917. - PubMed
-
- Alexander GE, Crutcher MD, DeLong MR. Basal ganglia-thalamocortical circuits: parallel substrates for motor, oculomotor, “prefrontal” and “limbic” functions. Prog Brain Res. 1990;85:119–146. - PubMed
-
- Aoki T, Tsuda H, Takasawa M, Osaki Y, Oku N, Hatazawa J, Kinoshita H. The effect of tapping finger and mode differences on cortical and subcortical activities: a PET study. Exp Brain Res. 2005;160:375–383. - PubMed
-
- Ashe J, Lungu OV, Basford AT, Lu X. Cortical control of motor sequences. Curr Opin Neurobiol. 2006;16:213–221. - PubMed
Publication types
MeSH terms
Grants and funding
LinkOut - more resources
Full Text Sources
Other Literature Sources
